Free Statistics

of Irreproducible Research!

Author's title

Author*The author of this computation has been verified*
R Software Modulerwasp_edauni.wasp
Title produced by softwareUnivariate Explorative Data Analysis
Date of computationThu, 16 Dec 2010 13:34:04 +0000
Cite this page as followsStatistical Computations at FreeStatistics.org, Office for Research Development and Education, URL https://freestatistics.org/blog/index.php?v=date/2010/Dec/16/t12925063668cdjs2pyuk219lz.htm/, Retrieved Fri, 03 May 2024 04:48:37 +0000
Statistical Computations at FreeStatistics.org, Office for Research Development and Education, URL https://freestatistics.org/blog/index.php?pk=110911, Retrieved Fri, 03 May 2024 04:48:37 +0000
QR Codes:

Original text written by user:
IsPrivate?No (this computation is public)
User-defined keywords
Estimated Impact132
Family? (F = Feedback message, R = changed R code, M = changed R Module, P = changed Parameters, D = changed Data)
-     [Univariate Explorative Data Analysis] [s 0650692 paper] [2008-01-15 16:12:35] [d530bc48164a192180949b2df4f47d02]
-  M D    [Univariate Explorative Data Analysis] [] [2010-12-16 13:34:04] [44163a3390d803b6e1dc8c2f0815c192] [Current]
Feedback Forum

Post a new message
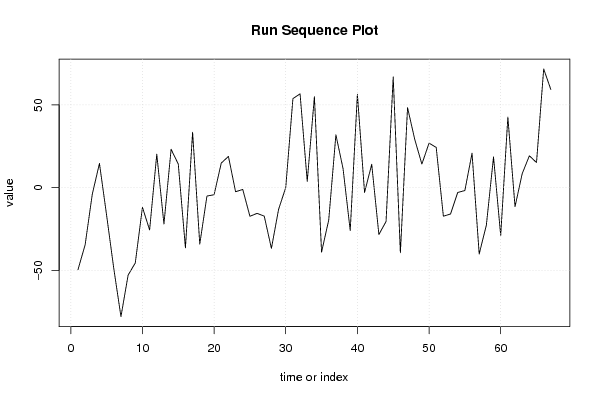
Dataseries X:
-49.5493497703707
-34.5244589213124
-3.91006280789517
14.6313371136598
-16.7358782201586
-48.8615512151807
-77.8868483141492
-52.8243216396381
-45.4459004030628
-11.8820480510030
-25.5304783937354
20.2338922716193
-21.9420653281128
23.1907193380687
14.2843898128731
-36.3573860047354
33.4686325324833
-34.0974551131747
-5.09014031706005
-4.25345940866923
14.8564460348288
18.8607130375245
-2.46525460356892
-1.06098760087327
-17.290892109167
-15.5131820397076
-17.2049426803877
-36.6798487063743
-13.1060400146913
0.0857206259887766
53.7756017864013
56.6662296033538
3.76485816524712
54.9836940524584
-38.9231939514776
-19.5189269487819
31.9337349072222
11.4479582495412
-25.8786696625430
56.3992435318715
-2.89893769557475
14.1096472059418
-28.3133945167058
-20.4064607522117
66.8966785623235
-39.3512642805164
48.3239868281212
29.2125572581408
14.2248044635090
26.8845625839714
24.3119726420195
-17.2382153060072
-15.8952814463814
-2.91808969021696
-1.74390510248044
20.8180121971652
-40.0720823593368
-22.6110947584635
18.5949401206607
-28.866534980105
42.6237678369192
-11.4855992105612
8.39731269593327
19.2448693715856
15.1675048443228
71.6817281866418
59.2586864639942


Summary of computational transaction
Raw Inputview raw input (R code)
Raw Outputview raw output of R engine
Computing time3 seconds
R Server'RServer@AstonUniversity' @ vre.aston.ac.uk

\begin{tabular}{lllllllll}
\hline
Summary of computational transaction \tabularnewline
Raw Input & view raw input (R code)  \tabularnewline
Raw Output & view raw output of R engine  \tabularnewline
Computing time & 3 seconds \tabularnewline
R Server & 'RServer@AstonUniversity' @ vre.aston.ac.uk \tabularnewline
\hline
\end{tabular}
%Source: https://freestatistics.org/blog/index.php?pk=110911&T=0

[TABLE]
[ROW][C]Summary of computational transaction[/C][/ROW]
[ROW][C]Raw Input[/C][C]view raw input (R code) [/C][/ROW]
[ROW][C]Raw Output[/C][C]view raw output of R engine [/C][/ROW]
[ROW][C]Computing time[/C][C]3 seconds[/C][/ROW]
[ROW][C]R Server[/C][C]'RServer@AstonUniversity' @ vre.aston.ac.uk[/C][/ROW]
[/TABLE]
Source: https://freestatistics.org/blog/index.php?pk=110911&T=0

Globally Unique Identifier (entire table): ba.freestatistics.org/blog/index.php?pk=110911&T=0

As an alternative you can also use a QR Code:  

The GUIDs for individual cells are displayed in the table below:

Summary of computational transaction
Raw Inputview raw input (R code)
Raw Outputview raw output of R engine
Computing time3 seconds
R Server'RServer@AstonUniversity' @ vre.aston.ac.uk


Descriptive Statistics
# observations67
minimum-77.8868483141492
Q1-22.2765800432881
median-2.89893769557475
mean-3.51480867628065e-15
Q319.7393808216025
maximum71.6817281866418

\begin{tabular}{lllllllll}
\hline
Descriptive Statistics \tabularnewline
# observations & 67 \tabularnewline
minimum & -77.8868483141492 \tabularnewline
Q1 & -22.2765800432881 \tabularnewline
median & -2.89893769557475 \tabularnewline
mean & -3.51480867628065e-15 \tabularnewline
Q3 & 19.7393808216025 \tabularnewline
maximum & 71.6817281866418 \tabularnewline
\hline
\end{tabular}
%Source: https://freestatistics.org/blog/index.php?pk=110911&T=1

[TABLE]
[ROW][C]Descriptive Statistics[/C][/ROW]
[ROW][C]# observations[/C][C]67[/C][/ROW]
[ROW][C]minimum[/C][C]-77.8868483141492[/C][/ROW]
[ROW][C]Q1[/C][C]-22.2765800432881[/C][/ROW]
[ROW][C]median[/C][C]-2.89893769557475[/C][/ROW]
[ROW][C]mean[/C][C]-3.51480867628065e-15[/C][/ROW]
[ROW][C]Q3[/C][C]19.7393808216025[/C][/ROW]
[ROW][C]maximum[/C][C]71.6817281866418[/C][/ROW]
[/TABLE]
Source: https://freestatistics.org/blog/index.php?pk=110911&T=1

Globally Unique Identifier (entire table): ba.freestatistics.org/blog/index.php?pk=110911&T=1

As an alternative you can also use a QR Code:  

The GUIDs for individual cells are displayed in the table below:

Descriptive Statistics
# observations67
minimum-77.8868483141492
Q1-22.2765800432881
median-2.89893769557475
mean-3.51480867628065e-15
Q319.7393808216025
maximum71.6817281866418


Parameters (Session):
par1 = 0 ; par2 = 36 ;
Parameters (R input):
par1 = 0 ; par2 = 36 ;
R code (references can be found in the software module):
par1 <- as.numeric(par1)
par2 <- as.numeric(par2)
x <- as.ts(x)
library(lattice)
bitmap(file='pic1.png')
plot(x,type='l',main='Run Sequence Plot',xlab='time or index',ylab='value')
grid()
dev.off()
bitmap(file='pic2.png')
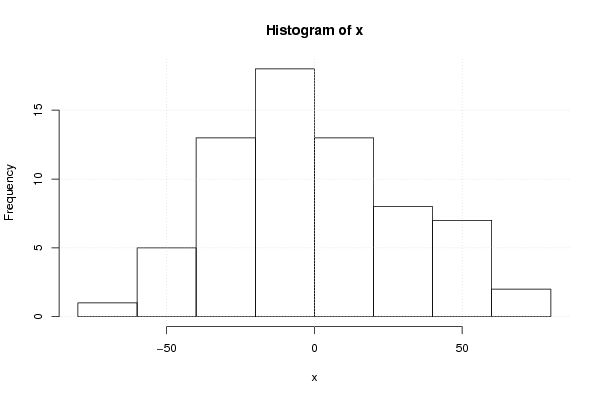
hist(x)
grid()
dev.off()
bitmap(file='pic3.png')
if (par1 > 0)
{
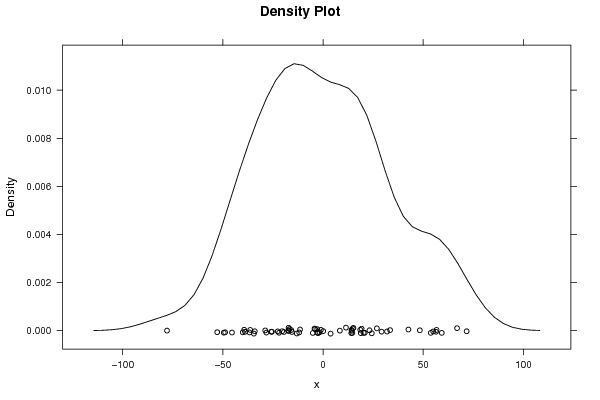
densityplot(~x,col='black',main=paste('Density Plot bw = ',par1),bw=par1)
} else {
densityplot(~x,col='black',main='Density Plot')
}
dev.off()
bitmap(file='pic4.png')
qqnorm(x)
grid()
dev.off()
if (par2 > 0)
{
bitmap(file='lagplot.png')
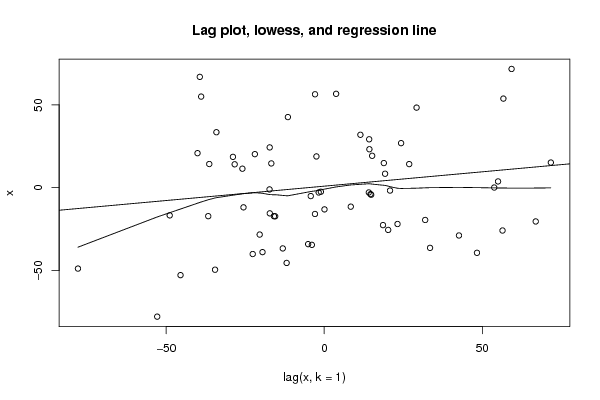
dum <- cbind(lag(x,k=1),x)
dum
dum1 <- dum[2:length(x),]
dum1
z <- as.data.frame(dum1)
z
plot(z,main=paste('Lag plot, lowess, and regression line'))
lines(lowess(z))
abline(lm(z))
dev.off()
bitmap(file='pic5.png')
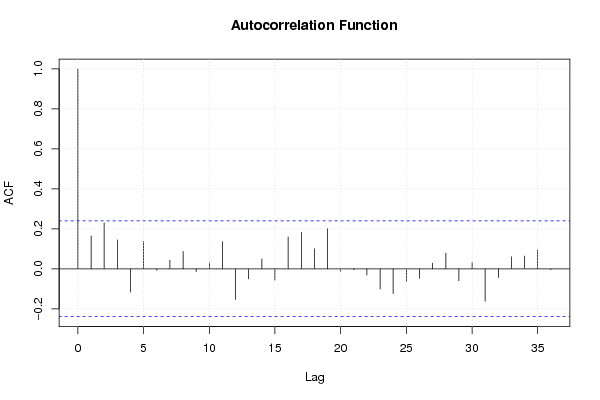
acf(x,lag.max=par2,main='Autocorrelation Function')
grid()
dev.off()
}
summary(x)
load(file='createtable')
a<-table.start()
a<-table.row.start(a)
a<-table.element(a,'Descriptive Statistics',2,TRUE)
a<-table.row.end(a)
a<-table.row.start(a)
a<-table.element(a,'# observations',header=TRUE)
a<-table.element(a,length(x))
a<-table.row.end(a)
a<-table.row.start(a)
a<-table.element(a,'minimum',header=TRUE)
a<-table.element(a,min(x))
a<-table.row.end(a)
a<-table.row.start(a)
a<-table.element(a,'Q1',header=TRUE)
a<-table.element(a,quantile(x,0.25))
a<-table.row.end(a)
a<-table.row.start(a)
a<-table.element(a,'median',header=TRUE)
a<-table.element(a,median(x))
a<-table.row.end(a)
a<-table.row.start(a)
a<-table.element(a,'mean',header=TRUE)
a<-table.element(a,mean(x))
a<-table.row.end(a)
a<-table.row.start(a)
a<-table.element(a,'Q3',header=TRUE)
a<-table.element(a,quantile(x,0.75))
a<-table.row.end(a)
a<-table.row.start(a)
a<-table.element(a,'maximum',header=TRUE)
a<-table.element(a,max(x))
a<-table.row.end(a)
a<-table.end(a)
table.save(a,file='mytable.tab')