Free Statistics

of Irreproducible Research!

Author's title

Author*The author of this computation has been verified*
R Software Modulerwasp_multipleregression.wasp
Title produced by softwareMultiple Regression
Date of computationThu, 16 Dec 2010 12:40:22 +0000
Cite this page as followsStatistical Computations at FreeStatistics.org, Office for Research Development and Education, URL https://freestatistics.org/blog/index.php?v=date/2010/Dec/16/t12925032019r9221r1wbkftog.htm/, Retrieved Fri, 03 May 2024 13:12:36 +0000
Statistical Computations at FreeStatistics.org, Office for Research Development and Education, URL https://freestatistics.org/blog/index.php?pk=110877, Retrieved Fri, 03 May 2024 13:12:36 +0000
QR Codes:

Original text written by user:
IsPrivate?No (this computation is public)
User-defined keywords
Estimated Impact117
Family? (F = Feedback message, R = changed R code, M = changed R Module, P = changed Parameters, D = changed Data)
-     [Multiple Regression] [Q1 The Seatbeltlaw] [2007-11-14 19:27:43] [8cd6641b921d30ebe00b648d1481bba0]
- RMPD  [Multiple Regression] [Seatbelt] [2009-11-12 14:03:14] [b98453cac15ba1066b407e146608df68]
F    D    [Multiple Regression] [] [2010-11-26 13:22:51] [8a9a6f7c332640af31ddca253a8ded58]
-    D      [Multiple Regression] [] [2010-11-30 10:17:26] [fb3a7008aea9486db3846dc25434607b]
-    D        [Multiple Regression] [Multiple regressi...] [2010-12-16 12:34:00] [fb3a7008aea9486db3846dc25434607b]
-   PD          [Multiple Regression] [Multiple regressi...] [2010-12-16 12:37:17] [fb3a7008aea9486db3846dc25434607b]
-   P               [Multiple Regression] [Multiple regressi...] [2010-12-16 12:40:22] [7cc6e89f95359dcad314da35cb7f084f] [Current]
Feedback Forum

Post a new message
Dataseries X:
300	2.26
302	2.57
400	3.07
392	2.76
373	2.51
379	2.87
303	3.14
324	3.11
353	3.16
392	2.47
327	2.57
376	2.89
329	2.63
359	2.38
413	1.69
338	1.96
422	2.19
390	1.87
370	1.60
367	1.63
406	1.22
418	1.21
346	1.49
350	1.64
330	1.66
318	1.77
382	1.82
337	1.78
372	1.28
422	1.29
428	1.37
426	1.12
396	1.51
458	2.24
315	2.94
337	3.09
386	3.46
352	3.64
383	4.39
439	4.15
397	5.21
453	5.80
363	5.91
365	5.39
474	5.46
373	4.72
403	3.14
384	2.63
364	2.32
361	1.93
419	0.62
352	0.60
363	-0.37
410	-1.10
361	-1.68
383	-0.78
342	-1.19
369	-0.79
361	-0.12
317	0.26
386	0.62
318	0.70
407	1.66
393	1.80
404	2.27
498	2.46
438	2.57


Summary of computational transaction
Raw Inputview raw input (R code)
Raw Outputview raw output of R engine
Computing time5 seconds
R Server'Sir Ronald Aylmer Fisher' @ 193.190.124.24

\begin{tabular}{lllllllll}
\hline
Summary of computational transaction \tabularnewline
Raw Input & view raw input (R code)  \tabularnewline
Raw Output & view raw output of R engine  \tabularnewline
Computing time & 5 seconds \tabularnewline
R Server & 'Sir Ronald Aylmer Fisher' @ 193.190.124.24 \tabularnewline
\hline
\end{tabular}
%Source: https://freestatistics.org/blog/index.php?pk=110877&T=0

[TABLE]
[ROW][C]Summary of computational transaction[/C][/ROW]
[ROW][C]Raw Input[/C][C]view raw input (R code) [/C][/ROW]
[ROW][C]Raw Output[/C][C]view raw output of R engine [/C][/ROW]
[ROW][C]Computing time[/C][C]5 seconds[/C][/ROW]
[ROW][C]R Server[/C][C]'Sir Ronald Aylmer Fisher' @ 193.190.124.24[/C][/ROW]
[/TABLE]
Source: https://freestatistics.org/blog/index.php?pk=110877&T=0

Globally Unique Identifier (entire table): ba.freestatistics.org/blog/index.php?pk=110877&T=0

As an alternative you can also use a QR Code:  

The GUIDs for individual cells are displayed in the table below:

Summary of computational transaction
Raw Inputview raw input (R code)
Raw Outputview raw output of R engine
Computing time5 seconds
R Server'Sir Ronald Aylmer Fisher' @ 193.190.124.24


Multiple Linear Regression - Estimated Regression Equation
Aantal_vergunningen[t] = + 314.705816342766 + 5.96101603224808Inflatie[t] -0.418563909059995M1[t] -15.3350853480929M2[t] + 49.3631559583583M3[t] + 23.3517418272819M4[t] + 35.9352203882489M5[t] + 71.9590887888935M6[t] + 23.3604882049137M7[t] + 23.0881467901967M8[t] + 43.9476151187114M9[t] + 51.4070834472261M10[t] -1.10570576335502M11[t] + 0.71011466548467t + e[t]

\begin{tabular}{lllllllll}
\hline
Multiple Linear Regression - Estimated Regression Equation \tabularnewline
Aantal_vergunningen[t] =  +  314.705816342766 +  5.96101603224808Inflatie[t] -0.418563909059995M1[t] -15.3350853480929M2[t] +  49.3631559583583M3[t] +  23.3517418272819M4[t] +  35.9352203882489M5[t] +  71.9590887888935M6[t] +  23.3604882049137M7[t] +  23.0881467901967M8[t] +  43.9476151187114M9[t] +  51.4070834472261M10[t] -1.10570576335502M11[t] +  0.71011466548467t  + e[t] \tabularnewline
\hline
\end{tabular}
%Source: https://freestatistics.org/blog/index.php?pk=110877&T=1

[TABLE]
[ROW][C]Multiple Linear Regression - Estimated Regression Equation[/C][/ROW]
[ROW][C]Aantal_vergunningen[t] =  +  314.705816342766 +  5.96101603224808Inflatie[t] -0.418563909059995M1[t] -15.3350853480929M2[t] +  49.3631559583583M3[t] +  23.3517418272819M4[t] +  35.9352203882489M5[t] +  71.9590887888935M6[t] +  23.3604882049137M7[t] +  23.0881467901967M8[t] +  43.9476151187114M9[t] +  51.4070834472261M10[t] -1.10570576335502M11[t] +  0.71011466548467t  + e[t][/C][/ROW]
[/TABLE]
Source: https://freestatistics.org/blog/index.php?pk=110877&T=1

Globally Unique Identifier (entire table): ba.freestatistics.org/blog/index.php?pk=110877&T=1

As an alternative you can also use a QR Code:  

The GUIDs for individual cells are displayed in the table below:

Multiple Linear Regression - Estimated Regression Equation
Aantal_vergunningen[t] = + 314.705816342766 + 5.96101603224808Inflatie[t] -0.418563909059995M1[t] -15.3350853480929M2[t] + 49.3631559583583M3[t] + 23.3517418272819M4[t] + 35.9352203882489M5[t] + 71.9590887888935M6[t] + 23.3604882049137M7[t] + 23.0881467901967M8[t] + 43.9476151187114M9[t] + 51.4070834472261M10[t] -1.10570576335502M11[t] + 0.71011466548467t + e[t]


Multiple Linear Regression - Ordinary Least Squares
VariableParameterS.D.T-STATH0: parameter = 02-tail p-value1-tail p-value
(Intercept)314.70581634276618.30928317.188300
Inflatie5.961016032248082.619612.27550.0269430.013472
M1-0.41856390905999520.151655-0.02080.9835070.491753
M2-15.335085348092920.141369-0.76140.4498090.224905
M349.363155958358320.1338522.45170.0175450.008773
M423.351741827281920.1281851.16020.2511870.125593
M535.935220388248920.1252941.78560.079890.039945
M671.959088788893520.1251943.57560.0007560.000378
M723.360488204913720.125581.16070.2509510.125475
M823.088146790196721.0367811.09750.2773780.138689
M943.947615118711421.0308922.08970.0414630.020731
M1051.407083447226121.0276522.44470.0178540.008927
M11-1.1057057633550221.021815-0.05260.958250.479125
t0.710114665484670.2182333.25390.0019840.000992

\begin{tabular}{lllllllll}
\hline
Multiple Linear Regression - Ordinary Least Squares \tabularnewline
Variable & Parameter & S.D. & T-STATH0: parameter = 0 & 2-tail p-value & 1-tail p-value \tabularnewline
(Intercept) & 314.705816342766 & 18.309283 & 17.1883 & 0 & 0 \tabularnewline
Inflatie & 5.96101603224808 & 2.61961 & 2.2755 & 0.026943 & 0.013472 \tabularnewline
M1 & -0.418563909059995 & 20.151655 & -0.0208 & 0.983507 & 0.491753 \tabularnewline
M2 & -15.3350853480929 & 20.141369 & -0.7614 & 0.449809 & 0.224905 \tabularnewline
M3 & 49.3631559583583 & 20.133852 & 2.4517 & 0.017545 & 0.008773 \tabularnewline
M4 & 23.3517418272819 & 20.128185 & 1.1602 & 0.251187 & 0.125593 \tabularnewline
M5 & 35.9352203882489 & 20.125294 & 1.7856 & 0.07989 & 0.039945 \tabularnewline
M6 & 71.9590887888935 & 20.125194 & 3.5756 & 0.000756 & 0.000378 \tabularnewline
M7 & 23.3604882049137 & 20.12558 & 1.1607 & 0.250951 & 0.125475 \tabularnewline
M8 & 23.0881467901967 & 21.036781 & 1.0975 & 0.277378 & 0.138689 \tabularnewline
M9 & 43.9476151187114 & 21.030892 & 2.0897 & 0.041463 & 0.020731 \tabularnewline
M10 & 51.4070834472261 & 21.027652 & 2.4447 & 0.017854 & 0.008927 \tabularnewline
M11 & -1.10570576335502 & 21.021815 & -0.0526 & 0.95825 & 0.479125 \tabularnewline
t & 0.71011466548467 & 0.218233 & 3.2539 & 0.001984 & 0.000992 \tabularnewline
\hline
\end{tabular}
%Source: https://freestatistics.org/blog/index.php?pk=110877&T=2

[TABLE]
[ROW][C]Multiple Linear Regression - Ordinary Least Squares[/C][/ROW]
[ROW][C]Variable[/C][C]Parameter[/C][C]S.D.[/C][C]T-STATH0: parameter = 0[/C][C]2-tail p-value[/C][C]1-tail p-value[/C][/ROW]
[ROW][C](Intercept)[/C][C]314.705816342766[/C][C]18.309283[/C][C]17.1883[/C][C]0[/C][C]0[/C][/ROW]
[ROW][C]Inflatie[/C][C]5.96101603224808[/C][C]2.61961[/C][C]2.2755[/C][C]0.026943[/C][C]0.013472[/C][/ROW]
[ROW][C]M1[/C][C]-0.418563909059995[/C][C]20.151655[/C][C]-0.0208[/C][C]0.983507[/C][C]0.491753[/C][/ROW]
[ROW][C]M2[/C][C]-15.3350853480929[/C][C]20.141369[/C][C]-0.7614[/C][C]0.449809[/C][C]0.224905[/C][/ROW]
[ROW][C]M3[/C][C]49.3631559583583[/C][C]20.133852[/C][C]2.4517[/C][C]0.017545[/C][C]0.008773[/C][/ROW]
[ROW][C]M4[/C][C]23.3517418272819[/C][C]20.128185[/C][C]1.1602[/C][C]0.251187[/C][C]0.125593[/C][/ROW]
[ROW][C]M5[/C][C]35.9352203882489[/C][C]20.125294[/C][C]1.7856[/C][C]0.07989[/C][C]0.039945[/C][/ROW]
[ROW][C]M6[/C][C]71.9590887888935[/C][C]20.125194[/C][C]3.5756[/C][C]0.000756[/C][C]0.000378[/C][/ROW]
[ROW][C]M7[/C][C]23.3604882049137[/C][C]20.12558[/C][C]1.1607[/C][C]0.250951[/C][C]0.125475[/C][/ROW]
[ROW][C]M8[/C][C]23.0881467901967[/C][C]21.036781[/C][C]1.0975[/C][C]0.277378[/C][C]0.138689[/C][/ROW]
[ROW][C]M9[/C][C]43.9476151187114[/C][C]21.030892[/C][C]2.0897[/C][C]0.041463[/C][C]0.020731[/C][/ROW]
[ROW][C]M10[/C][C]51.4070834472261[/C][C]21.027652[/C][C]2.4447[/C][C]0.017854[/C][C]0.008927[/C][/ROW]
[ROW][C]M11[/C][C]-1.10570576335502[/C][C]21.021815[/C][C]-0.0526[/C][C]0.95825[/C][C]0.479125[/C][/ROW]
[ROW][C]t[/C][C]0.71011466548467[/C][C]0.218233[/C][C]3.2539[/C][C]0.001984[/C][C]0.000992[/C][/ROW]
[/TABLE]
Source: https://freestatistics.org/blog/index.php?pk=110877&T=2

Globally Unique Identifier (entire table): ba.freestatistics.org/blog/index.php?pk=110877&T=2

As an alternative you can also use a QR Code:  

The GUIDs for individual cells are displayed in the table below:

Multiple Linear Regression - Ordinary Least Squares
VariableParameterS.D.T-STATH0: parameter = 02-tail p-value1-tail p-value
(Intercept)314.70581634276618.30928317.188300
Inflatie5.961016032248082.619612.27550.0269430.013472
M1-0.41856390905999520.151655-0.02080.9835070.491753
M2-15.335085348092920.141369-0.76140.4498090.224905
M349.363155958358320.1338522.45170.0175450.008773
M423.351741827281920.1281851.16020.2511870.125593
M535.935220388248920.1252941.78560.079890.039945
M671.959088788893520.1251943.57560.0007560.000378
M723.360488204913720.125581.16070.2509510.125475
M823.088146790196721.0367811.09750.2773780.138689
M943.947615118711421.0308922.08970.0414630.020731
M1051.407083447226121.0276522.44470.0178540.008927
M11-1.1057057633550221.021815-0.05260.958250.479125
t0.710114665484670.2182333.25390.0019840.000992


Multiple Linear Regression - Regression Statistics
Multiple R0.707630098284765
R-squared0.500740355998506
Adjusted R-squared0.378280443318894
F-TEST (value)4.08901447862843
F-TEST (DF numerator)13
F-TEST (DF denominator)53
p-value0.000122121050988078
Multiple Linear Regression - Residual Statistics
Residual Standard Deviation33.2330516823352
Sum Squared Residuals58535.0933784005

\begin{tabular}{lllllllll}
\hline
Multiple Linear Regression - Regression Statistics \tabularnewline
Multiple R & 0.707630098284765 \tabularnewline
R-squared & 0.500740355998506 \tabularnewline
Adjusted R-squared & 0.378280443318894 \tabularnewline
F-TEST (value) & 4.08901447862843 \tabularnewline
F-TEST (DF numerator) & 13 \tabularnewline
F-TEST (DF denominator) & 53 \tabularnewline
p-value & 0.000122121050988078 \tabularnewline
Multiple Linear Regression - Residual Statistics \tabularnewline
Residual Standard Deviation & 33.2330516823352 \tabularnewline
Sum Squared Residuals & 58535.0933784005 \tabularnewline
\hline
\end{tabular}
%Source: https://freestatistics.org/blog/index.php?pk=110877&T=3

[TABLE]
[ROW][C]Multiple Linear Regression - Regression Statistics[/C][/ROW]
[ROW][C]Multiple R[/C][C]0.707630098284765[/C][/ROW]
[ROW][C]R-squared[/C][C]0.500740355998506[/C][/ROW]
[ROW][C]Adjusted R-squared[/C][C]0.378280443318894[/C][/ROW]
[ROW][C]F-TEST (value)[/C][C]4.08901447862843[/C][/ROW]
[ROW][C]F-TEST (DF numerator)[/C][C]13[/C][/ROW]
[ROW][C]F-TEST (DF denominator)[/C][C]53[/C][/ROW]
[ROW][C]p-value[/C][C]0.000122121050988078[/C][/ROW]
[ROW][C]Multiple Linear Regression - Residual Statistics[/C][/ROW]
[ROW][C]Residual Standard Deviation[/C][C]33.2330516823352[/C][/ROW]
[ROW][C]Sum Squared Residuals[/C][C]58535.0933784005[/C][/ROW]
[/TABLE]
Source: https://freestatistics.org/blog/index.php?pk=110877&T=3

Globally Unique Identifier (entire table): ba.freestatistics.org/blog/index.php?pk=110877&T=3

As an alternative you can also use a QR Code:  

The GUIDs for individual cells are displayed in the table below:

Multiple Linear Regression - Regression Statistics
Multiple R0.707630098284765
R-squared0.500740355998506
Adjusted R-squared0.378280443318894
F-TEST (value)4.08901447862843
F-TEST (DF numerator)13
F-TEST (DF denominator)53
p-value0.000122121050988078
Multiple Linear Regression - Residual Statistics
Residual Standard Deviation33.2330516823352
Sum Squared Residuals58535.0933784005


Multiple Linear Regression - Actuals, Interpolation, and Residuals
Time or IndexActualsInterpolationForecastResidualsPrediction Error
1300328.469263332072-28.469263332072
2302316.110771528520-14.1107715285204
3400384.4996355165815.5003644834197
4392357.35042108099234.6495789190083
5373369.1537602993813.84623970061865
6379408.03370913712-29.0337091371199
7303361.754697547332-58.7546975473317
8324362.013640317132-38.013640317132
9353383.881274112744-30.8812741127438
10392387.9377560444924.06224395550801
11327336.73118310262-9.73118310262034
12376340.45452866177935.5454713382206
13329339.196215249820-10.1962152498196
14359323.49955446820935.5004455317907
15413384.79480937789428.205190622106
16338361.102984241009-23.1029842410093
17422375.76761115487846.232388845122
18390410.594069090688-20.5940690906878
19370361.0961088434868.90389115651424
20367361.7127125752215.28728742477916
21406380.83827899599925.1617210040015
22418388.94825182967529.0517481703246
23346338.8146617736087.18533822639155
24350341.5246346072858.47536539271465
25330341.935405684355-11.9354056843550
26318328.384710674354-10.384710674354
27382394.091117447902-12.0911174479023
28337368.551377341021-31.5513773410207
29372378.864462551348-6.86446255134831
30422415.65805577786.34194422220001
31428368.24645114188559.7535488581153
32426367.19397038459058.8060296154096
33396391.0883496311664.91165036883351
34458403.60947432870754.390525671293
35315355.979511006184-40.9795110061842
36337358.689483839861-21.6894838398611
37386361.18661052821824.8133894717825
38352348.0531866404743.94681335952606
39383417.932304636596-34.9323046365959
40439391.20036132326547.7996386767354
41397410.812631543899-13.8126315438993
42453451.0636140690551.93638593094517
43363403.830839914107-40.830839914107
44365401.168884828106-36.1688848281057
45474423.15573894436250.8442610556375
46373426.914170074498-53.9141700744983
47403365.6930901984537.3069098015502
48384364.46879245084319.5312075491570
49364362.9124282372711.08757176272920
50361346.38122521114614.6187747888542
51419403.98065018083715.0193498191633
52352378.5601303946-26.5601303946
53363386.071538069771-23.0715380697711
54410418.453979432359-8.45397943235916
55361367.10810421516-6.10810421516018
56383372.91079189495110.0892081050489
57342392.036358315729-50.0363583157288
58369402.590347722627-33.5903477226274
59361354.7815539191376.21844608086284
60317358.862560440231-41.8625604402311
61386361.30007696826524.6999230317349
62318347.570551477297-29.5705514772967
63407418.701482840191-11.7014828401907
64393394.234725619114-1.23472561911373
65404410.329996380722-6.32999638072201
66498448.19657249297849.8034275070217
67438400.96379833803137.0362016619695

\begin{tabular}{lllllllll}
\hline
Multiple Linear Regression - Actuals, Interpolation, and Residuals \tabularnewline
Time or Index & Actuals & InterpolationForecast & ResidualsPrediction Error \tabularnewline
1 & 300 & 328.469263332072 & -28.469263332072 \tabularnewline
2 & 302 & 316.110771528520 & -14.1107715285204 \tabularnewline
3 & 400 & 384.49963551658 & 15.5003644834197 \tabularnewline
4 & 392 & 357.350421080992 & 34.6495789190083 \tabularnewline
5 & 373 & 369.153760299381 & 3.84623970061865 \tabularnewline
6 & 379 & 408.03370913712 & -29.0337091371199 \tabularnewline
7 & 303 & 361.754697547332 & -58.7546975473317 \tabularnewline
8 & 324 & 362.013640317132 & -38.013640317132 \tabularnewline
9 & 353 & 383.881274112744 & -30.8812741127438 \tabularnewline
10 & 392 & 387.937756044492 & 4.06224395550801 \tabularnewline
11 & 327 & 336.73118310262 & -9.73118310262034 \tabularnewline
12 & 376 & 340.454528661779 & 35.5454713382206 \tabularnewline
13 & 329 & 339.196215249820 & -10.1962152498196 \tabularnewline
14 & 359 & 323.499554468209 & 35.5004455317907 \tabularnewline
15 & 413 & 384.794809377894 & 28.205190622106 \tabularnewline
16 & 338 & 361.102984241009 & -23.1029842410093 \tabularnewline
17 & 422 & 375.767611154878 & 46.232388845122 \tabularnewline
18 & 390 & 410.594069090688 & -20.5940690906878 \tabularnewline
19 & 370 & 361.096108843486 & 8.90389115651424 \tabularnewline
20 & 367 & 361.712712575221 & 5.28728742477916 \tabularnewline
21 & 406 & 380.838278995999 & 25.1617210040015 \tabularnewline
22 & 418 & 388.948251829675 & 29.0517481703246 \tabularnewline
23 & 346 & 338.814661773608 & 7.18533822639155 \tabularnewline
24 & 350 & 341.524634607285 & 8.47536539271465 \tabularnewline
25 & 330 & 341.935405684355 & -11.9354056843550 \tabularnewline
26 & 318 & 328.384710674354 & -10.384710674354 \tabularnewline
27 & 382 & 394.091117447902 & -12.0911174479023 \tabularnewline
28 & 337 & 368.551377341021 & -31.5513773410207 \tabularnewline
29 & 372 & 378.864462551348 & -6.86446255134831 \tabularnewline
30 & 422 & 415.6580557778 & 6.34194422220001 \tabularnewline
31 & 428 & 368.246451141885 & 59.7535488581153 \tabularnewline
32 & 426 & 367.193970384590 & 58.8060296154096 \tabularnewline
33 & 396 & 391.088349631166 & 4.91165036883351 \tabularnewline
34 & 458 & 403.609474328707 & 54.390525671293 \tabularnewline
35 & 315 & 355.979511006184 & -40.9795110061842 \tabularnewline
36 & 337 & 358.689483839861 & -21.6894838398611 \tabularnewline
37 & 386 & 361.186610528218 & 24.8133894717825 \tabularnewline
38 & 352 & 348.053186640474 & 3.94681335952606 \tabularnewline
39 & 383 & 417.932304636596 & -34.9323046365959 \tabularnewline
40 & 439 & 391.200361323265 & 47.7996386767354 \tabularnewline
41 & 397 & 410.812631543899 & -13.8126315438993 \tabularnewline
42 & 453 & 451.063614069055 & 1.93638593094517 \tabularnewline
43 & 363 & 403.830839914107 & -40.830839914107 \tabularnewline
44 & 365 & 401.168884828106 & -36.1688848281057 \tabularnewline
45 & 474 & 423.155738944362 & 50.8442610556375 \tabularnewline
46 & 373 & 426.914170074498 & -53.9141700744983 \tabularnewline
47 & 403 & 365.69309019845 & 37.3069098015502 \tabularnewline
48 & 384 & 364.468792450843 & 19.5312075491570 \tabularnewline
49 & 364 & 362.912428237271 & 1.08757176272920 \tabularnewline
50 & 361 & 346.381225211146 & 14.6187747888542 \tabularnewline
51 & 419 & 403.980650180837 & 15.0193498191633 \tabularnewline
52 & 352 & 378.5601303946 & -26.5601303946 \tabularnewline
53 & 363 & 386.071538069771 & -23.0715380697711 \tabularnewline
54 & 410 & 418.453979432359 & -8.45397943235916 \tabularnewline
55 & 361 & 367.10810421516 & -6.10810421516018 \tabularnewline
56 & 383 & 372.910791894951 & 10.0892081050489 \tabularnewline
57 & 342 & 392.036358315729 & -50.0363583157288 \tabularnewline
58 & 369 & 402.590347722627 & -33.5903477226274 \tabularnewline
59 & 361 & 354.781553919137 & 6.21844608086284 \tabularnewline
60 & 317 & 358.862560440231 & -41.8625604402311 \tabularnewline
61 & 386 & 361.300076968265 & 24.6999230317349 \tabularnewline
62 & 318 & 347.570551477297 & -29.5705514772967 \tabularnewline
63 & 407 & 418.701482840191 & -11.7014828401907 \tabularnewline
64 & 393 & 394.234725619114 & -1.23472561911373 \tabularnewline
65 & 404 & 410.329996380722 & -6.32999638072201 \tabularnewline
66 & 498 & 448.196572492978 & 49.8034275070217 \tabularnewline
67 & 438 & 400.963798338031 & 37.0362016619695 \tabularnewline
\hline
\end{tabular}
%Source: https://freestatistics.org/blog/index.php?pk=110877&T=4

[TABLE]
[ROW][C]Multiple Linear Regression - Actuals, Interpolation, and Residuals[/C][/ROW]
[ROW][C]Time or Index[/C][C]Actuals[/C][C]InterpolationForecast[/C][C]ResidualsPrediction Error[/C][/ROW]
[ROW][C]1[/C][C]300[/C][C]328.469263332072[/C][C]-28.469263332072[/C][/ROW]
[ROW][C]2[/C][C]302[/C][C]316.110771528520[/C][C]-14.1107715285204[/C][/ROW]
[ROW][C]3[/C][C]400[/C][C]384.49963551658[/C][C]15.5003644834197[/C][/ROW]
[ROW][C]4[/C][C]392[/C][C]357.350421080992[/C][C]34.6495789190083[/C][/ROW]
[ROW][C]5[/C][C]373[/C][C]369.153760299381[/C][C]3.84623970061865[/C][/ROW]
[ROW][C]6[/C][C]379[/C][C]408.03370913712[/C][C]-29.0337091371199[/C][/ROW]
[ROW][C]7[/C][C]303[/C][C]361.754697547332[/C][C]-58.7546975473317[/C][/ROW]
[ROW][C]8[/C][C]324[/C][C]362.013640317132[/C][C]-38.013640317132[/C][/ROW]
[ROW][C]9[/C][C]353[/C][C]383.881274112744[/C][C]-30.8812741127438[/C][/ROW]
[ROW][C]10[/C][C]392[/C][C]387.937756044492[/C][C]4.06224395550801[/C][/ROW]
[ROW][C]11[/C][C]327[/C][C]336.73118310262[/C][C]-9.73118310262034[/C][/ROW]
[ROW][C]12[/C][C]376[/C][C]340.454528661779[/C][C]35.5454713382206[/C][/ROW]
[ROW][C]13[/C][C]329[/C][C]339.196215249820[/C][C]-10.1962152498196[/C][/ROW]
[ROW][C]14[/C][C]359[/C][C]323.499554468209[/C][C]35.5004455317907[/C][/ROW]
[ROW][C]15[/C][C]413[/C][C]384.794809377894[/C][C]28.205190622106[/C][/ROW]
[ROW][C]16[/C][C]338[/C][C]361.102984241009[/C][C]-23.1029842410093[/C][/ROW]
[ROW][C]17[/C][C]422[/C][C]375.767611154878[/C][C]46.232388845122[/C][/ROW]
[ROW][C]18[/C][C]390[/C][C]410.594069090688[/C][C]-20.5940690906878[/C][/ROW]
[ROW][C]19[/C][C]370[/C][C]361.096108843486[/C][C]8.90389115651424[/C][/ROW]
[ROW][C]20[/C][C]367[/C][C]361.712712575221[/C][C]5.28728742477916[/C][/ROW]
[ROW][C]21[/C][C]406[/C][C]380.838278995999[/C][C]25.1617210040015[/C][/ROW]
[ROW][C]22[/C][C]418[/C][C]388.948251829675[/C][C]29.0517481703246[/C][/ROW]
[ROW][C]23[/C][C]346[/C][C]338.814661773608[/C][C]7.18533822639155[/C][/ROW]
[ROW][C]24[/C][C]350[/C][C]341.524634607285[/C][C]8.47536539271465[/C][/ROW]
[ROW][C]25[/C][C]330[/C][C]341.935405684355[/C][C]-11.9354056843550[/C][/ROW]
[ROW][C]26[/C][C]318[/C][C]328.384710674354[/C][C]-10.384710674354[/C][/ROW]
[ROW][C]27[/C][C]382[/C][C]394.091117447902[/C][C]-12.0911174479023[/C][/ROW]
[ROW][C]28[/C][C]337[/C][C]368.551377341021[/C][C]-31.5513773410207[/C][/ROW]
[ROW][C]29[/C][C]372[/C][C]378.864462551348[/C][C]-6.86446255134831[/C][/ROW]
[ROW][C]30[/C][C]422[/C][C]415.6580557778[/C][C]6.34194422220001[/C][/ROW]
[ROW][C]31[/C][C]428[/C][C]368.246451141885[/C][C]59.7535488581153[/C][/ROW]
[ROW][C]32[/C][C]426[/C][C]367.193970384590[/C][C]58.8060296154096[/C][/ROW]
[ROW][C]33[/C][C]396[/C][C]391.088349631166[/C][C]4.91165036883351[/C][/ROW]
[ROW][C]34[/C][C]458[/C][C]403.609474328707[/C][C]54.390525671293[/C][/ROW]
[ROW][C]35[/C][C]315[/C][C]355.979511006184[/C][C]-40.9795110061842[/C][/ROW]
[ROW][C]36[/C][C]337[/C][C]358.689483839861[/C][C]-21.6894838398611[/C][/ROW]
[ROW][C]37[/C][C]386[/C][C]361.186610528218[/C][C]24.8133894717825[/C][/ROW]
[ROW][C]38[/C][C]352[/C][C]348.053186640474[/C][C]3.94681335952606[/C][/ROW]
[ROW][C]39[/C][C]383[/C][C]417.932304636596[/C][C]-34.9323046365959[/C][/ROW]
[ROW][C]40[/C][C]439[/C][C]391.200361323265[/C][C]47.7996386767354[/C][/ROW]
[ROW][C]41[/C][C]397[/C][C]410.812631543899[/C][C]-13.8126315438993[/C][/ROW]
[ROW][C]42[/C][C]453[/C][C]451.063614069055[/C][C]1.93638593094517[/C][/ROW]
[ROW][C]43[/C][C]363[/C][C]403.830839914107[/C][C]-40.830839914107[/C][/ROW]
[ROW][C]44[/C][C]365[/C][C]401.168884828106[/C][C]-36.1688848281057[/C][/ROW]
[ROW][C]45[/C][C]474[/C][C]423.155738944362[/C][C]50.8442610556375[/C][/ROW]
[ROW][C]46[/C][C]373[/C][C]426.914170074498[/C][C]-53.9141700744983[/C][/ROW]
[ROW][C]47[/C][C]403[/C][C]365.69309019845[/C][C]37.3069098015502[/C][/ROW]
[ROW][C]48[/C][C]384[/C][C]364.468792450843[/C][C]19.5312075491570[/C][/ROW]
[ROW][C]49[/C][C]364[/C][C]362.912428237271[/C][C]1.08757176272920[/C][/ROW]
[ROW][C]50[/C][C]361[/C][C]346.381225211146[/C][C]14.6187747888542[/C][/ROW]
[ROW][C]51[/C][C]419[/C][C]403.980650180837[/C][C]15.0193498191633[/C][/ROW]
[ROW][C]52[/C][C]352[/C][C]378.5601303946[/C][C]-26.5601303946[/C][/ROW]
[ROW][C]53[/C][C]363[/C][C]386.071538069771[/C][C]-23.0715380697711[/C][/ROW]
[ROW][C]54[/C][C]410[/C][C]418.453979432359[/C][C]-8.45397943235916[/C][/ROW]
[ROW][C]55[/C][C]361[/C][C]367.10810421516[/C][C]-6.10810421516018[/C][/ROW]
[ROW][C]56[/C][C]383[/C][C]372.910791894951[/C][C]10.0892081050489[/C][/ROW]
[ROW][C]57[/C][C]342[/C][C]392.036358315729[/C][C]-50.0363583157288[/C][/ROW]
[ROW][C]58[/C][C]369[/C][C]402.590347722627[/C][C]-33.5903477226274[/C][/ROW]
[ROW][C]59[/C][C]361[/C][C]354.781553919137[/C][C]6.21844608086284[/C][/ROW]
[ROW][C]60[/C][C]317[/C][C]358.862560440231[/C][C]-41.8625604402311[/C][/ROW]
[ROW][C]61[/C][C]386[/C][C]361.300076968265[/C][C]24.6999230317349[/C][/ROW]
[ROW][C]62[/C][C]318[/C][C]347.570551477297[/C][C]-29.5705514772967[/C][/ROW]
[ROW][C]63[/C][C]407[/C][C]418.701482840191[/C][C]-11.7014828401907[/C][/ROW]
[ROW][C]64[/C][C]393[/C][C]394.234725619114[/C][C]-1.23472561911373[/C][/ROW]
[ROW][C]65[/C][C]404[/C][C]410.329996380722[/C][C]-6.32999638072201[/C][/ROW]
[ROW][C]66[/C][C]498[/C][C]448.196572492978[/C][C]49.8034275070217[/C][/ROW]
[ROW][C]67[/C][C]438[/C][C]400.963798338031[/C][C]37.0362016619695[/C][/ROW]
[/TABLE]
Source: https://freestatistics.org/blog/index.php?pk=110877&T=4

Globally Unique Identifier (entire table): ba.freestatistics.org/blog/index.php?pk=110877&T=4

As an alternative you can also use a QR Code:  

The GUIDs for individual cells are displayed in the table below:

Multiple Linear Regression - Actuals, Interpolation, and Residuals
Time or IndexActualsInterpolationForecastResidualsPrediction Error
1300328.469263332072-28.469263332072
2302316.110771528520-14.1107715285204
3400384.4996355165815.5003644834197
4392357.35042108099234.6495789190083
5373369.1537602993813.84623970061865
6379408.03370913712-29.0337091371199
7303361.754697547332-58.7546975473317
8324362.013640317132-38.013640317132
9353383.881274112744-30.8812741127438
10392387.9377560444924.06224395550801
11327336.73118310262-9.73118310262034
12376340.45452866177935.5454713382206
13329339.196215249820-10.1962152498196
14359323.49955446820935.5004455317907
15413384.79480937789428.205190622106
16338361.102984241009-23.1029842410093
17422375.76761115487846.232388845122
18390410.594069090688-20.5940690906878
19370361.0961088434868.90389115651424
20367361.7127125752215.28728742477916
21406380.83827899599925.1617210040015
22418388.94825182967529.0517481703246
23346338.8146617736087.18533822639155
24350341.5246346072858.47536539271465
25330341.935405684355-11.9354056843550
26318328.384710674354-10.384710674354
27382394.091117447902-12.0911174479023
28337368.551377341021-31.5513773410207
29372378.864462551348-6.86446255134831
30422415.65805577786.34194422220001
31428368.24645114188559.7535488581153
32426367.19397038459058.8060296154096
33396391.0883496311664.91165036883351
34458403.60947432870754.390525671293
35315355.979511006184-40.9795110061842
36337358.689483839861-21.6894838398611
37386361.18661052821824.8133894717825
38352348.0531866404743.94681335952606
39383417.932304636596-34.9323046365959
40439391.20036132326547.7996386767354
41397410.812631543899-13.8126315438993
42453451.0636140690551.93638593094517
43363403.830839914107-40.830839914107
44365401.168884828106-36.1688848281057
45474423.15573894436250.8442610556375
46373426.914170074498-53.9141700744983
47403365.6930901984537.3069098015502
48384364.46879245084319.5312075491570
49364362.9124282372711.08757176272920
50361346.38122521114614.6187747888542
51419403.98065018083715.0193498191633
52352378.5601303946-26.5601303946
53363386.071538069771-23.0715380697711
54410418.453979432359-8.45397943235916
55361367.10810421516-6.10810421516018
56383372.91079189495110.0892081050489
57342392.036358315729-50.0363583157288
58369402.590347722627-33.5903477226274
59361354.7815539191376.21844608086284
60317358.862560440231-41.8625604402311
61386361.30007696826524.6999230317349
62318347.570551477297-29.5705514772967
63407418.701482840191-11.7014828401907
64393394.234725619114-1.23472561911373
65404410.329996380722-6.32999638072201
66498448.19657249297849.8034275070217
67438400.96379833803137.0362016619695


Goldfeld-Quandt test for Heteroskedasticity
p-valuesAlternative Hypothesis
breakpoint indexgreater2-sidedless
170.569296761685610.861406476628780.43070323831439
180.4120201231005050.824040246201010.587979876899495
190.4953052317722720.9906104635445450.504694768227728
200.3796222515856330.7592445031712660.620377748414367
210.2869289098499750.573857819699950.713071090150025
220.2018843069639930.4037686139279850.798115693036007
230.1310743217121620.2621486434243240.868925678287838
240.1543624862953270.3087249725906530.845637513704673
250.1120836882485530.2241673764971060.887916311751447
260.1019534130888700.2039068261777390.89804658691113
270.0928244498518270.1856488997036540.907175550148173
280.09131152430181650.1826230486036330.908688475698184
290.0775301652396820.1550603304793640.922469834760318
300.06087784683044690.1217556936608940.939122153169553
310.1557002378811960.3114004757623930.844299762118804
320.2366513288104020.4733026576208040.763348671189598
330.1722726727248670.3445453454497340.827727327275133
340.3879805570801440.7759611141602880.612019442919856
350.4000862455499780.8001724910999560.599913754450022
360.3275026995520670.6550053991041340.672497300447933
370.3628319937824290.7256639875648580.637168006217571
380.2887057087445590.5774114174891190.71129429125544
390.2572026110713010.5144052221426020.742797388928699
400.4206964777429330.8413929554858660.579303522257067
410.3301769957287190.6603539914574380.669823004271281
420.2803700603921040.5607401207842070.719629939607896
430.3935586623439920.7871173246879850.606441337656008
440.6472749163547590.7054501672904810.352725083645241
450.7312285912659820.5375428174680350.268771408734018
460.9095324768732220.1809350462535570.0904675231267783
470.8633298803733750.2733402392532510.136670119626625
480.8189204691752050.3621590616495910.181079530824795
490.9392000887933160.1215998224133680.060799911206684
500.8486592924525180.3026814150949630.151340707547482

\begin{tabular}{lllllllll}
\hline
Goldfeld-Quandt test for Heteroskedasticity \tabularnewline
p-values & Alternative Hypothesis \tabularnewline
breakpoint index & greater & 2-sided & less \tabularnewline
17 & 0.56929676168561 & 0.86140647662878 & 0.43070323831439 \tabularnewline
18 & 0.412020123100505 & 0.82404024620101 & 0.587979876899495 \tabularnewline
19 & 0.495305231772272 & 0.990610463544545 & 0.504694768227728 \tabularnewline
20 & 0.379622251585633 & 0.759244503171266 & 0.620377748414367 \tabularnewline
21 & 0.286928909849975 & 0.57385781969995 & 0.713071090150025 \tabularnewline
22 & 0.201884306963993 & 0.403768613927985 & 0.798115693036007 \tabularnewline
23 & 0.131074321712162 & 0.262148643424324 & 0.868925678287838 \tabularnewline
24 & 0.154362486295327 & 0.308724972590653 & 0.845637513704673 \tabularnewline
25 & 0.112083688248553 & 0.224167376497106 & 0.887916311751447 \tabularnewline
26 & 0.101953413088870 & 0.203906826177739 & 0.89804658691113 \tabularnewline
27 & 0.092824449851827 & 0.185648899703654 & 0.907175550148173 \tabularnewline
28 & 0.0913115243018165 & 0.182623048603633 & 0.908688475698184 \tabularnewline
29 & 0.077530165239682 & 0.155060330479364 & 0.922469834760318 \tabularnewline
30 & 0.0608778468304469 & 0.121755693660894 & 0.939122153169553 \tabularnewline
31 & 0.155700237881196 & 0.311400475762393 & 0.844299762118804 \tabularnewline
32 & 0.236651328810402 & 0.473302657620804 & 0.763348671189598 \tabularnewline
33 & 0.172272672724867 & 0.344545345449734 & 0.827727327275133 \tabularnewline
34 & 0.387980557080144 & 0.775961114160288 & 0.612019442919856 \tabularnewline
35 & 0.400086245549978 & 0.800172491099956 & 0.599913754450022 \tabularnewline
36 & 0.327502699552067 & 0.655005399104134 & 0.672497300447933 \tabularnewline
37 & 0.362831993782429 & 0.725663987564858 & 0.637168006217571 \tabularnewline
38 & 0.288705708744559 & 0.577411417489119 & 0.71129429125544 \tabularnewline
39 & 0.257202611071301 & 0.514405222142602 & 0.742797388928699 \tabularnewline
40 & 0.420696477742933 & 0.841392955485866 & 0.579303522257067 \tabularnewline
41 & 0.330176995728719 & 0.660353991457438 & 0.669823004271281 \tabularnewline
42 & 0.280370060392104 & 0.560740120784207 & 0.719629939607896 \tabularnewline
43 & 0.393558662343992 & 0.787117324687985 & 0.606441337656008 \tabularnewline
44 & 0.647274916354759 & 0.705450167290481 & 0.352725083645241 \tabularnewline
45 & 0.731228591265982 & 0.537542817468035 & 0.268771408734018 \tabularnewline
46 & 0.909532476873222 & 0.180935046253557 & 0.0904675231267783 \tabularnewline
47 & 0.863329880373375 & 0.273340239253251 & 0.136670119626625 \tabularnewline
48 & 0.818920469175205 & 0.362159061649591 & 0.181079530824795 \tabularnewline
49 & 0.939200088793316 & 0.121599822413368 & 0.060799911206684 \tabularnewline
50 & 0.848659292452518 & 0.302681415094963 & 0.151340707547482 \tabularnewline
\hline
\end{tabular}
%Source: https://freestatistics.org/blog/index.php?pk=110877&T=5

[TABLE]
[ROW][C]Goldfeld-Quandt test for Heteroskedasticity[/C][/ROW]
[ROW][C]p-values[/C][C]Alternative Hypothesis[/C][/ROW]
[ROW][C]breakpoint index[/C][C]greater[/C][C]2-sided[/C][C]less[/C][/ROW]
[ROW][C]17[/C][C]0.56929676168561[/C][C]0.86140647662878[/C][C]0.43070323831439[/C][/ROW]
[ROW][C]18[/C][C]0.412020123100505[/C][C]0.82404024620101[/C][C]0.587979876899495[/C][/ROW]
[ROW][C]19[/C][C]0.495305231772272[/C][C]0.990610463544545[/C][C]0.504694768227728[/C][/ROW]
[ROW][C]20[/C][C]0.379622251585633[/C][C]0.759244503171266[/C][C]0.620377748414367[/C][/ROW]
[ROW][C]21[/C][C]0.286928909849975[/C][C]0.57385781969995[/C][C]0.713071090150025[/C][/ROW]
[ROW][C]22[/C][C]0.201884306963993[/C][C]0.403768613927985[/C][C]0.798115693036007[/C][/ROW]
[ROW][C]23[/C][C]0.131074321712162[/C][C]0.262148643424324[/C][C]0.868925678287838[/C][/ROW]
[ROW][C]24[/C][C]0.154362486295327[/C][C]0.308724972590653[/C][C]0.845637513704673[/C][/ROW]
[ROW][C]25[/C][C]0.112083688248553[/C][C]0.224167376497106[/C][C]0.887916311751447[/C][/ROW]
[ROW][C]26[/C][C]0.101953413088870[/C][C]0.203906826177739[/C][C]0.89804658691113[/C][/ROW]
[ROW][C]27[/C][C]0.092824449851827[/C][C]0.185648899703654[/C][C]0.907175550148173[/C][/ROW]
[ROW][C]28[/C][C]0.0913115243018165[/C][C]0.182623048603633[/C][C]0.908688475698184[/C][/ROW]
[ROW][C]29[/C][C]0.077530165239682[/C][C]0.155060330479364[/C][C]0.922469834760318[/C][/ROW]
[ROW][C]30[/C][C]0.0608778468304469[/C][C]0.121755693660894[/C][C]0.939122153169553[/C][/ROW]
[ROW][C]31[/C][C]0.155700237881196[/C][C]0.311400475762393[/C][C]0.844299762118804[/C][/ROW]
[ROW][C]32[/C][C]0.236651328810402[/C][C]0.473302657620804[/C][C]0.763348671189598[/C][/ROW]
[ROW][C]33[/C][C]0.172272672724867[/C][C]0.344545345449734[/C][C]0.827727327275133[/C][/ROW]
[ROW][C]34[/C][C]0.387980557080144[/C][C]0.775961114160288[/C][C]0.612019442919856[/C][/ROW]
[ROW][C]35[/C][C]0.400086245549978[/C][C]0.800172491099956[/C][C]0.599913754450022[/C][/ROW]
[ROW][C]36[/C][C]0.327502699552067[/C][C]0.655005399104134[/C][C]0.672497300447933[/C][/ROW]
[ROW][C]37[/C][C]0.362831993782429[/C][C]0.725663987564858[/C][C]0.637168006217571[/C][/ROW]
[ROW][C]38[/C][C]0.288705708744559[/C][C]0.577411417489119[/C][C]0.71129429125544[/C][/ROW]
[ROW][C]39[/C][C]0.257202611071301[/C][C]0.514405222142602[/C][C]0.742797388928699[/C][/ROW]
[ROW][C]40[/C][C]0.420696477742933[/C][C]0.841392955485866[/C][C]0.579303522257067[/C][/ROW]
[ROW][C]41[/C][C]0.330176995728719[/C][C]0.660353991457438[/C][C]0.669823004271281[/C][/ROW]
[ROW][C]42[/C][C]0.280370060392104[/C][C]0.560740120784207[/C][C]0.719629939607896[/C][/ROW]
[ROW][C]43[/C][C]0.393558662343992[/C][C]0.787117324687985[/C][C]0.606441337656008[/C][/ROW]
[ROW][C]44[/C][C]0.647274916354759[/C][C]0.705450167290481[/C][C]0.352725083645241[/C][/ROW]
[ROW][C]45[/C][C]0.731228591265982[/C][C]0.537542817468035[/C][C]0.268771408734018[/C][/ROW]
[ROW][C]46[/C][C]0.909532476873222[/C][C]0.180935046253557[/C][C]0.0904675231267783[/C][/ROW]
[ROW][C]47[/C][C]0.863329880373375[/C][C]0.273340239253251[/C][C]0.136670119626625[/C][/ROW]
[ROW][C]48[/C][C]0.818920469175205[/C][C]0.362159061649591[/C][C]0.181079530824795[/C][/ROW]
[ROW][C]49[/C][C]0.939200088793316[/C][C]0.121599822413368[/C][C]0.060799911206684[/C][/ROW]
[ROW][C]50[/C][C]0.848659292452518[/C][C]0.302681415094963[/C][C]0.151340707547482[/C][/ROW]
[/TABLE]
Source: https://freestatistics.org/blog/index.php?pk=110877&T=5

Globally Unique Identifier (entire table): ba.freestatistics.org/blog/index.php?pk=110877&T=5

As an alternative you can also use a QR Code:  

The GUIDs for individual cells are displayed in the table below:

Goldfeld-Quandt test for Heteroskedasticity
p-valuesAlternative Hypothesis
breakpoint indexgreater2-sidedless
170.569296761685610.861406476628780.43070323831439
180.4120201231005050.824040246201010.587979876899495
190.4953052317722720.9906104635445450.504694768227728
200.3796222515856330.7592445031712660.620377748414367
210.2869289098499750.573857819699950.713071090150025
220.2018843069639930.4037686139279850.798115693036007
230.1310743217121620.2621486434243240.868925678287838
240.1543624862953270.3087249725906530.845637513704673
250.1120836882485530.2241673764971060.887916311751447
260.1019534130888700.2039068261777390.89804658691113
270.0928244498518270.1856488997036540.907175550148173
280.09131152430181650.1826230486036330.908688475698184
290.0775301652396820.1550603304793640.922469834760318
300.06087784683044690.1217556936608940.939122153169553
310.1557002378811960.3114004757623930.844299762118804
320.2366513288104020.4733026576208040.763348671189598
330.1722726727248670.3445453454497340.827727327275133
340.3879805570801440.7759611141602880.612019442919856
350.4000862455499780.8001724910999560.599913754450022
360.3275026995520670.6550053991041340.672497300447933
370.3628319937824290.7256639875648580.637168006217571
380.2887057087445590.5774114174891190.71129429125544
390.2572026110713010.5144052221426020.742797388928699
400.4206964777429330.8413929554858660.579303522257067
410.3301769957287190.6603539914574380.669823004271281
420.2803700603921040.5607401207842070.719629939607896
430.3935586623439920.7871173246879850.606441337656008
440.6472749163547590.7054501672904810.352725083645241
450.7312285912659820.5375428174680350.268771408734018
460.9095324768732220.1809350462535570.0904675231267783
470.8633298803733750.2733402392532510.136670119626625
480.8189204691752050.3621590616495910.181079530824795
490.9392000887933160.1215998224133680.060799911206684
500.8486592924525180.3026814150949630.151340707547482


Meta Analysis of Goldfeld-Quandt test for Heteroskedasticity
Description# significant tests% significant testsOK/NOK
1% type I error level00OK
5% type I error level00OK
10% type I error level00OK

\begin{tabular}{lllllllll}
\hline
Meta Analysis of Goldfeld-Quandt test for Heteroskedasticity \tabularnewline
Description & # significant tests & % significant tests & OK/NOK \tabularnewline
1% type I error level & 0 & 0 & OK \tabularnewline
5% type I error level & 0 & 0 & OK \tabularnewline
10% type I error level & 0 & 0 & OK \tabularnewline
\hline
\end{tabular}
%Source: https://freestatistics.org/blog/index.php?pk=110877&T=6

[TABLE]
[ROW][C]Meta Analysis of Goldfeld-Quandt test for Heteroskedasticity[/C][/ROW]
[ROW][C]Description[/C][C]# significant tests[/C][C]% significant tests[/C][C]OK/NOK[/C][/ROW]
[ROW][C]1% type I error level[/C][C]0[/C][C]0[/C][C]OK[/C][/ROW]
[ROW][C]5% type I error level[/C][C]0[/C][C]0[/C][C]OK[/C][/ROW]
[ROW][C]10% type I error level[/C][C]0[/C][C]0[/C][C]OK[/C][/ROW]
[/TABLE]
Source: https://freestatistics.org/blog/index.php?pk=110877&T=6

Globally Unique Identifier (entire table): ba.freestatistics.org/blog/index.php?pk=110877&T=6

As an alternative you can also use a QR Code:  

The GUIDs for individual cells are displayed in the table below:

Meta Analysis of Goldfeld-Quandt test for Heteroskedasticity
Description# significant tests% significant testsOK/NOK
1% type I error level00OK
5% type I error level00OK
10% type I error level00OK


Parameters (Session):
par1 = 1 ; par2 = Include Monthly Dummies ; par3 = Linear Trend ;
Parameters (R input):
par1 = 1 ; par2 = Include Monthly Dummies ; par3 = Linear Trend ;
R code (references can be found in the software module):
library(lattice)
library(lmtest)
n25 <- 25 #minimum number of obs. for Goldfeld-Quandt test
par1 <- as.numeric(par1)
x <- t(y)
k <- length(x[1,])
n <- length(x[,1])
x1 <- cbind(x[,par1], x[,1:k!=par1])
mycolnames <- c(colnames(x)[par1], colnames(x)[1:k!=par1])
colnames(x1) <- mycolnames #colnames(x)[par1]
x <- x1
if (par3 == 'First Differences'){
x2 <- array(0, dim=c(n-1,k), dimnames=list(1:(n-1), paste('(1-B)',colnames(x),sep='')))
for (i in 1:n-1) {
for (j in 1:k) {
x2[i,j] <- x[i+1,j] - x[i,j]
}
}
x <- x2
}
if (par2 == 'Include Monthly Dummies'){
x2 <- array(0, dim=c(n,11), dimnames=list(1:n, paste('M', seq(1:11), sep ='')))
for (i in 1:11){
x2[seq(i,n,12),i] <- 1
}
x <- cbind(x, x2)
}
if (par2 == 'Include Quarterly Dummies'){
x2 <- array(0, dim=c(n,3), dimnames=list(1:n, paste('Q', seq(1:3), sep ='')))
for (i in 1:3){
x2[seq(i,n,4),i] <- 1
}
x <- cbind(x, x2)
}
k <- length(x[1,])
if (par3 == 'Linear Trend'){
x <- cbind(x, c(1:n))
colnames(x)[k+1] <- 't'
}
x
k <- length(x[1,])
df <- as.data.frame(x)
(mylm <- lm(df))
(mysum <- summary(mylm))
if (n > n25) {
kp3 <- k + 3
nmkm3 <- n - k - 3
gqarr <- array(NA, dim=c(nmkm3-kp3+1,3))
numgqtests <- 0
numsignificant1 <- 0
numsignificant5 <- 0
numsignificant10 <- 0
for (mypoint in kp3:nmkm3) {
j <- 0
numgqtests <- numgqtests + 1
for (myalt in c('greater', 'two.sided', 'less')) {
j <- j + 1
gqarr[mypoint-kp3+1,j] <- gqtest(mylm, point=mypoint, alternative=myalt)$p.value
}
if (gqarr[mypoint-kp3+1,2] < 0.01) numsignificant1 <- numsignificant1 + 1
if (gqarr[mypoint-kp3+1,2] < 0.05) numsignificant5 <- numsignificant5 + 1
if (gqarr[mypoint-kp3+1,2] < 0.10) numsignificant10 <- numsignificant10 + 1
}
gqarr
}
bitmap(file='test0.png')
plot(x[,1], type='l', main='Actuals and Interpolation', ylab='value of Actuals and Interpolation (dots)', xlab='time or index')
points(x[,1]-mysum$resid)
grid()
dev.off()
bitmap(file='test1.png')
plot(mysum$resid, type='b', pch=19, main='Residuals', ylab='value of Residuals', xlab='time or index')
grid()
dev.off()
bitmap(file='test2.png')
hist(mysum$resid, main='Residual Histogram', xlab='values of Residuals')
grid()
dev.off()
bitmap(file='test3.png')
densityplot(~mysum$resid,col='black',main='Residual Density Plot', xlab='values of Residuals')
dev.off()
bitmap(file='test4.png')
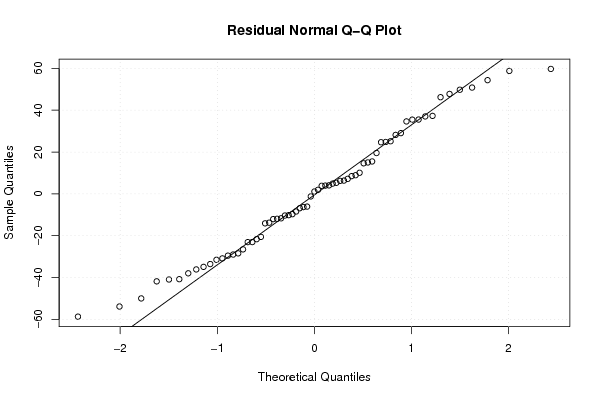
qqnorm(mysum$resid, main='Residual Normal Q-Q Plot')
qqline(mysum$resid)
grid()
dev.off()
(myerror <- as.ts(mysum$resid))
bitmap(file='test5.png')
dum <- cbind(lag(myerror,k=1),myerror)
dum
dum1 <- dum[2:length(myerror),]
dum1
z <- as.data.frame(dum1)
z
plot(z,main=paste('Residual Lag plot, lowess, and regression line'), ylab='values of Residuals', xlab='lagged values of Residuals')
lines(lowess(z))
abline(lm(z))
grid()
dev.off()
bitmap(file='test6.png')
acf(mysum$resid, lag.max=length(mysum$resid)/2, main='Residual Autocorrelation Function')
grid()
dev.off()
bitmap(file='test7.png')
pacf(mysum$resid, lag.max=length(mysum$resid)/2, main='Residual Partial Autocorrelation Function')
grid()
dev.off()
bitmap(file='test8.png')
opar <- par(mfrow = c(2,2), oma = c(0, 0, 1.1, 0))
plot(mylm, las = 1, sub='Residual Diagnostics')
par(opar)
dev.off()
if (n > n25) {
bitmap(file='test9.png')
plot(kp3:nmkm3,gqarr[,2], main='Goldfeld-Quandt test',ylab='2-sided p-value',xlab='breakpoint')
grid()
dev.off()
}
load(file='createtable')
a<-table.start()
a<-table.row.start(a)
a<-table.element(a, 'Multiple Linear Regression - Estimated Regression Equation', 1, TRUE)
a<-table.row.end(a)
myeq <- colnames(x)[1]
myeq <- paste(myeq, '[t] = ', sep='')
for (i in 1:k){
if (mysum$coefficients[i,1] > 0) myeq <- paste(myeq, '+', '')
myeq <- paste(myeq, mysum$coefficients[i,1], sep=' ')
if (rownames(mysum$coefficients)[i] != '(Intercept)') {
myeq <- paste(myeq, rownames(mysum$coefficients)[i], sep='')
if (rownames(mysum$coefficients)[i] != 't') myeq <- paste(myeq, '[t]', sep='')
}
}
myeq <- paste(myeq, ' + e[t]')
a<-table.row.start(a)
a<-table.element(a, myeq)
a<-table.row.end(a)
a<-table.end(a)
table.save(a,file='mytable1.tab')
a<-table.start()
a<-table.row.start(a)
a<-table.element(a,hyperlink('ols1.htm','Multiple Linear Regression - Ordinary Least Squares',''), 6, TRUE)
a<-table.row.end(a)
a<-table.row.start(a)
a<-table.element(a,'Variable',header=TRUE)
a<-table.element(a,'Parameter',header=TRUE)
a<-table.element(a,'S.D.',header=TRUE)
a<-table.element(a,'T-STAT
H0: parameter = 0',header=TRUE)
a<-table.element(a,'2-tail p-value',header=TRUE)
a<-table.element(a,'1-tail p-value',header=TRUE)
a<-table.row.end(a)
for (i in 1:k){
a<-table.row.start(a)
a<-table.element(a,rownames(mysum$coefficients)[i],header=TRUE)
a<-table.element(a,mysum$coefficients[i,1])
a<-table.element(a, round(mysum$coefficients[i,2],6))
a<-table.element(a, round(mysum$coefficients[i,3],4))
a<-table.element(a, round(mysum$coefficients[i,4],6))
a<-table.element(a, round(mysum$coefficients[i,4]/2,6))
a<-table.row.end(a)
}
a<-table.end(a)
table.save(a,file='mytable2.tab')
a<-table.start()
a<-table.row.start(a)
a<-table.element(a, 'Multiple Linear Regression - Regression Statistics', 2, TRUE)
a<-table.row.end(a)
a<-table.row.start(a)
a<-table.element(a, 'Multiple R',1,TRUE)
a<-table.element(a, sqrt(mysum$r.squared))
a<-table.row.end(a)
a<-table.row.start(a)
a<-table.element(a, 'R-squared',1,TRUE)
a<-table.element(a, mysum$r.squared)
a<-table.row.end(a)
a<-table.row.start(a)
a<-table.element(a, 'Adjusted R-squared',1,TRUE)
a<-table.element(a, mysum$adj.r.squared)
a<-table.row.end(a)
a<-table.row.start(a)
a<-table.element(a, 'F-TEST (value)',1,TRUE)
a<-table.element(a, mysum$fstatistic[1])
a<-table.row.end(a)
a<-table.row.start(a)
a<-table.element(a, 'F-TEST (DF numerator)',1,TRUE)
a<-table.element(a, mysum$fstatistic[2])
a<-table.row.end(a)
a<-table.row.start(a)
a<-table.element(a, 'F-TEST (DF denominator)',1,TRUE)
a<-table.element(a, mysum$fstatistic[3])
a<-table.row.end(a)
a<-table.row.start(a)
a<-table.element(a, 'p-value',1,TRUE)
a<-table.element(a, 1-pf(mysum$fstatistic[1],mysum$fstatistic[2],mysum$fstatistic[3]))
a<-table.row.end(a)
a<-table.row.start(a)
a<-table.element(a, 'Multiple Linear Regression - Residual Statistics', 2, TRUE)
a<-table.row.end(a)
a<-table.row.start(a)
a<-table.element(a, 'Residual Standard Deviation',1,TRUE)
a<-table.element(a, mysum$sigma)
a<-table.row.end(a)
a<-table.row.start(a)
a<-table.element(a, 'Sum Squared Residuals',1,TRUE)
a<-table.element(a, sum(myerror*myerror))
a<-table.row.end(a)
a<-table.end(a)
table.save(a,file='mytable3.tab')
a<-table.start()
a<-table.row.start(a)
a<-table.element(a, 'Multiple Linear Regression - Actuals, Interpolation, and Residuals', 4, TRUE)
a<-table.row.end(a)
a<-table.row.start(a)
a<-table.element(a, 'Time or Index', 1, TRUE)
a<-table.element(a, 'Actuals', 1, TRUE)
a<-table.element(a, 'Interpolation
Forecast', 1, TRUE)
a<-table.element(a, 'Residuals
Prediction Error', 1, TRUE)
a<-table.row.end(a)
for (i in 1:n) {
a<-table.row.start(a)
a<-table.element(a,i, 1, TRUE)
a<-table.element(a,x[i])
a<-table.element(a,x[i]-mysum$resid[i])
a<-table.element(a,mysum$resid[i])
a<-table.row.end(a)
}
a<-table.end(a)
table.save(a,file='mytable4.tab')
if (n > n25) {
a<-table.start()
a<-table.row.start(a)
a<-table.element(a,'Goldfeld-Quandt test for Heteroskedasticity',4,TRUE)
a<-table.row.end(a)
a<-table.row.start(a)
a<-table.element(a,'p-values',header=TRUE)
a<-table.element(a,'Alternative Hypothesis',3,header=TRUE)
a<-table.row.end(a)
a<-table.row.start(a)
a<-table.element(a,'breakpoint index',header=TRUE)
a<-table.element(a,'greater',header=TRUE)
a<-table.element(a,'2-sided',header=TRUE)
a<-table.element(a,'less',header=TRUE)
a<-table.row.end(a)
for (mypoint in kp3:nmkm3) {
a<-table.row.start(a)
a<-table.element(a,mypoint,header=TRUE)
a<-table.element(a,gqarr[mypoint-kp3+1,1])
a<-table.element(a,gqarr[mypoint-kp3+1,2])
a<-table.element(a,gqarr[mypoint-kp3+1,3])
a<-table.row.end(a)
}
a<-table.end(a)
table.save(a,file='mytable5.tab')
a<-table.start()
a<-table.row.start(a)
a<-table.element(a,'Meta Analysis of Goldfeld-Quandt test for Heteroskedasticity',4,TRUE)
a<-table.row.end(a)
a<-table.row.start(a)
a<-table.element(a,'Description',header=TRUE)
a<-table.element(a,'# significant tests',header=TRUE)
a<-table.element(a,'% significant tests',header=TRUE)
a<-table.element(a,'OK/NOK',header=TRUE)
a<-table.row.end(a)
a<-table.row.start(a)
a<-table.element(a,'1% type I error level',header=TRUE)
a<-table.element(a,numsignificant1)
a<-table.element(a,numsignificant1/numgqtests)
if (numsignificant1/numgqtests < 0.01) dum <- 'OK' else dum <- 'NOK'
a<-table.element(a,dum)
a<-table.row.end(a)
a<-table.row.start(a)
a<-table.element(a,'5% type I error level',header=TRUE)
a<-table.element(a,numsignificant5)
a<-table.element(a,numsignificant5/numgqtests)
if (numsignificant5/numgqtests < 0.05) dum <- 'OK' else dum <- 'NOK'
a<-table.element(a,dum)
a<-table.row.end(a)
a<-table.row.start(a)
a<-table.element(a,'10% type I error level',header=TRUE)
a<-table.element(a,numsignificant10)
a<-table.element(a,numsignificant10/numgqtests)
if (numsignificant10/numgqtests < 0.1) dum <- 'OK' else dum <- 'NOK'
a<-table.element(a,dum)
a<-table.row.end(a)
a<-table.end(a)
table.save(a,file='mytable6.tab')
}