| Multiple Linear Regression - Estimated Regression Equation |
| Aantal_vergunningen[t] = + 338.502189030203 + 6.15102312474545Inflatie[t] + 0.751624934630228t + e[t] |
| Multiple Linear Regression - Ordinary Least Squares | |||||
| Variable | Parameter | S.D. | T-STAT H0: parameter = 0 | 2-tail p-value | 1-tail p-value |
| (Intercept) | 338.502189030203 | 13.288454 | 25.4734 | 0 | 0 |
| Inflatie | 6.15102312474545 | 3.134231 | 1.9625 | 0.054051 | 0.027026 |
| t | 0.751624934630228 | 0.260247 | 2.8881 | 0.005282 | 0.002641 |
| Multiple Linear Regression - Regression Statistics | |
| Multiple R | 0.366656095248077 |
| R-squared | 0.134436692182567 |
| Adjusted R-squared | 0.107387838813272 |
| F-TEST (value) | 4.97014384850695 |
| F-TEST (DF numerator) | 2 |
| F-TEST (DF denominator) | 64 |
| p-value | 0.00985287138616242 |
| Multiple Linear Regression - Residual Statistics | |
| Residual Standard Deviation | 39.8202844818466 |
| Sum Squared Residuals | 101481.923597772 |
| Multiple Linear Regression - Actuals, Interpolation, and Residuals | |||
| Time or Index | Actuals | Interpolation Forecast | Residuals Prediction Error |
| 1 | 300 | 353.155126226758 | -53.155126226758 |
| 2 | 302 | 355.813568330059 | -53.8135683300592 |
| 3 | 400 | 359.640704827062 | 40.3592951729379 |
| 4 | 392 | 358.485512593021 | 33.5144874069787 |
| 5 | 373 | 357.699381746465 | 15.3006182535348 |
| 6 | 379 | 360.665375006004 | 18.3346249939962 |
| 7 | 303 | 363.077776184315 | -60.0777761843153 |
| 8 | 324 | 363.644870425203 | -39.6448704252031 |
| 9 | 353 | 364.704046516071 | -11.7040465160706 |
| 10 | 392 | 361.211465494627 | 30.7885345053735 |
| 11 | 327 | 362.578192741731 | -35.5781927417313 |
| 12 | 376 | 365.29814507628 | 10.7018549237199 |
| 13 | 329 | 364.450503998476 | -35.4505039984765 |
| 14 | 359 | 363.66437315192 | -4.66437315192033 |
| 15 | 413 | 360.171792130476 | 52.8282078695238 |
| 16 | 338 | 362.584193308788 | -24.5841933087877 |
| 17 | 422 | 364.750553562109 | 57.2494464378906 |
| 18 | 390 | 363.533851096821 | 26.4661489031789 |
| 19 | 370 | 362.62469978777 | 7.37530021222998 |
| 20 | 367 | 363.560855416143 | 3.43914458385739 |
| 21 | 406 | 361.790560869627 | 44.2094391303728 |
| 22 | 418 | 362.48067557301 | 55.51932442699 |
| 23 | 346 | 364.954586982569 | -18.9545869825689 |
| 24 | 350 | 366.628865385911 | -16.628865385911 |
| 25 | 330 | 367.503510783036 | -37.5035107830361 |
| 26 | 318 | 368.931748261388 | -50.9317482613883 |
| 27 | 382 | 369.990924352256 | 12.0090756477442 |
| 28 | 337 | 370.496508361896 | -33.4965083618963 |
| 29 | 372 | 368.172621734154 | 3.82737826584624 |
| 30 | 422 | 368.985756900031 | 53.0142430999686 |
| 31 | 428 | 370.229463684641 | 57.7705363153587 |
| 32 | 426 | 369.443332838085 | 56.5566671619148 |
| 33 | 396 | 372.593856791366 | 23.4061432086339 |
| 34 | 458 | 377.835728607061 | 80.1642713929395 |
| 35 | 315 | 382.893069729013 | -67.8930697290126 |
| 36 | 337 | 384.567348132355 | -47.5673481323546 |
| 37 | 386 | 387.594851623141 | -1.59485162314066 |
| 38 | 352 | 389.453660720225 | -37.4536607202251 |
| 39 | 383 | 394.818552998414 | -11.8185529984144 |
| 40 | 439 | 394.093932383106 | 44.9060676168943 |
| 41 | 397 | 401.365641829966 | -4.3656418299661 |
| 42 | 453 | 405.746370408196 | 47.2536295918038 |
| 43 | 363 | 407.174607886548 | -44.1746078865484 |
| 44 | 365 | 404.727700796311 | -39.727700796311 |
| 45 | 474 | 405.909897349673 | 68.0901026503266 |
| 46 | 373 | 402.109765171992 | -29.1097651719920 |
| 47 | 403 | 393.142773569524 | 9.8572264304756 |
| 48 | 384 | 390.757376710534 | -6.75737671053445 |
| 49 | 364 | 389.602184476494 | -25.6021844764936 |
| 50 | 361 | 387.954910392473 | -26.9549103924731 |
| 51 | 419 | 380.648695033687 | 38.3513049663132 |
| 52 | 352 | 381.277299505822 | -29.2772995058221 |
| 53 | 363 | 376.062432009449 | -13.0624320094492 |
| 54 | 410 | 372.323810063015 | 37.6761899369847 |
| 55 | 361 | 369.507841585293 | -8.50784158529316 |
| 56 | 383 | 375.795387332194 | 7.20461266780571 |
| 57 | 342 | 374.025092785679 | -32.0250927856789 |
| 58 | 369 | 377.237126970207 | -8.23712697020729 |
| 59 | 361 | 382.109937398417 | -21.1099373984170 |
| 60 | 317 | 385.198951120450 | -68.1989511204505 |
| 61 | 386 | 388.164944379989 | -2.16494437998906 |
| 62 | 318 | 389.408651164599 | -71.408651164599 |
| 63 | 407 | 396.065258298985 | 10.9347417010152 |
| 64 | 393 | 397.678026471079 | -4.67802647107937 |
| 65 | 404 | 401.32063227434 | 2.67936772566004 |
| 66 | 498 | 403.240951602672 | 94.7590483973282 |
| 67 | 438 | 404.669189081024 | 33.3308109189759 |
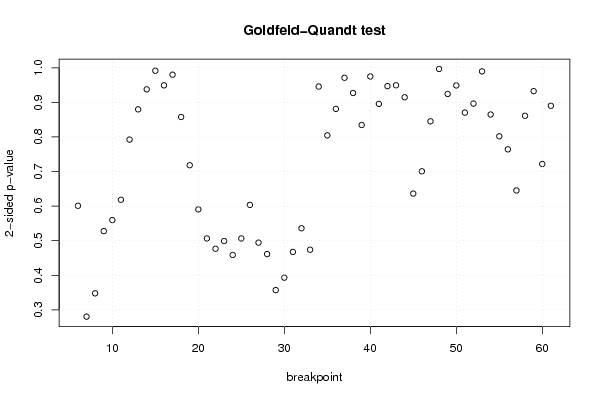
| Goldfeld-Quandt test for Heteroskedasticity | |||
| p-values | Alternative Hypothesis | ||
| breakpoint index | greater | 2-sided | less |
| 6 | 0.300427653743024 | 0.600855307486048 | 0.699572346256976 |
| 7 | 0.859854187717954 | 0.280291624564091 | 0.140145812282046 |
| 8 | 0.826132947420526 | 0.347734105158948 | 0.173867052579474 |
| 9 | 0.736228578234521 | 0.527542843530957 | 0.263771421765479 |
| 10 | 0.72023953029762 | 0.55952093940476 | 0.27976046970238 |
| 11 | 0.69084130312194 | 0.618317393756121 | 0.309158696878060 |
| 12 | 0.603819834306121 | 0.792360331387757 | 0.396180165693879 |
| 13 | 0.560138959153348 | 0.879722081693305 | 0.439861040846652 |
| 14 | 0.468824369202945 | 0.93764873840589 | 0.531175630797055 |
| 15 | 0.495675650318579 | 0.991351300637158 | 0.504324349681421 |
| 16 | 0.474560208365351 | 0.949120416730701 | 0.525439791634649 |
| 17 | 0.510020685549657 | 0.979958628900686 | 0.489979314450343 |
| 18 | 0.428784097787214 | 0.857568195574427 | 0.571215902212787 |
| 19 | 0.359085867512263 | 0.718171735024527 | 0.640914132487737 |
| 20 | 0.295202606246489 | 0.590405212492978 | 0.704797393753511 |
| 21 | 0.253238285144063 | 0.506476570288125 | 0.746761714855937 |
| 22 | 0.238274289300167 | 0.476548578600334 | 0.761725710699833 |
| 23 | 0.249457415695054 | 0.498914831390109 | 0.750542584304946 |
| 24 | 0.229311956567885 | 0.458623913135769 | 0.770688043432115 |
| 25 | 0.253216726113232 | 0.506433452226464 | 0.746783273886768 |
| 26 | 0.301705070950144 | 0.603410141900288 | 0.698294929049856 |
| 27 | 0.247108381524761 | 0.494216763049521 | 0.752891618475239 |
| 28 | 0.230607828145026 | 0.461215656290053 | 0.769392171854974 |
| 29 | 0.178529208328411 | 0.357058416656821 | 0.82147079167159 |
| 30 | 0.196519813104496 | 0.393039626208992 | 0.803480186895504 |
| 31 | 0.233741123380697 | 0.467482246761394 | 0.766258876619303 |
| 32 | 0.26791525616635 | 0.5358305123327 | 0.73208474383365 |
| 33 | 0.236950648236322 | 0.473901296472645 | 0.763049351763678 |
| 34 | 0.527178223032152 | 0.945643553935696 | 0.472821776967848 |
| 35 | 0.597754893805356 | 0.804490212389289 | 0.402245106194644 |
| 36 | 0.559460683330826 | 0.881078633338347 | 0.440539316669174 |
| 37 | 0.514499999918256 | 0.971000000163487 | 0.485500000081744 |
| 38 | 0.463468501422112 | 0.926937002844225 | 0.536531498577888 |
| 39 | 0.417229092465513 | 0.834458184931026 | 0.582770907534487 |
| 40 | 0.512569544413063 | 0.974860911173874 | 0.487430455586937 |
| 41 | 0.447762148209333 | 0.895524296418666 | 0.552237851790667 |
| 42 | 0.526537604643055 | 0.94692479071389 | 0.473462395356945 |
| 43 | 0.525363376466985 | 0.94927324706603 | 0.474636623533015 |
| 44 | 0.54270932610122 | 0.91458134779756 | 0.45729067389878 |
| 45 | 0.681903342366884 | 0.636193315266231 | 0.318096657633116 |
| 46 | 0.649690845051787 | 0.700618309896426 | 0.350309154948213 |
| 47 | 0.577432093303912 | 0.845135813392176 | 0.422567906696088 |
| 48 | 0.501728107437651 | 0.996543785124699 | 0.498271892562349 |
| 49 | 0.462157117932725 | 0.92431423586545 | 0.537842882067275 |
| 50 | 0.474452379818873 | 0.948904759637745 | 0.525547620181127 |
| 51 | 0.435162867220968 | 0.870325734441936 | 0.564837132779032 |
| 52 | 0.448154145181914 | 0.896308290363827 | 0.551845854818086 |
| 53 | 0.494790968969826 | 0.989581937939652 | 0.505209031030174 |
| 54 | 0.432386309240667 | 0.864772618481335 | 0.567613690759333 |
| 55 | 0.400897687895646 | 0.801795375791292 | 0.599102312104354 |
| 56 | 0.382041312591603 | 0.764082625183206 | 0.617958687408397 |
| 57 | 0.322588803451636 | 0.645177606903271 | 0.677411196548364 |
| 58 | 0.430563627320011 | 0.861127254640022 | 0.569436372679989 |
| 59 | 0.466175504048228 | 0.932351008096455 | 0.533824495951772 |
| 60 | 0.360846989487349 | 0.721693978974699 | 0.63915301051265 |
| 61 | 0.445027973604833 | 0.890055947209665 | 0.554972026395167 |
| Meta Analysis of Goldfeld-Quandt test for Heteroskedasticity | |||
| Description | # significant tests | % significant tests | OK/NOK |
| 1% type I error level | 0 | 0 | OK |
| 5% type I error level | 0 | 0 | OK |
| 10% type I error level | 0 | 0 | OK |