Free Statistics

of Irreproducible Research!

Author's title

Author*The author of this computation has been verified*
R Software Modulerwasp_arimabackwardselection.wasp
Title produced by softwareARIMA Backward Selection
Date of computationThu, 16 Dec 2010 12:31:30 +0000
Cite this page as followsStatistical Computations at FreeStatistics.org, Office for Research Development and Education, URL https://freestatistics.org/blog/index.php?v=date/2010/Dec/16/t1292502961v8iaxsr3apzweyq.htm/, Retrieved Fri, 03 May 2024 05:20:36 +0000
Statistical Computations at FreeStatistics.org, Office for Research Development and Education, URL https://freestatistics.org/blog/index.php?pk=110872, Retrieved Fri, 03 May 2024 05:20:36 +0000
QR Codes:

Original text written by user:
IsPrivate?No (this computation is public)
User-defined keywords
Estimated Impact177
Family? (F = Feedback message, R = changed R code, M = changed R Module, P = changed Parameters, D = changed Data)
-     [Univariate Data Series] [data set] [2008-12-01 19:54:57] [b98453cac15ba1066b407e146608df68]
- RMP   [Standard Deviation-Mean Plot] [Unemployment] [2010-11-29 10:34:47] [b98453cac15ba1066b407e146608df68]
- RMP     [ARIMA Backward Selection] [Unemployment] [2010-11-29 17:10:28] [b98453cac15ba1066b407e146608df68]
- R PD      [ARIMA Backward Selection] [ARIMA (huwelijken)] [2010-12-03 13:34:17] [8b017ffbf7b0eded54d8efebfb3e4cfa]
-    D        [ARIMA Backward Selection] [ARIMA (geboortes)] [2010-12-03 13:42:04] [8b017ffbf7b0eded54d8efebfb3e4cfa]
-   P             [ARIMA Backward Selection] [Paper - Stationar...] [2010-12-16 12:31:30] [3de277db83c2673156e9464be2ef6f69] [Current]
Feedback Forum

Post a new message
Dataseries X:
9769
9321
9939
9336
10195
9464
10010
10213
9563
9890
9305
9391
9928
8686
9843
9627
10074
9503
10119
10000
9313
9866
9172
9241
9659
8904
9755
9080
9435
8971
10063
9793
9454
9759
8820
9403
9676
8642
9402
9610
9294
9448
10319
9548
9801
9596
8923
9746
9829
9125
9782
9441
9162
9915
10444
10209
9985
9842
9429
10132
9849
9172
10313
9819
9955
10048
10082
10541
10208
10233
9439
9963
10158
9225
10474
9757
10490
10281
10444
10640
10695
10786
9832
9747
10411
9511
10402
9701
10540
10112
10915
11183
10384
10834
9886
10216


Summary of computational transaction
Raw Inputview raw input (R code)
Raw Outputview raw output of R engine
Computing time15 seconds
R Server'Gwilym Jenkins' @ 72.249.127.135

\begin{tabular}{lllllllll}
\hline
Summary of computational transaction \tabularnewline
Raw Input & view raw input (R code)  \tabularnewline
Raw Output & view raw output of R engine  \tabularnewline
Computing time & 15 seconds \tabularnewline
R Server & 'Gwilym Jenkins' @ 72.249.127.135 \tabularnewline
\hline
\end{tabular}
%Source: https://freestatistics.org/blog/index.php?pk=110872&T=0

[TABLE]
[ROW][C]Summary of computational transaction[/C][/ROW]
[ROW][C]Raw Input[/C][C]view raw input (R code) [/C][/ROW]
[ROW][C]Raw Output[/C][C]view raw output of R engine [/C][/ROW]
[ROW][C]Computing time[/C][C]15 seconds[/C][/ROW]
[ROW][C]R Server[/C][C]'Gwilym Jenkins' @ 72.249.127.135[/C][/ROW]
[/TABLE]
Source: https://freestatistics.org/blog/index.php?pk=110872&T=0

Globally Unique Identifier (entire table): ba.freestatistics.org/blog/index.php?pk=110872&T=0

As an alternative you can also use a QR Code:  

The GUIDs for individual cells are displayed in the table below:

Summary of computational transaction
Raw Inputview raw input (R code)
Raw Outputview raw output of R engine
Computing time15 seconds
R Server'Gwilym Jenkins' @ 72.249.127.135


ARIMA Parameter Estimation and Backward Selection
Iterationar1ar2ar3ma1sar1sar2
Estimates ( 1 )0.79860.00160.1687-0.7601-0.2784-0.1051
(p-val)(0 )(0.992 )(0.1699 )(0 )(0.0326 )(0.3932 )
Estimates ( 2 )0.799500.1693-0.7602-0.278-0.1051
(p-val)(0 )(NA )(0.1119 )(0 )(0.021 )(0.393 )
Estimates ( 3 )0.793800.1711-0.7591-0.25640
(p-val)(0 )(NA )(0.1045 )(0 )(0.0267 )(NA )
Estimates ( 4 )0.976400-0.842-0.21970
(p-val)(0 )(NA )(NA )(0 )(0.0564 )(NA )
Estimates ( 5 )0.96900-0.852100
(p-val)(0 )(NA )(NA )(0 )(NA )(NA )
Estimates ( 6 )NANANANANANA
(p-val)(NA )(NA )(NA )(NA )(NA )(NA )
Estimates ( 7 )NANANANANANA
(p-val)(NA )(NA )(NA )(NA )(NA )(NA )
Estimates ( 8 )NANANANANANA
(p-val)(NA )(NA )(NA )(NA )(NA )(NA )
Estimates ( 9 )NANANANANANA
(p-val)(NA )(NA )(NA )(NA )(NA )(NA )
Estimates ( 10 )NANANANANANA
(p-val)(NA )(NA )(NA )(NA )(NA )(NA )
Estimates ( 11 )NANANANANANA
(p-val)(NA )(NA )(NA )(NA )(NA )(NA )

\begin{tabular}{lllllllll}
\hline
ARIMA Parameter Estimation and Backward Selection \tabularnewline
Iteration & ar1 & ar2 & ar3 & ma1 & sar1 & sar2 \tabularnewline
Estimates ( 1 ) & 0.7986 & 0.0016 & 0.1687 & -0.7601 & -0.2784 & -0.1051 \tabularnewline
(p-val) & (0 ) & (0.992 ) & (0.1699 ) & (0 ) & (0.0326 ) & (0.3932 ) \tabularnewline
Estimates ( 2 ) & 0.7995 & 0 & 0.1693 & -0.7602 & -0.278 & -0.1051 \tabularnewline
(p-val) & (0 ) & (NA ) & (0.1119 ) & (0 ) & (0.021 ) & (0.393 ) \tabularnewline
Estimates ( 3 ) & 0.7938 & 0 & 0.1711 & -0.7591 & -0.2564 & 0 \tabularnewline
(p-val) & (0 ) & (NA ) & (0.1045 ) & (0 ) & (0.0267 ) & (NA ) \tabularnewline
Estimates ( 4 ) & 0.9764 & 0 & 0 & -0.842 & -0.2197 & 0 \tabularnewline
(p-val) & (0 ) & (NA ) & (NA ) & (0 ) & (0.0564 ) & (NA ) \tabularnewline
Estimates ( 5 ) & 0.969 & 0 & 0 & -0.8521 & 0 & 0 \tabularnewline
(p-val) & (0 ) & (NA ) & (NA ) & (0 ) & (NA ) & (NA ) \tabularnewline
Estimates ( 6 ) & NA & NA & NA & NA & NA & NA \tabularnewline
(p-val) & (NA ) & (NA ) & (NA ) & (NA ) & (NA ) & (NA ) \tabularnewline
Estimates ( 7 ) & NA & NA & NA & NA & NA & NA \tabularnewline
(p-val) & (NA ) & (NA ) & (NA ) & (NA ) & (NA ) & (NA ) \tabularnewline
Estimates ( 8 ) & NA & NA & NA & NA & NA & NA \tabularnewline
(p-val) & (NA ) & (NA ) & (NA ) & (NA ) & (NA ) & (NA ) \tabularnewline
Estimates ( 9 ) & NA & NA & NA & NA & NA & NA \tabularnewline
(p-val) & (NA ) & (NA ) & (NA ) & (NA ) & (NA ) & (NA ) \tabularnewline
Estimates ( 10 ) & NA & NA & NA & NA & NA & NA \tabularnewline
(p-val) & (NA ) & (NA ) & (NA ) & (NA ) & (NA ) & (NA ) \tabularnewline
Estimates ( 11 ) & NA & NA & NA & NA & NA & NA \tabularnewline
(p-val) & (NA ) & (NA ) & (NA ) & (NA ) & (NA ) & (NA ) \tabularnewline
\hline
\end{tabular}
%Source: https://freestatistics.org/blog/index.php?pk=110872&T=1

[TABLE]
[ROW][C]ARIMA Parameter Estimation and Backward Selection[/C][/ROW]
[ROW][C]Iteration[/C][C]ar1[/C][C]ar2[/C][C]ar3[/C][C]ma1[/C][C]sar1[/C][C]sar2[/C][/ROW]
[ROW][C]Estimates ( 1 )[/C][C]0.7986[/C][C]0.0016[/C][C]0.1687[/C][C]-0.7601[/C][C]-0.2784[/C][C]-0.1051[/C][/ROW]
[ROW][C](p-val)[/C][C](0 )[/C][C](0.992 )[/C][C](0.1699 )[/C][C](0 )[/C][C](0.0326 )[/C][C](0.3932 )[/C][/ROW]
[ROW][C]Estimates ( 2 )[/C][C]0.7995[/C][C]0[/C][C]0.1693[/C][C]-0.7602[/C][C]-0.278[/C][C]-0.1051[/C][/ROW]
[ROW][C](p-val)[/C][C](0 )[/C][C](NA )[/C][C](0.1119 )[/C][C](0 )[/C][C](0.021 )[/C][C](0.393 )[/C][/ROW]
[ROW][C]Estimates ( 3 )[/C][C]0.7938[/C][C]0[/C][C]0.1711[/C][C]-0.7591[/C][C]-0.2564[/C][C]0[/C][/ROW]
[ROW][C](p-val)[/C][C](0 )[/C][C](NA )[/C][C](0.1045 )[/C][C](0 )[/C][C](0.0267 )[/C][C](NA )[/C][/ROW]
[ROW][C]Estimates ( 4 )[/C][C]0.9764[/C][C]0[/C][C]0[/C][C]-0.842[/C][C]-0.2197[/C][C]0[/C][/ROW]
[ROW][C](p-val)[/C][C](0 )[/C][C](NA )[/C][C](NA )[/C][C](0 )[/C][C](0.0564 )[/C][C](NA )[/C][/ROW]
[ROW][C]Estimates ( 5 )[/C][C]0.969[/C][C]0[/C][C]0[/C][C]-0.8521[/C][C]0[/C][C]0[/C][/ROW]
[ROW][C](p-val)[/C][C](0 )[/C][C](NA )[/C][C](NA )[/C][C](0 )[/C][C](NA )[/C][C](NA )[/C][/ROW]
[ROW][C]Estimates ( 6 )[/C][C]NA[/C][C]NA[/C][C]NA[/C][C]NA[/C][C]NA[/C][C]NA[/C][/ROW]
[ROW][C](p-val)[/C][C](NA )[/C][C](NA )[/C][C](NA )[/C][C](NA )[/C][C](NA )[/C][C](NA )[/C][/ROW]
[ROW][C]Estimates ( 7 )[/C][C]NA[/C][C]NA[/C][C]NA[/C][C]NA[/C][C]NA[/C][C]NA[/C][/ROW]
[ROW][C](p-val)[/C][C](NA )[/C][C](NA )[/C][C](NA )[/C][C](NA )[/C][C](NA )[/C][C](NA )[/C][/ROW]
[ROW][C]Estimates ( 8 )[/C][C]NA[/C][C]NA[/C][C]NA[/C][C]NA[/C][C]NA[/C][C]NA[/C][/ROW]
[ROW][C](p-val)[/C][C](NA )[/C][C](NA )[/C][C](NA )[/C][C](NA )[/C][C](NA )[/C][C](NA )[/C][/ROW]
[ROW][C]Estimates ( 9 )[/C][C]NA[/C][C]NA[/C][C]NA[/C][C]NA[/C][C]NA[/C][C]NA[/C][/ROW]
[ROW][C](p-val)[/C][C](NA )[/C][C](NA )[/C][C](NA )[/C][C](NA )[/C][C](NA )[/C][C](NA )[/C][/ROW]
[ROW][C]Estimates ( 10 )[/C][C]NA[/C][C]NA[/C][C]NA[/C][C]NA[/C][C]NA[/C][C]NA[/C][/ROW]
[ROW][C](p-val)[/C][C](NA )[/C][C](NA )[/C][C](NA )[/C][C](NA )[/C][C](NA )[/C][C](NA )[/C][/ROW]
[ROW][C]Estimates ( 11 )[/C][C]NA[/C][C]NA[/C][C]NA[/C][C]NA[/C][C]NA[/C][C]NA[/C][/ROW]
[ROW][C](p-val)[/C][C](NA )[/C][C](NA )[/C][C](NA )[/C][C](NA )[/C][C](NA )[/C][C](NA )[/C][/ROW]
[/TABLE]
Source: https://freestatistics.org/blog/index.php?pk=110872&T=1

Globally Unique Identifier (entire table): ba.freestatistics.org/blog/index.php?pk=110872&T=1

As an alternative you can also use a QR Code:  

The GUIDs for individual cells are displayed in the table below:

ARIMA Parameter Estimation and Backward Selection
Iterationar1ar2ar3ma1sar1sar2
Estimates ( 1 )0.79860.00160.1687-0.7601-0.2784-0.1051
(p-val)(0 )(0.992 )(0.1699 )(0 )(0.0326 )(0.3932 )
Estimates ( 2 )0.799500.1693-0.7602-0.278-0.1051
(p-val)(0 )(NA )(0.1119 )(0 )(0.021 )(0.393 )
Estimates ( 3 )0.793800.1711-0.7591-0.25640
(p-val)(0 )(NA )(0.1045 )(0 )(0.0267 )(NA )
Estimates ( 4 )0.976400-0.842-0.21970
(p-val)(0 )(NA )(NA )(0 )(0.0564 )(NA )
Estimates ( 5 )0.96900-0.852100
(p-val)(0 )(NA )(NA )(0 )(NA )(NA )
Estimates ( 6 )NANANANANANA
(p-val)(NA )(NA )(NA )(NA )(NA )(NA )
Estimates ( 7 )NANANANANANA
(p-val)(NA )(NA )(NA )(NA )(NA )(NA )
Estimates ( 8 )NANANANANANA
(p-val)(NA )(NA )(NA )(NA )(NA )(NA )
Estimates ( 9 )NANANANANANA
(p-val)(NA )(NA )(NA )(NA )(NA )(NA )
Estimates ( 10 )NANANANANANA
(p-val)(NA )(NA )(NA )(NA )(NA )(NA )
Estimates ( 11 )NANANANANANA
(p-val)(NA )(NA )(NA )(NA )(NA )(NA )


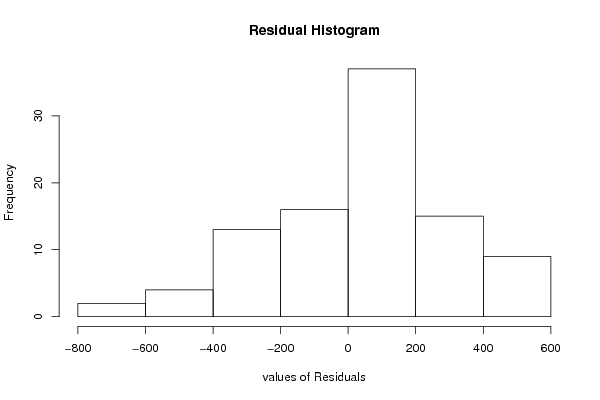
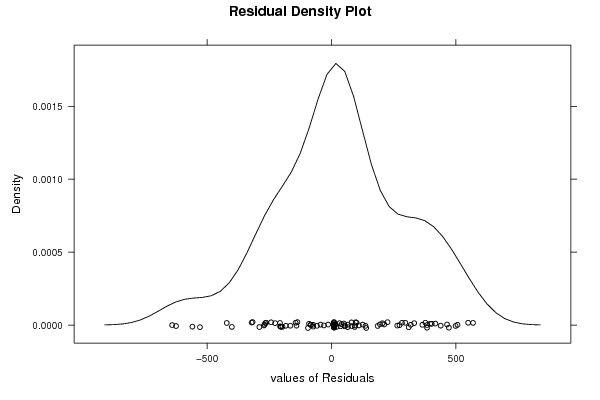
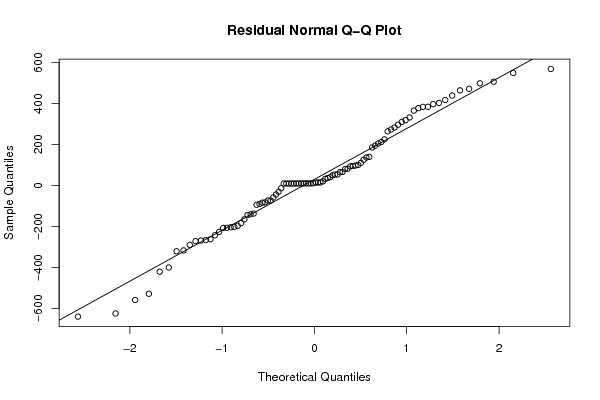
Estimated ARIMA Residuals
Value
9.39095961964454
139.383809129309
-625.182602062014
14.7073264160617
377.177394462004
-84.2691781056998
82.0561162909004
136.383610260078
-197.182353117541
-206.785454861182
40.1002375449907
-73.8807492459648
-82.7342719916951
-144.310477951144
185.408583232565
-30.5311028472794
-400.752869296455
-528.952892702166
-317.357200786706
211.980418729759
-44.1892574568898
296.514103387571
53.1925559246825
-226.763537260327
310.301020266150
93.1183474237112
-94.5855802133843
-242.912048269608
568.79190099458
-202.601101511397
464.25409544846
283.000933617443
-290.120130752053
417.30254073077
-204.172898416280
35.8402640745694
383.718712914044
110.194345656267
365.190690903721
194.565706321075
-184.008590153387
-266.614309242774
506.433709494422
49.3948602908575
471.798235823281
64.6969904021544
10.5732098596026
332.31653464488
225.051238605976
-207.338705870856
-73.8124285629621
402.836096726897
80.1038639777105
498.637800372026
-90.457687647651
-640.742414349301
264.332090148654
20.0534198727158
204.735469759627
-140.958040044543
-321.193325938753
125.136793317626
-137.289466356123
100.237597202951
-165.649150625006
549.197886207883
32.196823634471
53.5494823717829
-58.7481855224563
318.647391583908
383.895826820182
94.6452272629524
-559.292514978221
97.0965522866622
66.0968266510471
-271.578438479547
-262.541693133223
14.4559332199410
-269.221527416975
438.864434650791
396.768400239971
-421.305844375614
13.9242089701828
-13.4231537623992
273.206996375427

\begin{tabular}{lllllllll}
\hline
Estimated ARIMA Residuals \tabularnewline
Value \tabularnewline
9.39095961964454 \tabularnewline
139.383809129309 \tabularnewline
-625.182602062014 \tabularnewline
14.7073264160617 \tabularnewline
377.177394462004 \tabularnewline
-84.2691781056998 \tabularnewline
82.0561162909004 \tabularnewline
136.383610260078 \tabularnewline
-197.182353117541 \tabularnewline
-206.785454861182 \tabularnewline
40.1002375449907 \tabularnewline
-73.8807492459648 \tabularnewline
-82.7342719916951 \tabularnewline
-144.310477951144 \tabularnewline
185.408583232565 \tabularnewline
-30.5311028472794 \tabularnewline
-400.752869296455 \tabularnewline
-528.952892702166 \tabularnewline
-317.357200786706 \tabularnewline
211.980418729759 \tabularnewline
-44.1892574568898 \tabularnewline
296.514103387571 \tabularnewline
53.1925559246825 \tabularnewline
-226.763537260327 \tabularnewline
310.301020266150 \tabularnewline
93.1183474237112 \tabularnewline
-94.5855802133843 \tabularnewline
-242.912048269608 \tabularnewline
568.79190099458 \tabularnewline
-202.601101511397 \tabularnewline
464.25409544846 \tabularnewline
283.000933617443 \tabularnewline
-290.120130752053 \tabularnewline
417.30254073077 \tabularnewline
-204.172898416280 \tabularnewline
35.8402640745694 \tabularnewline
383.718712914044 \tabularnewline
110.194345656267 \tabularnewline
365.190690903721 \tabularnewline
194.565706321075 \tabularnewline
-184.008590153387 \tabularnewline
-266.614309242774 \tabularnewline
506.433709494422 \tabularnewline
49.3948602908575 \tabularnewline
471.798235823281 \tabularnewline
64.6969904021544 \tabularnewline
10.5732098596026 \tabularnewline
332.31653464488 \tabularnewline
225.051238605976 \tabularnewline
-207.338705870856 \tabularnewline
-73.8124285629621 \tabularnewline
402.836096726897 \tabularnewline
80.1038639777105 \tabularnewline
498.637800372026 \tabularnewline
-90.457687647651 \tabularnewline
-640.742414349301 \tabularnewline
264.332090148654 \tabularnewline
20.0534198727158 \tabularnewline
204.735469759627 \tabularnewline
-140.958040044543 \tabularnewline
-321.193325938753 \tabularnewline
125.136793317626 \tabularnewline
-137.289466356123 \tabularnewline
100.237597202951 \tabularnewline
-165.649150625006 \tabularnewline
549.197886207883 \tabularnewline
32.196823634471 \tabularnewline
53.5494823717829 \tabularnewline
-58.7481855224563 \tabularnewline
318.647391583908 \tabularnewline
383.895826820182 \tabularnewline
94.6452272629524 \tabularnewline
-559.292514978221 \tabularnewline
97.0965522866622 \tabularnewline
66.0968266510471 \tabularnewline
-271.578438479547 \tabularnewline
-262.541693133223 \tabularnewline
14.4559332199410 \tabularnewline
-269.221527416975 \tabularnewline
438.864434650791 \tabularnewline
396.768400239971 \tabularnewline
-421.305844375614 \tabularnewline
13.9242089701828 \tabularnewline
-13.4231537623992 \tabularnewline
273.206996375427 \tabularnewline
\hline
\end{tabular}
%Source: https://freestatistics.org/blog/index.php?pk=110872&T=2

[TABLE]
[ROW][C]Estimated ARIMA Residuals[/C][/ROW]
[ROW][C]Value[/C][/ROW]
[ROW][C]9.39095961964454[/C][/ROW]
[ROW][C]139.383809129309[/C][/ROW]
[ROW][C]-625.182602062014[/C][/ROW]
[ROW][C]14.7073264160617[/C][/ROW]
[ROW][C]377.177394462004[/C][/ROW]
[ROW][C]-84.2691781056998[/C][/ROW]
[ROW][C]82.0561162909004[/C][/ROW]
[ROW][C]136.383610260078[/C][/ROW]
[ROW][C]-197.182353117541[/C][/ROW]
[ROW][C]-206.785454861182[/C][/ROW]
[ROW][C]40.1002375449907[/C][/ROW]
[ROW][C]-73.8807492459648[/C][/ROW]
[ROW][C]-82.7342719916951[/C][/ROW]
[ROW][C]-144.310477951144[/C][/ROW]
[ROW][C]185.408583232565[/C][/ROW]
[ROW][C]-30.5311028472794[/C][/ROW]
[ROW][C]-400.752869296455[/C][/ROW]
[ROW][C]-528.952892702166[/C][/ROW]
[ROW][C]-317.357200786706[/C][/ROW]
[ROW][C]211.980418729759[/C][/ROW]
[ROW][C]-44.1892574568898[/C][/ROW]
[ROW][C]296.514103387571[/C][/ROW]
[ROW][C]53.1925559246825[/C][/ROW]
[ROW][C]-226.763537260327[/C][/ROW]
[ROW][C]310.301020266150[/C][/ROW]
[ROW][C]93.1183474237112[/C][/ROW]
[ROW][C]-94.5855802133843[/C][/ROW]
[ROW][C]-242.912048269608[/C][/ROW]
[ROW][C]568.79190099458[/C][/ROW]
[ROW][C]-202.601101511397[/C][/ROW]
[ROW][C]464.25409544846[/C][/ROW]
[ROW][C]283.000933617443[/C][/ROW]
[ROW][C]-290.120130752053[/C][/ROW]
[ROW][C]417.30254073077[/C][/ROW]
[ROW][C]-204.172898416280[/C][/ROW]
[ROW][C]35.8402640745694[/C][/ROW]
[ROW][C]383.718712914044[/C][/ROW]
[ROW][C]110.194345656267[/C][/ROW]
[ROW][C]365.190690903721[/C][/ROW]
[ROW][C]194.565706321075[/C][/ROW]
[ROW][C]-184.008590153387[/C][/ROW]
[ROW][C]-266.614309242774[/C][/ROW]
[ROW][C]506.433709494422[/C][/ROW]
[ROW][C]49.3948602908575[/C][/ROW]
[ROW][C]471.798235823281[/C][/ROW]
[ROW][C]64.6969904021544[/C][/ROW]
[ROW][C]10.5732098596026[/C][/ROW]
[ROW][C]332.31653464488[/C][/ROW]
[ROW][C]225.051238605976[/C][/ROW]
[ROW][C]-207.338705870856[/C][/ROW]
[ROW][C]-73.8124285629621[/C][/ROW]
[ROW][C]402.836096726897[/C][/ROW]
[ROW][C]80.1038639777105[/C][/ROW]
[ROW][C]498.637800372026[/C][/ROW]
[ROW][C]-90.457687647651[/C][/ROW]
[ROW][C]-640.742414349301[/C][/ROW]
[ROW][C]264.332090148654[/C][/ROW]
[ROW][C]20.0534198727158[/C][/ROW]
[ROW][C]204.735469759627[/C][/ROW]
[ROW][C]-140.958040044543[/C][/ROW]
[ROW][C]-321.193325938753[/C][/ROW]
[ROW][C]125.136793317626[/C][/ROW]
[ROW][C]-137.289466356123[/C][/ROW]
[ROW][C]100.237597202951[/C][/ROW]
[ROW][C]-165.649150625006[/C][/ROW]
[ROW][C]549.197886207883[/C][/ROW]
[ROW][C]32.196823634471[/C][/ROW]
[ROW][C]53.5494823717829[/C][/ROW]
[ROW][C]-58.7481855224563[/C][/ROW]
[ROW][C]318.647391583908[/C][/ROW]
[ROW][C]383.895826820182[/C][/ROW]
[ROW][C]94.6452272629524[/C][/ROW]
[ROW][C]-559.292514978221[/C][/ROW]
[ROW][C]97.0965522866622[/C][/ROW]
[ROW][C]66.0968266510471[/C][/ROW]
[ROW][C]-271.578438479547[/C][/ROW]
[ROW][C]-262.541693133223[/C][/ROW]
[ROW][C]14.4559332199410[/C][/ROW]
[ROW][C]-269.221527416975[/C][/ROW]
[ROW][C]438.864434650791[/C][/ROW]
[ROW][C]396.768400239971[/C][/ROW]
[ROW][C]-421.305844375614[/C][/ROW]
[ROW][C]13.9242089701828[/C][/ROW]
[ROW][C]-13.4231537623992[/C][/ROW]
[ROW][C]273.206996375427[/C][/ROW]
[/TABLE]
Source: https://freestatistics.org/blog/index.php?pk=110872&T=2

Globally Unique Identifier (entire table): ba.freestatistics.org/blog/index.php?pk=110872&T=2

As an alternative you can also use a QR Code:  

The GUIDs for individual cells are displayed in the table below:

Estimated ARIMA Residuals
Value
9.39095961964454
139.383809129309
-625.182602062014
14.7073264160617
377.177394462004
-84.2691781056998
82.0561162909004
136.383610260078
-197.182353117541
-206.785454861182
40.1002375449907
-73.8807492459648
-82.7342719916951
-144.310477951144
185.408583232565
-30.5311028472794
-400.752869296455
-528.952892702166
-317.357200786706
211.980418729759
-44.1892574568898
296.514103387571
53.1925559246825
-226.763537260327
310.301020266150
93.1183474237112
-94.5855802133843
-242.912048269608
568.79190099458
-202.601101511397
464.25409544846
283.000933617443
-290.120130752053
417.30254073077
-204.172898416280
35.8402640745694
383.718712914044
110.194345656267
365.190690903721
194.565706321075
-184.008590153387
-266.614309242774
506.433709494422
49.3948602908575
471.798235823281
64.6969904021544
10.5732098596026
332.31653464488
225.051238605976
-207.338705870856
-73.8124285629621
402.836096726897
80.1038639777105
498.637800372026
-90.457687647651
-640.742414349301
264.332090148654
20.0534198727158
204.735469759627
-140.958040044543
-321.193325938753
125.136793317626
-137.289466356123
100.237597202951
-165.649150625006
549.197886207883
32.196823634471
53.5494823717829
-58.7481855224563
318.647391583908
383.895826820182
94.6452272629524
-559.292514978221
97.0965522866622
66.0968266510471
-271.578438479547
-262.541693133223
14.4559332199410
-269.221527416975
438.864434650791
396.768400239971
-421.305844375614
13.9242089701828
-13.4231537623992
273.206996375427


Parameters (Session):
par1 = FALSE ; par2 = 1 ; par3 = 0 ; par4 = 1 ; par5 = 12 ; par6 = 3 ; par7 = 1 ; par8 = 2 ; par9 = 0 ;
Parameters (R input):
par1 = FALSE ; par2 = 1 ; par3 = 0 ; par4 = 1 ; par5 = 12 ; par6 = 3 ; par7 = 1 ; par8 = 2 ; par9 = 0 ;
R code (references can be found in the software module):
library(lattice)
if (par1 == 'TRUE') par1 <- TRUE
if (par1 == 'FALSE') par1 <- FALSE
par2 <- as.numeric(par2) #Box-Cox lambda transformation parameter
par3 <- as.numeric(par3) #degree of non-seasonal differencing
par4 <- as.numeric(par4) #degree of seasonal differencing
par5 <- as.numeric(par5) #seasonal period
par6 <- as.numeric(par6) #degree (p) of the non-seasonal AR(p) polynomial
par7 <- as.numeric(par7) #degree (q) of the non-seasonal MA(q) polynomial
par8 <- as.numeric(par8) #degree (P) of the seasonal AR(P) polynomial
par9 <- as.numeric(par9) #degree (Q) of the seasonal MA(Q) polynomial
armaGR <- function(arima.out, names, n){
try1 <- arima.out$coef
try2 <- sqrt(diag(arima.out$var.coef))
try.data.frame <- data.frame(matrix(NA,ncol=4,nrow=length(names)))
dimnames(try.data.frame) <- list(names,c('coef','std','tstat','pv'))
try.data.frame[,1] <- try1
for(i in 1:length(try2)) try.data.frame[which(rownames(try.data.frame)==names(try2)[i]),2] <- try2[i]
try.data.frame[,3] <- try.data.frame[,1] / try.data.frame[,2]
try.data.frame[,4] <- round((1-pt(abs(try.data.frame[,3]),df=n-(length(try2)+1)))*2,5)
vector <- rep(NA,length(names))
vector[is.na(try.data.frame[,4])] <- 0
maxi <- which.max(try.data.frame[,4])
continue <- max(try.data.frame[,4],na.rm=TRUE) > .05
vector[maxi] <- 0
list(summary=try.data.frame,next.vector=vector,continue=continue)
}
arimaSelect <- function(series, order=c(13,0,0), seasonal=list(order=c(2,0,0),period=12), include.mean=F){
nrc <- order[1]+order[3]+seasonal$order[1]+seasonal$order[3]
coeff <- matrix(NA, nrow=nrc*2, ncol=nrc)
pval <- matrix(NA, nrow=nrc*2, ncol=nrc)
mylist <- rep(list(NULL), nrc)
names <- NULL
if(order[1] > 0) names <- paste('ar',1:order[1],sep='')
if(order[3] > 0) names <- c( names , paste('ma',1:order[3],sep='') )
if(seasonal$order[1] > 0) names <- c(names, paste('sar',1:seasonal$order[1],sep=''))
if(seasonal$order[3] > 0) names <- c(names, paste('sma',1:seasonal$order[3],sep=''))
arima.out <- arima(series, order=order, seasonal=seasonal, include.mean=include.mean, method='ML')
mylist[[1]] <- arima.out
last.arma <- armaGR(arima.out, names, length(series))
mystop <- FALSE
i <- 1
coeff[i,] <- last.arma[[1]][,1]
pval [i,] <- last.arma[[1]][,4]
i <- 2
aic <- arima.out$aic
while(!mystop){
mylist[[i]] <- arima.out
arima.out <- arima(series, order=order, seasonal=seasonal, include.mean=include.mean, method='ML', fixed=last.arma$next.vector)
aic <- c(aic, arima.out$aic)
last.arma <- armaGR(arima.out, names, length(series))
mystop <- !last.arma$continue
coeff[i,] <- last.arma[[1]][,1]
pval [i,] <- last.arma[[1]][,4]
i <- i+1
}
list(coeff, pval, mylist, aic=aic)
}
arimaSelectplot <- function(arimaSelect.out,noms,choix){
noms <- names(arimaSelect.out[[3]][[1]]$coef)
coeff <- arimaSelect.out[[1]]
k <- min(which(is.na(coeff[,1])))-1
coeff <- coeff[1:k,]
pval <- arimaSelect.out[[2]][1:k,]
aic <- arimaSelect.out$aic[1:k]
coeff[coeff==0] <- NA
n <- ncol(coeff)
if(missing(choix)) choix <- k
layout(matrix(c(1,1,1,2,
3,3,3,2,
3,3,3,4,
5,6,7,7),nr=4),
widths=c(10,35,45,15),
heights=c(30,30,15,15))
couleurs <- rainbow(75)[1:50]#(50)
ticks <- pretty(coeff)
par(mar=c(1,1,3,1))
plot(aic,k:1-.5,type='o',pch=21,bg='blue',cex=2,axes=F,lty=2,xpd=NA)
points(aic[choix],k-choix+.5,pch=21,cex=4,bg=2,xpd=NA)
title('aic',line=2)
par(mar=c(3,0,0,0))
plot(0,axes=F,xlab='',ylab='',xlim=range(ticks),ylim=c(.1,1))
rect(xleft = min(ticks) + (0:49)/50*(max(ticks)-min(ticks)),
xright = min(ticks) + (1:50)/50*(max(ticks)-min(ticks)),
ytop = rep(1,50),
ybottom= rep(0,50),col=couleurs,border=NA)
axis(1,ticks)
rect(xleft=min(ticks),xright=max(ticks),ytop=1,ybottom=0)
text(mean(coeff,na.rm=T),.5,'coefficients',cex=2,font=2)
par(mar=c(1,1,3,1))
image(1:n,1:k,t(coeff[k:1,]),axes=F,col=couleurs,zlim=range(ticks))
for(i in 1:n) for(j in 1:k) if(!is.na(coeff[j,i])) {
if(pval[j,i]<.01) symb = 'green'
else if( (pval[j,i]<.05) & (pval[j,i]>=.01)) symb = 'orange'
else if( (pval[j,i]<.1) & (pval[j,i]>=.05)) symb = 'red'
else symb = 'black'
polygon(c(i+.5 ,i+.2 ,i+.5 ,i+.5),
c(k-j+0.5,k-j+0.5,k-j+0.8,k-j+0.5),
col=symb)
if(j==choix) {
rect(xleft=i-.5,
xright=i+.5,
ybottom=k-j+1.5,
ytop=k-j+.5,
lwd=4)
text(i,
k-j+1,
round(coeff[j,i],2),
cex=1.2,
font=2)
}
else{
rect(xleft=i-.5,xright=i+.5,ybottom=k-j+1.5,ytop=k-j+.5)
text(i,k-j+1,round(coeff[j,i],2),cex=1.2,font=1)
}
}
axis(3,1:n,noms)
par(mar=c(0.5,0,0,0.5))
plot(0,axes=F,xlab='',ylab='',type='n',xlim=c(0,8),ylim=c(-.2,.8))
cols <- c('green','orange','red','black')
niv <- c('0','0.01','0.05','0.1')
for(i in 0:3){
polygon(c(1+2*i ,1+2*i ,1+2*i-.5 ,1+2*i),
c(.4 ,.7 , .4 , .4),
col=cols[i+1])
text(2*i,0.5,niv[i+1],cex=1.5)
}
text(8,.5,1,cex=1.5)
text(4,0,'p-value',cex=2)
box()
residus <- arimaSelect.out[[3]][[choix]]$res
par(mar=c(1,2,4,1))
acf(residus,main='')
title('acf',line=.5)
par(mar=c(1,2,4,1))
pacf(residus,main='')
title('pacf',line=.5)
par(mar=c(2,2,4,1))
qqnorm(residus,main='')
title('qq-norm',line=.5)
qqline(residus)
residus
}
if (par2 == 0) x <- log(x)
if (par2 != 0) x <- x^par2
(selection <- arimaSelect(x, order=c(par6,par3,par7), seasonal=list(order=c(par8,par4,par9), period=par5)))
bitmap(file='test1.png')
resid <- arimaSelectplot(selection)
dev.off()
resid
bitmap(file='test2.png')
acf(resid,length(resid)/2, main='Residual Autocorrelation Function')
dev.off()
bitmap(file='test3.png')
pacf(resid,length(resid)/2, main='Residual Partial Autocorrelation Function')
dev.off()
bitmap(file='test4.png')
cpgram(resid, main='Residual Cumulative Periodogram')
dev.off()
bitmap(file='test5.png')
hist(resid, main='Residual Histogram', xlab='values of Residuals')
dev.off()
bitmap(file='test6.png')
densityplot(~resid,col='black',main='Residual Density Plot', xlab='values of Residuals')
dev.off()
bitmap(file='test7.png')
qqnorm(resid, main='Residual Normal Q-Q Plot')
qqline(resid)
dev.off()
ncols <- length(selection[[1]][1,])
nrows <- length(selection[[2]][,1])-1
load(file='createtable')
a<-table.start()
a<-table.row.start(a)
a<-table.element(a,'ARIMA Parameter Estimation and Backward Selection', ncols+1,TRUE)
a<-table.row.end(a)
a<-table.row.start(a)
a<-table.element(a,'Iteration', header=TRUE)
for (i in 1:ncols) {
a<-table.element(a,names(selection[[3]][[1]]$coef)[i],header=TRUE)
}
a<-table.row.end(a)
for (j in 1:nrows) {
a<-table.row.start(a)
mydum <- 'Estimates ('
mydum <- paste(mydum,j)
mydum <- paste(mydum,')')
a<-table.element(a,mydum, header=TRUE)
for (i in 1:ncols) {
a<-table.element(a,round(selection[[1]][j,i],4))
}
a<-table.row.end(a)
a<-table.row.start(a)
a<-table.element(a,'(p-val)', header=TRUE)
for (i in 1:ncols) {
mydum <- '('
mydum <- paste(mydum,round(selection[[2]][j,i],4),sep='')
mydum <- paste(mydum,')')
a<-table.element(a,mydum)
}
a<-table.row.end(a)
}
a<-table.end(a)
table.save(a,file='mytable.tab')
a<-table.start()
a<-table.row.start(a)
a<-table.element(a,'Estimated ARIMA Residuals', 1,TRUE)
a<-table.row.end(a)
a<-table.row.start(a)
a<-table.element(a,'Value', 1,TRUE)
a<-table.row.end(a)
for (i in (par4*par5+par3):length(resid)) {
a<-table.row.start(a)
a<-table.element(a,resid[i])
a<-table.row.end(a)
}
a<-table.end(a)
table.save(a,file='mytable1.tab')