Free Statistics

of Irreproducible Research!

Author's title

Author*The author of this computation has been verified*
R Software Modulerwasp_multipleregression.wasp
Title produced by softwareMultiple Regression
Date of computationThu, 16 Dec 2010 12:33:36 +0000
Cite this page as followsStatistical Computations at FreeStatistics.org, Office for Research Development and Education, URL https://freestatistics.org/blog/index.php?v=date/2010/Dec/16/t1292502763rvxsnzu0ao5f4aq.htm/, Retrieved Fri, 03 May 2024 04:11:59 +0000
Statistical Computations at FreeStatistics.org, Office for Research Development and Education, URL https://freestatistics.org/blog/index.php?pk=110871, Retrieved Fri, 03 May 2024 04:11:59 +0000
QR Codes:

Original text written by user:
IsPrivate?No (this computation is public)
User-defined keywords
Estimated Impact97
Family? (F = Feedback message, R = changed R code, M = changed R Module, P = changed Parameters, D = changed Data)
-     [Multiple Regression] [s] [2008-01-06 17:15:46] [65602aedddfd01b4de73eae6ca507c22]
-  MPD  [Multiple Regression] [] [2010-12-16 12:23:44] [d7b28a0391ab3b2ddc9f9fba95a43f33]
-   PD      [Multiple Regression] [] [2010-12-16 12:33:36] [44163a3390d803b6e1dc8c2f0815c192] [Current]
-   P         [Multiple Regression] [] [2010-12-16 12:37:02] [d7b28a0391ab3b2ddc9f9fba95a43f33]
-   P           [Multiple Regression] [] [2010-12-16 12:41:25] [d7b28a0391ab3b2ddc9f9fba95a43f33]
Feedback Forum

Post a new message
Dataseries X:
300	2.26
302	2.57
400	3.07
392	2.76
373	2.51
379	2.87
303	3.14
324	3.11
353	3.16
392	2.47
327	2.57
376	2.89
329	2.63
359	2.38
413	1.69
338	1.96
422	2.19
390	1.87
370	1.60
367	1.63
406	1.22
418	1.21
346	1.49
350	1.64
330	1.66
318	1.77
382	1.82
337	1.78
372	1.28
422	1.29
428	1.37
426	1.12
396	1.51
458	2.24
315	2.94
337	3.09
386	3.46
352	3.64
383	4.39
439	4.15
397	5.21
453	5.80
363	5.91
365	5.39
474	5.46
373	4.72
403	3.14
384	2.63
364	2.32
361	1.93
419	0.62
352	0.60
363	-0.37
410	-1.10
361	-1.68
383	-0.78
342	-1.19
369	-0.79
361	-0.12
317	0.26
386	0.62
318	0.70
407	1.66
393	1.80
404	2.27
498	2.46
438	2.57


Summary of computational transaction
Raw Inputview raw input (R code)
Raw Outputview raw output of R engine
Computing time5 seconds
R Server'George Udny Yule' @ 72.249.76.132
R Framework error message
The field 'Names of X columns' contains a hard return which cannot be interpreted.
Please, resubmit your request without hard returns in the 'Names of X columns'.

\begin{tabular}{lllllllll}
\hline
Summary of computational transaction \tabularnewline
Raw Input & view raw input (R code)  \tabularnewline
Raw Output & view raw output of R engine  \tabularnewline
Computing time & 5 seconds \tabularnewline
R Server & 'George Udny Yule' @ 72.249.76.132 \tabularnewline
R Framework error message & 
The field 'Names of X columns' contains a hard return which cannot be interpreted.
Please, resubmit your request without hard returns in the 'Names of X columns'.
\tabularnewline \hline \end{tabular} %Source: https://freestatistics.org/blog/index.php?pk=110871&T=0

[TABLE]
[ROW][C]Summary of computational transaction[/C][/ROW]
[ROW][C]Raw Input[/C][C]view raw input (R code) [/C][/ROW]
[ROW][C]Raw Output[/C][C]view raw output of R engine [/C][/ROW]
[ROW][C]Computing time[/C][C]5 seconds[/C][/ROW]
[ROW][C]R Server[/C][C]'George Udny Yule' @ 72.249.76.132[/C][/ROW]
[ROW][C]R Framework error message[/C][C]
The field 'Names of X columns' contains a hard return which cannot be interpreted.
Please, resubmit your request without hard returns in the 'Names of X columns'.
[/C][/ROW] [/TABLE] Source: https://freestatistics.org/blog/index.php?pk=110871&T=0

Globally Unique Identifier (entire table): ba.freestatistics.org/blog/index.php?pk=110871&T=0

As an alternative you can also use a QR Code:  

The GUIDs for individual cells are displayed in the table below:

Summary of computational transaction
Raw Inputview raw input (R code)
Raw Outputview raw output of R engine
Computing time5 seconds
R Server'George Udny Yule' @ 72.249.76.132
R Framework error message
The field 'Names of X columns' contains a hard return which cannot be interpreted.
Please, resubmit your request without hard returns in the 'Names of X columns'.


Multiple Linear Regression - Estimated Regression Equation
bouwvergunningen[t] = + 344.887869993583 + 3.76409610200597`inflatie `[t] -3.84537741374636M1[t] -18.0371380544264M2[t] + 47.4664177811533M3[t] + 22.0918876512202M4[t] + 35.4001270105402M5[t] + 72.1707254088401M6[t] + 24.1797165602670M7[t] + 20.2301127688160M8[t] + 41.6634867271404M9[t] + 49.6968606854647M10[t] -2.03111858200344M11[t] + e[t]

\begin{tabular}{lllllllll}
\hline
Multiple Linear Regression - Estimated Regression Equation \tabularnewline
bouwvergunningen[t] =  +  344.887869993583 +  3.76409610200597`inflatie
`[t] -3.84537741374636M1[t] -18.0371380544264M2[t] +  47.4664177811533M3[t] +  22.0918876512202M4[t] +  35.4001270105402M5[t] +  72.1707254088401M6[t] +  24.1797165602670M7[t] +  20.2301127688160M8[t] +  41.6634867271404M9[t] +  49.6968606854647M10[t] -2.03111858200344M11[t]  + e[t] \tabularnewline
\hline
\end{tabular}
%Source: https://freestatistics.org/blog/index.php?pk=110871&T=1

[TABLE]
[ROW][C]Multiple Linear Regression - Estimated Regression Equation[/C][/ROW]
[ROW][C]bouwvergunningen[t] =  +  344.887869993583 +  3.76409610200597`inflatie
`[t] -3.84537741374636M1[t] -18.0371380544264M2[t] +  47.4664177811533M3[t] +  22.0918876512202M4[t] +  35.4001270105402M5[t] +  72.1707254088401M6[t] +  24.1797165602670M7[t] +  20.2301127688160M8[t] +  41.6634867271404M9[t] +  49.6968606854647M10[t] -2.03111858200344M11[t]  + e[t][/C][/ROW]
[/TABLE]
Source: https://freestatistics.org/blog/index.php?pk=110871&T=1

Globally Unique Identifier (entire table): ba.freestatistics.org/blog/index.php?pk=110871&T=1

As an alternative you can also use a QR Code:  

The GUIDs for individual cells are displayed in the table below:

Multiple Linear Regression - Estimated Regression Equation
bouwvergunningen[t] = + 344.887869993583 + 3.76409610200597`inflatie `[t] -3.84537741374636M1[t] -18.0371380544264M2[t] + 47.4664177811533M3[t] + 22.0918876512202M4[t] + 35.4001270105402M5[t] + 72.1707254088401M6[t] + 24.1797165602670M7[t] + 20.2301127688160M8[t] + 41.6634867271404M9[t] + 49.6968606854647M10[t] -2.03111858200344M11[t] + e[t]


Multiple Linear Regression - Ordinary Least Squares
VariableParameterS.D.T-STATH0: parameter = 02-tail p-value1-tail p-value
(Intercept)344.88786999358317.13008420.133500
`inflatie `3.764096102005972.7466411.37040.1762210.088111
M1-3.8453774137463621.837745-0.17610.8608830.430442
M2-18.037138054426421.837882-0.8260.4124630.206232
M347.466417781153321.839152.17350.034150.017075
M422.091887651220221.8381171.01160.3162310.158116
M535.400127010540221.8382931.6210.1108410.05542
M672.170725408840121.8387993.30470.0016930.000846
M724.179716560267021.8376231.10730.2730940.136547
M820.230112768816022.8082190.8870.3790310.189515
M941.663486727140422.8090181.82660.0732860.036643
M1049.696860685464722.8110892.17860.0337430.016872
M11-2.0311185820034422.809796-0.0890.9293750.464687

\begin{tabular}{lllllllll}
\hline
Multiple Linear Regression - Ordinary Least Squares \tabularnewline
Variable & Parameter & S.D. & T-STATH0: parameter = 0 & 2-tail p-value & 1-tail p-value \tabularnewline
(Intercept) & 344.887869993583 & 17.130084 & 20.1335 & 0 & 0 \tabularnewline
`inflatie
` & 3.76409610200597 & 2.746641 & 1.3704 & 0.176221 & 0.088111 \tabularnewline
M1 & -3.84537741374636 & 21.837745 & -0.1761 & 0.860883 & 0.430442 \tabularnewline
M2 & -18.0371380544264 & 21.837882 & -0.826 & 0.412463 & 0.206232 \tabularnewline
M3 & 47.4664177811533 & 21.83915 & 2.1735 & 0.03415 & 0.017075 \tabularnewline
M4 & 22.0918876512202 & 21.838117 & 1.0116 & 0.316231 & 0.158116 \tabularnewline
M5 & 35.4001270105402 & 21.838293 & 1.621 & 0.110841 & 0.05542 \tabularnewline
M6 & 72.1707254088401 & 21.838799 & 3.3047 & 0.001693 & 0.000846 \tabularnewline
M7 & 24.1797165602670 & 21.837623 & 1.1073 & 0.273094 & 0.136547 \tabularnewline
M8 & 20.2301127688160 & 22.808219 & 0.887 & 0.379031 & 0.189515 \tabularnewline
M9 & 41.6634867271404 & 22.809018 & 1.8266 & 0.073286 & 0.036643 \tabularnewline
M10 & 49.6968606854647 & 22.811089 & 2.1786 & 0.033743 & 0.016872 \tabularnewline
M11 & -2.03111858200344 & 22.809796 & -0.089 & 0.929375 & 0.464687 \tabularnewline
\hline
\end{tabular}
%Source: https://freestatistics.org/blog/index.php?pk=110871&T=2

[TABLE]
[ROW][C]Multiple Linear Regression - Ordinary Least Squares[/C][/ROW]
[ROW][C]Variable[/C][C]Parameter[/C][C]S.D.[/C][C]T-STATH0: parameter = 0[/C][C]2-tail p-value[/C][C]1-tail p-value[/C][/ROW]
[ROW][C](Intercept)[/C][C]344.887869993583[/C][C]17.130084[/C][C]20.1335[/C][C]0[/C][C]0[/C][/ROW]
[ROW][C]`inflatie
`[/C][C]3.76409610200597[/C][C]2.746641[/C][C]1.3704[/C][C]0.176221[/C][C]0.088111[/C][/ROW]
[ROW][C]M1[/C][C]-3.84537741374636[/C][C]21.837745[/C][C]-0.1761[/C][C]0.860883[/C][C]0.430442[/C][/ROW]
[ROW][C]M2[/C][C]-18.0371380544264[/C][C]21.837882[/C][C]-0.826[/C][C]0.412463[/C][C]0.206232[/C][/ROW]
[ROW][C]M3[/C][C]47.4664177811533[/C][C]21.83915[/C][C]2.1735[/C][C]0.03415[/C][C]0.017075[/C][/ROW]
[ROW][C]M4[/C][C]22.0918876512202[/C][C]21.838117[/C][C]1.0116[/C][C]0.316231[/C][C]0.158116[/C][/ROW]
[ROW][C]M5[/C][C]35.4001270105402[/C][C]21.838293[/C][C]1.621[/C][C]0.110841[/C][C]0.05542[/C][/ROW]
[ROW][C]M6[/C][C]72.1707254088401[/C][C]21.838799[/C][C]3.3047[/C][C]0.001693[/C][C]0.000846[/C][/ROW]
[ROW][C]M7[/C][C]24.1797165602670[/C][C]21.837623[/C][C]1.1073[/C][C]0.273094[/C][C]0.136547[/C][/ROW]
[ROW][C]M8[/C][C]20.2301127688160[/C][C]22.808219[/C][C]0.887[/C][C]0.379031[/C][C]0.189515[/C][/ROW]
[ROW][C]M9[/C][C]41.6634867271404[/C][C]22.809018[/C][C]1.8266[/C][C]0.073286[/C][C]0.036643[/C][/ROW]
[ROW][C]M10[/C][C]49.6968606854647[/C][C]22.811089[/C][C]2.1786[/C][C]0.033743[/C][C]0.016872[/C][/ROW]
[ROW][C]M11[/C][C]-2.03111858200344[/C][C]22.809796[/C][C]-0.089[/C][C]0.929375[/C][C]0.464687[/C][/ROW]
[/TABLE]
Source: https://freestatistics.org/blog/index.php?pk=110871&T=2

Globally Unique Identifier (entire table): ba.freestatistics.org/blog/index.php?pk=110871&T=2

As an alternative you can also use a QR Code:  

The GUIDs for individual cells are displayed in the table below:

Multiple Linear Regression - Ordinary Least Squares
VariableParameterS.D.T-STATH0: parameter = 02-tail p-value1-tail p-value
(Intercept)344.88786999358317.13008420.133500
`inflatie `3.764096102005972.7466411.37040.1762210.088111
M1-3.8453774137463621.837745-0.17610.8608830.430442
M2-18.037138054426421.837882-0.8260.4124630.206232
M347.466417781153321.839152.17350.034150.017075
M422.091887651220221.8381171.01160.3162310.158116
M535.400127010540221.8382931.6210.1108410.05542
M672.170725408840121.8387993.30470.0016930.000846
M724.179716560267021.8376231.10730.2730940.136547
M820.230112768816022.8082190.8870.3790310.189515
M941.663486727140422.8090181.82660.0732860.036643
M1049.696860685464722.8110892.17860.0337430.016872
M11-2.0311185820034422.809796-0.0890.9293750.464687


Multiple Linear Regression - Regression Statistics
Multiple R0.63324623870236
R-squared0.401000798830687
Adjusted R-squared0.267889865237506
F-TEST (value)3.01253088687848
F-TEST (DF numerator)12
F-TEST (DF denominator)54
p-value0.00271853806529065
Multiple Linear Regression - Residual Statistics
Residual Standard Deviation36.0629432196610
Sum Squared Residuals70228.9371778828

\begin{tabular}{lllllllll}
\hline
Multiple Linear Regression - Regression Statistics \tabularnewline
Multiple R & 0.63324623870236 \tabularnewline
R-squared & 0.401000798830687 \tabularnewline
Adjusted R-squared & 0.267889865237506 \tabularnewline
F-TEST (value) & 3.01253088687848 \tabularnewline
F-TEST (DF numerator) & 12 \tabularnewline
F-TEST (DF denominator) & 54 \tabularnewline
p-value & 0.00271853806529065 \tabularnewline
Multiple Linear Regression - Residual Statistics \tabularnewline
Residual Standard Deviation & 36.0629432196610 \tabularnewline
Sum Squared Residuals & 70228.9371778828 \tabularnewline
\hline
\end{tabular}
%Source: https://freestatistics.org/blog/index.php?pk=110871&T=3

[TABLE]
[ROW][C]Multiple Linear Regression - Regression Statistics[/C][/ROW]
[ROW][C]Multiple R[/C][C]0.63324623870236[/C][/ROW]
[ROW][C]R-squared[/C][C]0.401000798830687[/C][/ROW]
[ROW][C]Adjusted R-squared[/C][C]0.267889865237506[/C][/ROW]
[ROW][C]F-TEST (value)[/C][C]3.01253088687848[/C][/ROW]
[ROW][C]F-TEST (DF numerator)[/C][C]12[/C][/ROW]
[ROW][C]F-TEST (DF denominator)[/C][C]54[/C][/ROW]
[ROW][C]p-value[/C][C]0.00271853806529065[/C][/ROW]
[ROW][C]Multiple Linear Regression - Residual Statistics[/C][/ROW]
[ROW][C]Residual Standard Deviation[/C][C]36.0629432196610[/C][/ROW]
[ROW][C]Sum Squared Residuals[/C][C]70228.9371778828[/C][/ROW]
[/TABLE]
Source: https://freestatistics.org/blog/index.php?pk=110871&T=3

Globally Unique Identifier (entire table): ba.freestatistics.org/blog/index.php?pk=110871&T=3

As an alternative you can also use a QR Code:  

The GUIDs for individual cells are displayed in the table below:

Multiple Linear Regression - Regression Statistics
Multiple R0.63324623870236
R-squared0.401000798830687
Adjusted R-squared0.267889865237506
F-TEST (value)3.01253088687848
F-TEST (DF numerator)12
F-TEST (DF denominator)54
p-value0.00271853806529065
Multiple Linear Regression - Residual Statistics
Residual Standard Deviation36.0629432196610
Sum Squared Residuals70228.9371778828


Multiple Linear Regression - Actuals, Interpolation, and Residuals
Time or IndexActualsInterpolationForecastResidualsPrediction Error
1300349.549349770371-49.5493497703707
2302336.524458921312-34.5244589213124
3400403.910062807895-3.91006280789517
4392377.3686628863414.6313371136598
5373389.735878220159-16.7358782201586
6379427.861551215181-48.8615512151807
7303380.886848314149-77.8868483141492
8324376.824321639638-52.8243216396381
9353398.445900403063-45.4459004030628
10392403.882048051003-11.8820480510030
11327352.530478393735-25.5304783937354
12376355.76610772838120.2338922716193
13329350.942065328113-21.9420653281128
14359335.80928066193123.1907193380687
15413398.71561018712714.2843898128731
16338374.357386004735-36.3573860047354
17422388.53136746751733.4686325324833
18390424.097455113175-34.0974551131747
19370375.09014031706-5.09014031706005
20367371.253459408669-4.25345940866923
21406391.14355396517114.8564460348288
22418399.13928696247518.8607130375245
23346348.465254603569-2.46525460356892
24350351.060987600873-1.06098760087327
25330347.290892109167-17.290892109167
26318333.513182039708-15.5131820397076
27382399.204942680388-17.2049426803877
28337373.679848706374-36.6798487063743
29372385.106040014691-13.1060400146913
30422421.9142793740110.0857206259887766
31428374.22439821359953.7756017864013
32426369.33377039664656.6662296033538
33396392.2351418347533.76485816524712
34458403.01630594754254.9836940524584
35315353.923193951478-38.9231939514776
36337356.518926948782-19.5189269487819
37386354.06626509277831.9337349072222
38352340.55204175045911.4479582495412
39383408.878669662543-25.8786696625430
40439382.60075646812956.3992435318715
41397399.898937695575-2.89893769557475
42453438.89035279405814.1096472059418
43363391.313394516706-28.3133945167058
44365385.406460752212-20.4064607522117
45474407.10332143767666.8966785623235
46373412.351264280516-39.3512642805164
47403354.67601317187948.3239868281212
48384354.78744274185929.2125572581408
49364349.77519553649114.2248044635090
50361334.11543741602926.8845625839714
51419394.68802735798124.3119726420195
52352369.238215306007-17.2382153060072
53363378.895281446381-15.8952814463814
54410412.918089690217-2.91808969021696
55361362.743905102480-1.74390510248044
56383362.18198780283520.8180121971652
57342382.072082359337-40.0720823593368
58369391.611094758463-22.6110947584635
59361342.40505987933918.5949401206607
60317345.866534980105-28.866534980105
61386343.37623216308142.6237678369192
62318329.485599210561-11.4855992105612
63407398.6026873040678.39731269593327
64393373.75513062841419.2448693715856
65404388.83249515567715.1675048443228
66498426.31827181335871.6817281866418
67438378.74131353600659.2586864639942

\begin{tabular}{lllllllll}
\hline
Multiple Linear Regression - Actuals, Interpolation, and Residuals \tabularnewline
Time or Index & Actuals & InterpolationForecast & ResidualsPrediction Error \tabularnewline
1 & 300 & 349.549349770371 & -49.5493497703707 \tabularnewline
2 & 302 & 336.524458921312 & -34.5244589213124 \tabularnewline
3 & 400 & 403.910062807895 & -3.91006280789517 \tabularnewline
4 & 392 & 377.36866288634 & 14.6313371136598 \tabularnewline
5 & 373 & 389.735878220159 & -16.7358782201586 \tabularnewline
6 & 379 & 427.861551215181 & -48.8615512151807 \tabularnewline
7 & 303 & 380.886848314149 & -77.8868483141492 \tabularnewline
8 & 324 & 376.824321639638 & -52.8243216396381 \tabularnewline
9 & 353 & 398.445900403063 & -45.4459004030628 \tabularnewline
10 & 392 & 403.882048051003 & -11.8820480510030 \tabularnewline
11 & 327 & 352.530478393735 & -25.5304783937354 \tabularnewline
12 & 376 & 355.766107728381 & 20.2338922716193 \tabularnewline
13 & 329 & 350.942065328113 & -21.9420653281128 \tabularnewline
14 & 359 & 335.809280661931 & 23.1907193380687 \tabularnewline
15 & 413 & 398.715610187127 & 14.2843898128731 \tabularnewline
16 & 338 & 374.357386004735 & -36.3573860047354 \tabularnewline
17 & 422 & 388.531367467517 & 33.4686325324833 \tabularnewline
18 & 390 & 424.097455113175 & -34.0974551131747 \tabularnewline
19 & 370 & 375.09014031706 & -5.09014031706005 \tabularnewline
20 & 367 & 371.253459408669 & -4.25345940866923 \tabularnewline
21 & 406 & 391.143553965171 & 14.8564460348288 \tabularnewline
22 & 418 & 399.139286962475 & 18.8607130375245 \tabularnewline
23 & 346 & 348.465254603569 & -2.46525460356892 \tabularnewline
24 & 350 & 351.060987600873 & -1.06098760087327 \tabularnewline
25 & 330 & 347.290892109167 & -17.290892109167 \tabularnewline
26 & 318 & 333.513182039708 & -15.5131820397076 \tabularnewline
27 & 382 & 399.204942680388 & -17.2049426803877 \tabularnewline
28 & 337 & 373.679848706374 & -36.6798487063743 \tabularnewline
29 & 372 & 385.106040014691 & -13.1060400146913 \tabularnewline
30 & 422 & 421.914279374011 & 0.0857206259887766 \tabularnewline
31 & 428 & 374.224398213599 & 53.7756017864013 \tabularnewline
32 & 426 & 369.333770396646 & 56.6662296033538 \tabularnewline
33 & 396 & 392.235141834753 & 3.76485816524712 \tabularnewline
34 & 458 & 403.016305947542 & 54.9836940524584 \tabularnewline
35 & 315 & 353.923193951478 & -38.9231939514776 \tabularnewline
36 & 337 & 356.518926948782 & -19.5189269487819 \tabularnewline
37 & 386 & 354.066265092778 & 31.9337349072222 \tabularnewline
38 & 352 & 340.552041750459 & 11.4479582495412 \tabularnewline
39 & 383 & 408.878669662543 & -25.8786696625430 \tabularnewline
40 & 439 & 382.600756468129 & 56.3992435318715 \tabularnewline
41 & 397 & 399.898937695575 & -2.89893769557475 \tabularnewline
42 & 453 & 438.890352794058 & 14.1096472059418 \tabularnewline
43 & 363 & 391.313394516706 & -28.3133945167058 \tabularnewline
44 & 365 & 385.406460752212 & -20.4064607522117 \tabularnewline
45 & 474 & 407.103321437676 & 66.8966785623235 \tabularnewline
46 & 373 & 412.351264280516 & -39.3512642805164 \tabularnewline
47 & 403 & 354.676013171879 & 48.3239868281212 \tabularnewline
48 & 384 & 354.787442741859 & 29.2125572581408 \tabularnewline
49 & 364 & 349.775195536491 & 14.2248044635090 \tabularnewline
50 & 361 & 334.115437416029 & 26.8845625839714 \tabularnewline
51 & 419 & 394.688027357981 & 24.3119726420195 \tabularnewline
52 & 352 & 369.238215306007 & -17.2382153060072 \tabularnewline
53 & 363 & 378.895281446381 & -15.8952814463814 \tabularnewline
54 & 410 & 412.918089690217 & -2.91808969021696 \tabularnewline
55 & 361 & 362.743905102480 & -1.74390510248044 \tabularnewline
56 & 383 & 362.181987802835 & 20.8180121971652 \tabularnewline
57 & 342 & 382.072082359337 & -40.0720823593368 \tabularnewline
58 & 369 & 391.611094758463 & -22.6110947584635 \tabularnewline
59 & 361 & 342.405059879339 & 18.5949401206607 \tabularnewline
60 & 317 & 345.866534980105 & -28.866534980105 \tabularnewline
61 & 386 & 343.376232163081 & 42.6237678369192 \tabularnewline
62 & 318 & 329.485599210561 & -11.4855992105612 \tabularnewline
63 & 407 & 398.602687304067 & 8.39731269593327 \tabularnewline
64 & 393 & 373.755130628414 & 19.2448693715856 \tabularnewline
65 & 404 & 388.832495155677 & 15.1675048443228 \tabularnewline
66 & 498 & 426.318271813358 & 71.6817281866418 \tabularnewline
67 & 438 & 378.741313536006 & 59.2586864639942 \tabularnewline
\hline
\end{tabular}
%Source: https://freestatistics.org/blog/index.php?pk=110871&T=4

[TABLE]
[ROW][C]Multiple Linear Regression - Actuals, Interpolation, and Residuals[/C][/ROW]
[ROW][C]Time or Index[/C][C]Actuals[/C][C]InterpolationForecast[/C][C]ResidualsPrediction Error[/C][/ROW]
[ROW][C]1[/C][C]300[/C][C]349.549349770371[/C][C]-49.5493497703707[/C][/ROW]
[ROW][C]2[/C][C]302[/C][C]336.524458921312[/C][C]-34.5244589213124[/C][/ROW]
[ROW][C]3[/C][C]400[/C][C]403.910062807895[/C][C]-3.91006280789517[/C][/ROW]
[ROW][C]4[/C][C]392[/C][C]377.36866288634[/C][C]14.6313371136598[/C][/ROW]
[ROW][C]5[/C][C]373[/C][C]389.735878220159[/C][C]-16.7358782201586[/C][/ROW]
[ROW][C]6[/C][C]379[/C][C]427.861551215181[/C][C]-48.8615512151807[/C][/ROW]
[ROW][C]7[/C][C]303[/C][C]380.886848314149[/C][C]-77.8868483141492[/C][/ROW]
[ROW][C]8[/C][C]324[/C][C]376.824321639638[/C][C]-52.8243216396381[/C][/ROW]
[ROW][C]9[/C][C]353[/C][C]398.445900403063[/C][C]-45.4459004030628[/C][/ROW]
[ROW][C]10[/C][C]392[/C][C]403.882048051003[/C][C]-11.8820480510030[/C][/ROW]
[ROW][C]11[/C][C]327[/C][C]352.530478393735[/C][C]-25.5304783937354[/C][/ROW]
[ROW][C]12[/C][C]376[/C][C]355.766107728381[/C][C]20.2338922716193[/C][/ROW]
[ROW][C]13[/C][C]329[/C][C]350.942065328113[/C][C]-21.9420653281128[/C][/ROW]
[ROW][C]14[/C][C]359[/C][C]335.809280661931[/C][C]23.1907193380687[/C][/ROW]
[ROW][C]15[/C][C]413[/C][C]398.715610187127[/C][C]14.2843898128731[/C][/ROW]
[ROW][C]16[/C][C]338[/C][C]374.357386004735[/C][C]-36.3573860047354[/C][/ROW]
[ROW][C]17[/C][C]422[/C][C]388.531367467517[/C][C]33.4686325324833[/C][/ROW]
[ROW][C]18[/C][C]390[/C][C]424.097455113175[/C][C]-34.0974551131747[/C][/ROW]
[ROW][C]19[/C][C]370[/C][C]375.09014031706[/C][C]-5.09014031706005[/C][/ROW]
[ROW][C]20[/C][C]367[/C][C]371.253459408669[/C][C]-4.25345940866923[/C][/ROW]
[ROW][C]21[/C][C]406[/C][C]391.143553965171[/C][C]14.8564460348288[/C][/ROW]
[ROW][C]22[/C][C]418[/C][C]399.139286962475[/C][C]18.8607130375245[/C][/ROW]
[ROW][C]23[/C][C]346[/C][C]348.465254603569[/C][C]-2.46525460356892[/C][/ROW]
[ROW][C]24[/C][C]350[/C][C]351.060987600873[/C][C]-1.06098760087327[/C][/ROW]
[ROW][C]25[/C][C]330[/C][C]347.290892109167[/C][C]-17.290892109167[/C][/ROW]
[ROW][C]26[/C][C]318[/C][C]333.513182039708[/C][C]-15.5131820397076[/C][/ROW]
[ROW][C]27[/C][C]382[/C][C]399.204942680388[/C][C]-17.2049426803877[/C][/ROW]
[ROW][C]28[/C][C]337[/C][C]373.679848706374[/C][C]-36.6798487063743[/C][/ROW]
[ROW][C]29[/C][C]372[/C][C]385.106040014691[/C][C]-13.1060400146913[/C][/ROW]
[ROW][C]30[/C][C]422[/C][C]421.914279374011[/C][C]0.0857206259887766[/C][/ROW]
[ROW][C]31[/C][C]428[/C][C]374.224398213599[/C][C]53.7756017864013[/C][/ROW]
[ROW][C]32[/C][C]426[/C][C]369.333770396646[/C][C]56.6662296033538[/C][/ROW]
[ROW][C]33[/C][C]396[/C][C]392.235141834753[/C][C]3.76485816524712[/C][/ROW]
[ROW][C]34[/C][C]458[/C][C]403.016305947542[/C][C]54.9836940524584[/C][/ROW]
[ROW][C]35[/C][C]315[/C][C]353.923193951478[/C][C]-38.9231939514776[/C][/ROW]
[ROW][C]36[/C][C]337[/C][C]356.518926948782[/C][C]-19.5189269487819[/C][/ROW]
[ROW][C]37[/C][C]386[/C][C]354.066265092778[/C][C]31.9337349072222[/C][/ROW]
[ROW][C]38[/C][C]352[/C][C]340.552041750459[/C][C]11.4479582495412[/C][/ROW]
[ROW][C]39[/C][C]383[/C][C]408.878669662543[/C][C]-25.8786696625430[/C][/ROW]
[ROW][C]40[/C][C]439[/C][C]382.600756468129[/C][C]56.3992435318715[/C][/ROW]
[ROW][C]41[/C][C]397[/C][C]399.898937695575[/C][C]-2.89893769557475[/C][/ROW]
[ROW][C]42[/C][C]453[/C][C]438.890352794058[/C][C]14.1096472059418[/C][/ROW]
[ROW][C]43[/C][C]363[/C][C]391.313394516706[/C][C]-28.3133945167058[/C][/ROW]
[ROW][C]44[/C][C]365[/C][C]385.406460752212[/C][C]-20.4064607522117[/C][/ROW]
[ROW][C]45[/C][C]474[/C][C]407.103321437676[/C][C]66.8966785623235[/C][/ROW]
[ROW][C]46[/C][C]373[/C][C]412.351264280516[/C][C]-39.3512642805164[/C][/ROW]
[ROW][C]47[/C][C]403[/C][C]354.676013171879[/C][C]48.3239868281212[/C][/ROW]
[ROW][C]48[/C][C]384[/C][C]354.787442741859[/C][C]29.2125572581408[/C][/ROW]
[ROW][C]49[/C][C]364[/C][C]349.775195536491[/C][C]14.2248044635090[/C][/ROW]
[ROW][C]50[/C][C]361[/C][C]334.115437416029[/C][C]26.8845625839714[/C][/ROW]
[ROW][C]51[/C][C]419[/C][C]394.688027357981[/C][C]24.3119726420195[/C][/ROW]
[ROW][C]52[/C][C]352[/C][C]369.238215306007[/C][C]-17.2382153060072[/C][/ROW]
[ROW][C]53[/C][C]363[/C][C]378.895281446381[/C][C]-15.8952814463814[/C][/ROW]
[ROW][C]54[/C][C]410[/C][C]412.918089690217[/C][C]-2.91808969021696[/C][/ROW]
[ROW][C]55[/C][C]361[/C][C]362.743905102480[/C][C]-1.74390510248044[/C][/ROW]
[ROW][C]56[/C][C]383[/C][C]362.181987802835[/C][C]20.8180121971652[/C][/ROW]
[ROW][C]57[/C][C]342[/C][C]382.072082359337[/C][C]-40.0720823593368[/C][/ROW]
[ROW][C]58[/C][C]369[/C][C]391.611094758463[/C][C]-22.6110947584635[/C][/ROW]
[ROW][C]59[/C][C]361[/C][C]342.405059879339[/C][C]18.5949401206607[/C][/ROW]
[ROW][C]60[/C][C]317[/C][C]345.866534980105[/C][C]-28.866534980105[/C][/ROW]
[ROW][C]61[/C][C]386[/C][C]343.376232163081[/C][C]42.6237678369192[/C][/ROW]
[ROW][C]62[/C][C]318[/C][C]329.485599210561[/C][C]-11.4855992105612[/C][/ROW]
[ROW][C]63[/C][C]407[/C][C]398.602687304067[/C][C]8.39731269593327[/C][/ROW]
[ROW][C]64[/C][C]393[/C][C]373.755130628414[/C][C]19.2448693715856[/C][/ROW]
[ROW][C]65[/C][C]404[/C][C]388.832495155677[/C][C]15.1675048443228[/C][/ROW]
[ROW][C]66[/C][C]498[/C][C]426.318271813358[/C][C]71.6817281866418[/C][/ROW]
[ROW][C]67[/C][C]438[/C][C]378.741313536006[/C][C]59.2586864639942[/C][/ROW]
[/TABLE]
Source: https://freestatistics.org/blog/index.php?pk=110871&T=4

Globally Unique Identifier (entire table): ba.freestatistics.org/blog/index.php?pk=110871&T=4

As an alternative you can also use a QR Code:  

The GUIDs for individual cells are displayed in the table below:

Multiple Linear Regression - Actuals, Interpolation, and Residuals
Time or IndexActualsInterpolationForecastResidualsPrediction Error
1300349.549349770371-49.5493497703707
2302336.524458921312-34.5244589213124
3400403.910062807895-3.91006280789517
4392377.3686628863414.6313371136598
5373389.735878220159-16.7358782201586
6379427.861551215181-48.8615512151807
7303380.886848314149-77.8868483141492
8324376.824321639638-52.8243216396381
9353398.445900403063-45.4459004030628
10392403.882048051003-11.8820480510030
11327352.530478393735-25.5304783937354
12376355.76610772838120.2338922716193
13329350.942065328113-21.9420653281128
14359335.80928066193123.1907193380687
15413398.71561018712714.2843898128731
16338374.357386004735-36.3573860047354
17422388.53136746751733.4686325324833
18390424.097455113175-34.0974551131747
19370375.09014031706-5.09014031706005
20367371.253459408669-4.25345940866923
21406391.14355396517114.8564460348288
22418399.13928696247518.8607130375245
23346348.465254603569-2.46525460356892
24350351.060987600873-1.06098760087327
25330347.290892109167-17.290892109167
26318333.513182039708-15.5131820397076
27382399.204942680388-17.2049426803877
28337373.679848706374-36.6798487063743
29372385.106040014691-13.1060400146913
30422421.9142793740110.0857206259887766
31428374.22439821359953.7756017864013
32426369.33377039664656.6662296033538
33396392.2351418347533.76485816524712
34458403.01630594754254.9836940524584
35315353.923193951478-38.9231939514776
36337356.518926948782-19.5189269487819
37386354.06626509277831.9337349072222
38352340.55204175045911.4479582495412
39383408.878669662543-25.8786696625430
40439382.60075646812956.3992435318715
41397399.898937695575-2.89893769557475
42453438.89035279405814.1096472059418
43363391.313394516706-28.3133945167058
44365385.406460752212-20.4064607522117
45474407.10332143767666.8966785623235
46373412.351264280516-39.3512642805164
47403354.67601317187948.3239868281212
48384354.78744274185929.2125572581408
49364349.77519553649114.2248044635090
50361334.11543741602926.8845625839714
51419394.68802735798124.3119726420195
52352369.238215306007-17.2382153060072
53363378.895281446381-15.8952814463814
54410412.918089690217-2.91808969021696
55361362.743905102480-1.74390510248044
56383362.18198780283520.8180121971652
57342382.072082359337-40.0720823593368
58369391.611094758463-22.6110947584635
59361342.40505987933918.5949401206607
60317345.866534980105-28.866534980105
61386343.37623216308142.6237678369192
62318329.485599210561-11.4855992105612
63407398.6026873040678.39731269593327
64393373.75513062841419.2448693715856
65404388.83249515567715.1675048443228
66498426.31827181335871.6817281866418
67438378.74131353600659.2586864639942


Parameters (Session):
par1 = 1 ; par2 = Include Monthly Dummies ; par3 = No Linear Trend ;
Parameters (R input):
par1 = 1 ; par2 = Include Monthly Dummies ; par3 = No Linear Trend ;
R code (references can be found in the software module):
library(lattice)
par1 <- as.numeric(par1)
x <- t(y)
k <- length(x[1,])
n <- length(x[,1])
x1 <- cbind(x[,par1], x[,1:k!=par1])
mycolnames <- c(colnames(x)[par1], colnames(x)[1:k!=par1])
colnames(x1) <- mycolnames #colnames(x)[par1]
x <- x1
if (par3 == 'First Differences'){
x2 <- array(0, dim=c(n-1,k), dimnames=list(1:(n-1), paste('(1-B)',colnames(x),sep='')))
for (i in 1:n-1) {
for (j in 1:k) {
x2[i,j] <- x[i+1,j] - x[i,j]
}
}
x <- x2
}
if (par2 == 'Include Monthly Dummies'){
x2 <- array(0, dim=c(n,11), dimnames=list(1:n, paste('M', seq(1:11), sep ='')))
for (i in 1:11){
x2[seq(i,n,12),i] <- 1
}
x <- cbind(x, x2)
}
if (par2 == 'Include Quarterly Dummies'){
x2 <- array(0, dim=c(n,3), dimnames=list(1:n, paste('Q', seq(1:3), sep ='')))
for (i in 1:3){
x2[seq(i,n,4),i] <- 1
}
x <- cbind(x, x2)
}
k <- length(x[1,])
if (par3 == 'Linear Trend'){
x <- cbind(x, c(1:n))
colnames(x)[k+1] <- 't'
}
x
k <- length(x[1,])
df <- as.data.frame(x)
(mylm <- lm(df))
(mysum <- summary(mylm))
bitmap(file='test0.png')
plot(x[,1], type='l', main='Actuals and Interpolation', ylab='value of Actuals and Interpolation (dots)', xlab='time or index')
points(x[,1]-mysum$resid)
grid()
dev.off()
bitmap(file='test1.png')
plot(mysum$resid, type='b', pch=19, main='Residuals', ylab='value of Residuals', xlab='time or index')
grid()
dev.off()
bitmap(file='test2.png')
hist(mysum$resid, main='Residual Histogram', xlab='values of Residuals')
grid()
dev.off()
bitmap(file='test3.png')
densityplot(~mysum$resid,col='black',main='Residual Density Plot', xlab='values of Residuals')
dev.off()
bitmap(file='test4.png')
qqnorm(mysum$resid, main='Residual Normal Q-Q Plot')
grid()
dev.off()
(myerror <- as.ts(mysum$resid))
bitmap(file='test5.png')
dum <- cbind(lag(myerror,k=1),myerror)
dum
dum1 <- dum[2:length(myerror),]
dum1
z <- as.data.frame(dum1)
z
plot(z,main=paste('Residual Lag plot, lowess, and regression line'), ylab='values of Residuals', xlab='lagged values of Residuals')
lines(lowess(z))
abline(lm(z))
grid()
dev.off()
bitmap(file='test6.png')
acf(mysum$resid, lag.max=length(mysum$resid)/2, main='Residual Autocorrelation Function')
grid()
dev.off()
bitmap(file='test7.png')
pacf(mysum$resid, lag.max=length(mysum$resid)/2, main='Residual Partial Autocorrelation Function')
grid()
dev.off()
bitmap(file='test8.png')
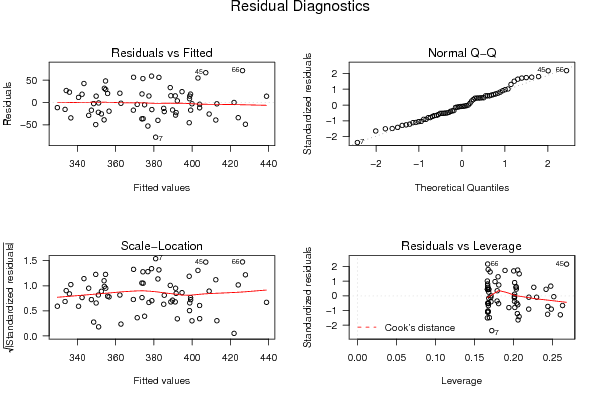
opar <- par(mfrow = c(2,2), oma = c(0, 0, 1.1, 0))
plot(mylm, las = 1, sub='Residual Diagnostics')
par(opar)
dev.off()
load(file='createtable')
a<-table.start()
a<-table.row.start(a)
a<-table.element(a, 'Multiple Linear Regression - Estimated Regression Equation', 1, TRUE)
a<-table.row.end(a)
myeq <- colnames(x)[1]
myeq <- paste(myeq, '[t] = ', sep='')
for (i in 1:k){
if (mysum$coefficients[i,1] > 0) myeq <- paste(myeq, '+', '')
myeq <- paste(myeq, mysum$coefficients[i,1], sep=' ')
if (rownames(mysum$coefficients)[i] != '(Intercept)') {
myeq <- paste(myeq, rownames(mysum$coefficients)[i], sep='')
if (rownames(mysum$coefficients)[i] != 't') myeq <- paste(myeq, '[t]', sep='')
}
}
myeq <- paste(myeq, ' + e[t]')
a<-table.row.start(a)
a<-table.element(a, myeq)
a<-table.row.end(a)
a<-table.end(a)
table.save(a,file='mytable1.tab')
a<-table.start()
a<-table.row.start(a)
a<-table.element(a,hyperlink('ols1.htm','Multiple Linear Regression - Ordinary Least Squares',''), 6, TRUE)
a<-table.row.end(a)
a<-table.row.start(a)
a<-table.element(a,'Variable',header=TRUE)
a<-table.element(a,'Parameter',header=TRUE)
a<-table.element(a,'S.D.',header=TRUE)
a<-table.element(a,'T-STAT
H0: parameter = 0',header=TRUE)
a<-table.element(a,'2-tail p-value',header=TRUE)
a<-table.element(a,'1-tail p-value',header=TRUE)
a<-table.row.end(a)
for (i in 1:k){
a<-table.row.start(a)
a<-table.element(a,rownames(mysum$coefficients)[i],header=TRUE)
a<-table.element(a,mysum$coefficients[i,1])
a<-table.element(a, round(mysum$coefficients[i,2],6))
a<-table.element(a, round(mysum$coefficients[i,3],4))
a<-table.element(a, round(mysum$coefficients[i,4],6))
a<-table.element(a, round(mysum$coefficients[i,4]/2,6))
a<-table.row.end(a)
}
a<-table.end(a)
table.save(a,file='mytable2.tab')
a<-table.start()
a<-table.row.start(a)
a<-table.element(a, 'Multiple Linear Regression - Regression Statistics', 2, TRUE)
a<-table.row.end(a)
a<-table.row.start(a)
a<-table.element(a, 'Multiple R',1,TRUE)
a<-table.element(a, sqrt(mysum$r.squared))
a<-table.row.end(a)
a<-table.row.start(a)
a<-table.element(a, 'R-squared',1,TRUE)
a<-table.element(a, mysum$r.squared)
a<-table.row.end(a)
a<-table.row.start(a)
a<-table.element(a, 'Adjusted R-squared',1,TRUE)
a<-table.element(a, mysum$adj.r.squared)
a<-table.row.end(a)
a<-table.row.start(a)
a<-table.element(a, 'F-TEST (value)',1,TRUE)
a<-table.element(a, mysum$fstatistic[1])
a<-table.row.end(a)
a<-table.row.start(a)
a<-table.element(a, 'F-TEST (DF numerator)',1,TRUE)
a<-table.element(a, mysum$fstatistic[2])
a<-table.row.end(a)
a<-table.row.start(a)
a<-table.element(a, 'F-TEST (DF denominator)',1,TRUE)
a<-table.element(a, mysum$fstatistic[3])
a<-table.row.end(a)
a<-table.row.start(a)
a<-table.element(a, 'p-value',1,TRUE)
a<-table.element(a, 1-pf(mysum$fstatistic[1],mysum$fstatistic[2],mysum$fstatistic[3]))
a<-table.row.end(a)
a<-table.row.start(a)
a<-table.element(a, 'Multiple Linear Regression - Residual Statistics', 2, TRUE)
a<-table.row.end(a)
a<-table.row.start(a)
a<-table.element(a, 'Residual Standard Deviation',1,TRUE)
a<-table.element(a, mysum$sigma)
a<-table.row.end(a)
a<-table.row.start(a)
a<-table.element(a, 'Sum Squared Residuals',1,TRUE)
a<-table.element(a, sum(myerror*myerror))
a<-table.row.end(a)
a<-table.end(a)
table.save(a,file='mytable3.tab')
a<-table.start()
a<-table.row.start(a)
a<-table.element(a, 'Multiple Linear Regression - Actuals, Interpolation, and Residuals', 4, TRUE)
a<-table.row.end(a)
a<-table.row.start(a)
a<-table.element(a, 'Time or Index', 1, TRUE)
a<-table.element(a, 'Actuals', 1, TRUE)
a<-table.element(a, 'Interpolation
Forecast', 1, TRUE)
a<-table.element(a, 'Residuals
Prediction Error', 1, TRUE)
a<-table.row.end(a)
for (i in 1:n) {
a<-table.row.start(a)
a<-table.element(a,i, 1, TRUE)
a<-table.element(a,x[i])
a<-table.element(a,x[i]-mysum$resid[i])
a<-table.element(a,mysum$resid[i])
a<-table.row.end(a)
}
a<-table.end(a)
table.save(a,file='mytable4.tab')