| Multiple Linear Regression - Estimated Regression Equation |
| Totaal[t] = + 32.2475215807633 + 2.471430053128Crisis[t] + 1.24026784409011`t-1`[t] -0.575426130628861`t-2`[t] + 0.110311812189182`t-3`[t] + 0.164208502243871`t-4 `[t] + e[t] |
| Multiple Linear Regression - Ordinary Least Squares | |||||
| Variable | Parameter | S.D. | T-STAT H0: parameter = 0 | 2-tail p-value | 1-tail p-value |
| (Intercept) | 32.2475215807633 | 63.634431 | 0.5068 | 0.614549 | 0.307275 |
| Crisis | 2.471430053128 | 8.193368 | 0.3016 | 0.764179 | 0.38209 |
| `t-1` | 1.24026784409011 | 0.14149 | 8.7657 | 0 | 0 |
| `t-2` | -0.575426130628861 | 0.225687 | -2.5497 | 0.013895 | 0.006948 |
| `t-3` | 0.110311812189182 | 0.226094 | 0.4879 | 0.627752 | 0.313876 |
| `t-4 ` | 0.164208502243871 | 0.157658 | 1.0416 | 0.302631 | 0.151315 |
| Multiple Linear Regression - Regression Statistics | |
| Multiple R | 0.913098051345784 |
| R-squared | 0.833748051371467 |
| Adjusted R-squared | 0.817122856508614 |
| F-TEST (value) | 50.1496709211128 |
| F-TEST (DF numerator) | 5 |
| F-TEST (DF denominator) | 50 |
| p-value | 0 |
| Multiple Linear Regression - Residual Statistics | |
| Residual Standard Deviation | 17.6529714939156 |
| Sum Squared Residuals | 15581.3701282499 |
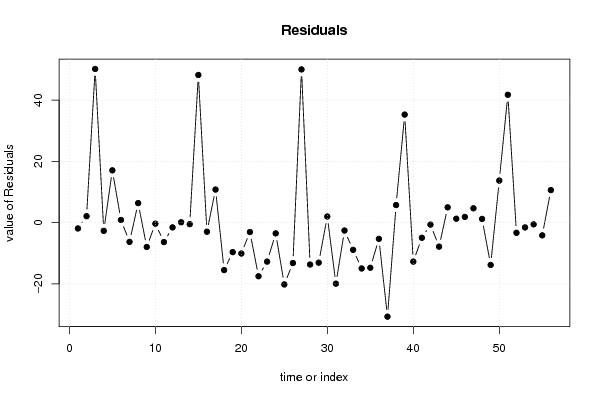
| Multiple Linear Regression - Actuals, Interpolation, and Residuals | |||
| Time or Index | Actuals | Interpolation Forecast | Residuals Prediction Error |
| 1 | 567 | 568.893018162697 | -1.89301816269679 |
| 2 | 569 | 566.90112246964 | 2.0988775303598 |
| 3 | 621 | 570.799742496293 | 50.2002575037068 |
| 4 | 629 | 631.674653729904 | -2.67465372990351 |
| 5 | 628 | 610.910010300839 | 17.0899896991613 |
| 6 | 612 | 611.130964650043 | 0.869035349957042 |
| 7 | 595 | 601.283441889425 | -6.28344188942481 |
| 8 | 597 | 590.609062835716 | 6.3909371642835 |
| 9 | 593 | 600.942645247317 | -7.94264524731659 |
| 10 | 590 | 590.32808476658 | -0.328084766580404 |
| 11 | 580 | 586.338064843058 | -6.33806484305808 |
| 12 | 574 | 575.548834549775 | -1.54883454977458 |
| 13 | 573 | 572.87371934598 | 0.126280654020495 |
| 14 | 573 | 573.490264657039 | -0.490264657039133 |
| 15 | 620 | 571.761734892094 | 48.2382651079058 |
| 16 | 626 | 628.958760738677 | -2.95876073867692 |
| 17 | 620 | 609.191131161417 | 10.8088688385828 |
| 18 | 588 | 603.481622485995 | -15.481622485995 |
| 19 | 566 | 575.625278737482 | -9.62527873748165 |
| 20 | 557 | 567.076402487951 | -10.0764024879509 |
| 21 | 561 | 564.058137761458 | -3.05813776145785 |
| 22 | 549 | 566.516512373512 | -17.5165123735122 |
| 23 | 532 | 544.726200362848 | -12.7262003628476 |
| 24 | 526 | 529.510131309424 | -3.51013130942398 |
| 25 | 511 | 531.183860728279 | -20.1838607282793 |
| 26 | 499 | 512.186597016558 | -13.1865970165583 |
| 27 | 555 | 504.952789488757 | 50.047210511243 |
| 28 | 565 | 578.672974129048 | -13.6729741290485 |
| 29 | 542 | 555.064919974805 | -13.0649199748051 |
| 30 | 527 | 524.991457710112 | 2.00854228988831 |
| 31 | 510 | 529.921035300772 | -19.9210353007724 |
| 32 | 514 | 516.572787252761 | -2.57278725276102 |
| 33 | 517 | 525.884630115365 | -8.88463011536535 |
| 34 | 508 | 522.965300784246 | -14.9653007842461 |
| 35 | 493 | 507.726314506159 | -14.7263145061594 |
| 36 | 490 | 495.28890146601 | -5.28890146601057 |
| 37 | 469 | 499.699309090202 | -30.6993090902021 |
| 38 | 478 | 472.247409053164 | 5.75259094683614 |
| 39 | 528 | 492.699705422955 | 35.3002945770447 |
| 40 | 534 | 546.725088889097 | -12.7250888890966 |
| 41 | 518 | 522.939817184776 | -4.93981718477555 |
| 42 | 506 | 506.636442025215 | -0.636442025214569 |
| 43 | 502 | 509.832341971524 | -7.83234197152367 |
| 44 | 516 | 510.996646181146 | 5.00335381885412 |
| 45 | 528 | 526.711022738751 | 1.28897726124926 |
| 46 | 533 | 531.126521763345 | 1.87347823665518 |
| 47 | 536 | 531.310278777922 | 4.68972122207791 |
| 48 | 537 | 535.776612434732 | 1.22338756526751 |
| 49 | 524 | 537.812662974808 | -13.8126629748084 |
| 50 | 536 | 522.265732818795 | 13.734267181205 |
| 51 | 587 | 545.232423964972 | 41.7675760350277 |
| 52 | 597 | 600.311125389806 | -3.31112538980605 |
| 53 | 581 | 582.556102385735 | -1.55610238573508 |
| 54 | 564 | 564.553960022579 | -0.553960022579444 |
| 55 | 558 | 562.153976499439 | -4.15397649943859 |
| 56 | 575 | 564.371709683 | 10.6282903169996 |
| Goldfeld-Quandt test for Heteroskedasticity | |||
| p-values | Alternative Hypothesis | ||
| breakpoint index | greater | 2-sided | less |
| 9 | 0.843380330089453 | 0.313239339821094 | 0.156619669910547 |
| 10 | 0.742510584132716 | 0.514978831734569 | 0.257489415867284 |
| 11 | 0.670026958897208 | 0.659946082205585 | 0.329973041102792 |
| 12 | 0.58205050513569 | 0.83589898972862 | 0.41794949486431 |
| 13 | 0.480519160663438 | 0.961038321326876 | 0.519480839336562 |
| 14 | 0.395260364816793 | 0.790520729633585 | 0.604739635183207 |
| 15 | 0.764030387903213 | 0.471939224193574 | 0.235969612096787 |
| 16 | 0.683768982113144 | 0.632462035773712 | 0.316231017886856 |
| 17 | 0.661134283120269 | 0.677731433759462 | 0.338865716879731 |
| 18 | 0.598728111997252 | 0.802543776005496 | 0.401271888002748 |
| 19 | 0.514736974996103 | 0.970526050007795 | 0.485263025003897 |
| 20 | 0.430662058950461 | 0.861324117900921 | 0.569337941049539 |
| 21 | 0.379656641943258 | 0.759313283886515 | 0.620343358056742 |
| 22 | 0.508384962650747 | 0.983230074698507 | 0.491615037349253 |
| 23 | 0.569186461556741 | 0.861627076886519 | 0.430813538443259 |
| 24 | 0.504218229977749 | 0.991563540044503 | 0.495781770022251 |
| 25 | 0.490881301408404 | 0.981762602816808 | 0.509118698591596 |
| 26 | 0.426904552914399 | 0.853809105828798 | 0.573095447085601 |
| 27 | 0.652630134027086 | 0.694739731945828 | 0.347369865972914 |
| 28 | 0.815235580465246 | 0.369528839069507 | 0.184764419534754 |
| 29 | 0.85336295717379 | 0.29327408565242 | 0.14663704282621 |
| 30 | 0.79889772564121 | 0.40220454871758 | 0.20110227435879 |
| 31 | 0.829391505245878 | 0.341216989508244 | 0.170608494754122 |
| 32 | 0.767775198227583 | 0.464449603544834 | 0.232224801772417 |
| 33 | 0.717896126558512 | 0.564207746882975 | 0.282103873441488 |
| 34 | 0.680622815845007 | 0.638754368309986 | 0.319377184154993 |
| 35 | 0.644593100341592 | 0.710813799316815 | 0.355406899658408 |
| 36 | 0.567922931594012 | 0.864154136811977 | 0.432077068405988 |
| 37 | 0.808665879554268 | 0.382668240891464 | 0.191334120445732 |
| 38 | 0.74149869819205 | 0.517002603615902 | 0.258501301807951 |
| 39 | 0.866310067568606 | 0.267379864862788 | 0.133689932431394 |
| 40 | 0.853471386035212 | 0.293057227929577 | 0.146528613964788 |
| 41 | 0.780816202366163 | 0.438367595267675 | 0.219183797633837 |
| 42 | 0.685897236830184 | 0.628205526339631 | 0.314102763169816 |
| 43 | 0.652613985725667 | 0.694772028548666 | 0.347386014274333 |
| 44 | 0.53838588534046 | 0.92322822931908 | 0.46161411465954 |
| 45 | 0.435491360428084 | 0.870982720856167 | 0.564508639571916 |
| 46 | 0.30720964894744 | 0.614419297894881 | 0.69279035105256 |
| 47 | 0.185040696864322 | 0.370081393728645 | 0.814959303135678 |
| Meta Analysis of Goldfeld-Quandt test for Heteroskedasticity | |||
| Description | # significant tests | % significant tests | OK/NOK |
| 1% type I error level | 0 | 0 | OK |
| 5% type I error level | 0 | 0 | OK |
| 10% type I error level | 0 | 0 | OK |