| Multiple Linear Regression - Estimated Regression Equation |
| HPC[t] = + 131.905882352941 -0.54803921568628M1[t] -6.36274509803925M2[t] -10.7264705882353M3[t] -13.0901960784314M4[t] -19.0539215686275M5[t] -17.2176470588236M6[t] + 14.4186274509804M7[t] + 20.8549019607843M8[t] + 18.8911764705882M9[t] + 8.72745098039215M10[t] + 1.16372549019607M11[t] -0.436274509803922t + e[t] |
| Multiple Linear Regression - Ordinary Least Squares | |||||
| Variable | Parameter | S.D. | T-STAT H0: parameter = 0 | 2-tail p-value | 1-tail p-value |
| (Intercept) | 131.905882352941 | 4.840685 | 27.2494 | 0 | 0 |
| M1 | -0.54803921568628 | 5.645378 | -0.0971 | 0.923069 | 0.461535 |
| M2 | -6.36274509803925 | 5.925421 | -1.0738 | 0.288279 | 0.144139 |
| M3 | -10.7264705882353 | 5.917854 | -1.8126 | 0.076156 | 0.038078 |
| M4 | -13.0901960784314 | 5.911076 | -2.2145 | 0.031575 | 0.015787 |
| M5 | -19.0539215686275 | 5.905088 | -3.2267 | 0.002258 | 0.001129 |
| M6 | -17.2176470588236 | 5.899894 | -2.9183 | 0.005342 | 0.002671 |
| M7 | 14.4186274509804 | 5.895496 | 2.4457 | 0.018174 | 0.009087 |
| M8 | 20.8549019607843 | 5.891894 | 3.5396 | 0.000902 | 0.000451 |
| M9 | 18.8911764705882 | 5.889092 | 3.2078 | 0.002383 | 0.001192 |
| M10 | 8.72745098039215 | 5.887089 | 1.4825 | 0.144751 | 0.072375 |
| M11 | 1.16372549019607 | 5.885887 | 0.1977 | 0.844103 | 0.422052 |
| t | -0.436274509803922 | 0.068678 | -6.3525 | 0 | 0 |
| Multiple Linear Regression - Regression Statistics | |
| Multiple R | 0.868715394112654 |
| R-squared | 0.754666435968303 |
| Adjusted R-squared | 0.693333044960379 |
| F-TEST (value) | 12.3043324943635 |
| F-TEST (DF numerator) | 12 |
| F-TEST (DF denominator) | 48 |
| p-value | 7.01978475348142e-11 |
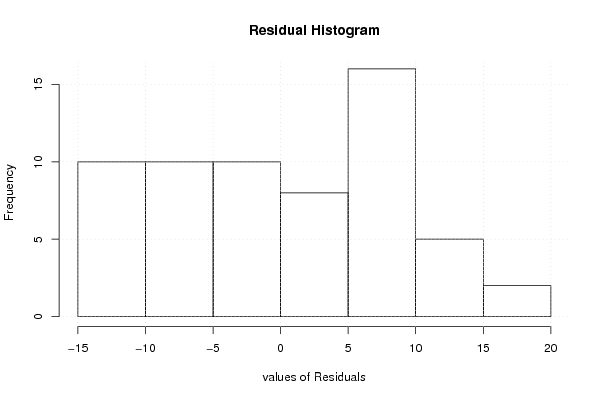
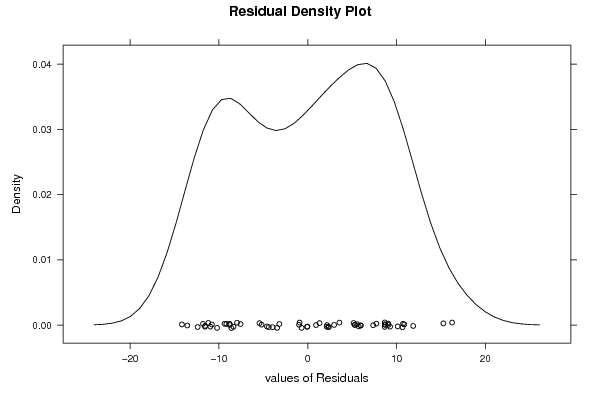
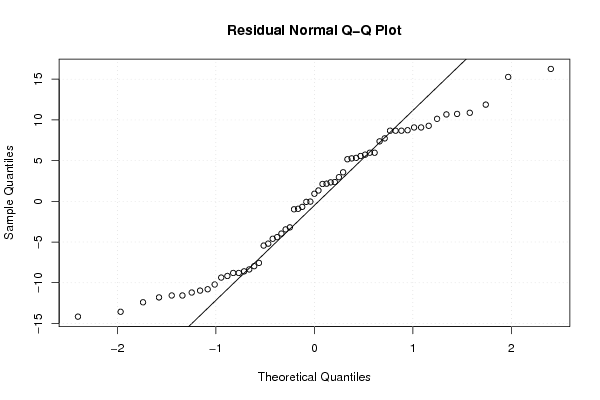
| Multiple Linear Regression - Residual Statistics | |
| Residual Standard Deviation | 9.3057716295273 |
| Sum Squared Residuals | 4156.67450980392 |
| Multiple Linear Regression - Actuals, Interpolation, and Residuals | |||
| Time or Index | Actuals | Interpolation Forecast | Residuals Prediction Error |
| 1 | 130 | 130.921568627451 | -0.921568627450961 |
| 2 | 127 | 124.670588235294 | 2.32941176470585 |
| 3 | 122 | 119.870588235294 | 2.12941176470588 |
| 4 | 117 | 117.070588235294 | -0.0705882352940977 |
| 5 | 112 | 110.670588235294 | 1.32941176470590 |
| 6 | 113 | 112.070588235294 | 0.929411764705907 |
| 7 | 149 | 143.270588235294 | 5.7294117647059 |
| 8 | 157 | 149.270588235294 | 7.7294117647059 |
| 9 | 157 | 146.870588235294 | 10.1294117647059 |
| 10 | 147 | 136.270588235294 | 10.7294117647059 |
| 11 | 137 | 128.270588235294 | 8.72941176470587 |
| 12 | 132 | 126.670588235294 | 5.32941176470587 |
| 13 | 125 | 125.686274509804 | -0.686274509803949 |
| 14 | 123 | 119.435294117647 | 3.56470588235295 |
| 15 | 117 | 114.635294117647 | 2.36470588235294 |
| 16 | 114 | 111.835294117647 | 2.16470588235293 |
| 17 | 111 | 105.435294117647 | 5.56470588235293 |
| 18 | 112 | 106.835294117647 | 5.16470588235293 |
| 19 | 144 | 138.035294117647 | 5.96470588235293 |
| 20 | 150 | 144.035294117647 | 5.96470588235294 |
| 21 | 149 | 141.635294117647 | 7.36470588235293 |
| 22 | 134 | 131.035294117647 | 2.96470588235294 |
| 23 | 123 | 123.035294117647 | -0.0352941176470617 |
| 24 | 116 | 121.435294117647 | -5.43529411764707 |
| 25 | 117 | 120.450980392157 | -3.45098039215686 |
| 26 | 111 | 114.2 | -3.19999999999999 |
| 27 | 105 | 109.4 | -4.4 |
| 28 | 102 | 106.6 | -4.60000000000001 |
| 29 | 95 | 100.2 | -5.20000000000001 |
| 30 | 93 | 101.6 | -8.60000000000001 |
| 31 | 124 | 132.8 | -8.8 |
| 32 | 130 | 138.8 | -8.8 |
| 33 | 124 | 136.4 | -12.4 |
| 34 | 115 | 125.8 | -10.8 |
| 35 | 106 | 117.8 | -11.8 |
| 36 | 105 | 116.2 | -11.2 |
| 37 | 105 | 115.215686274510 | -10.2156862745098 |
| 38 | 101 | 108.964705882353 | -7.96470588235293 |
| 39 | 95 | 104.164705882353 | -9.16470588235294 |
| 40 | 93 | 101.364705882353 | -8.36470588235295 |
| 41 | 84 | 94.964705882353 | -10.9647058823529 |
| 42 | 87 | 96.364705882353 | -9.36470588235294 |
| 43 | 116 | 127.564705882353 | -11.5647058823529 |
| 44 | 120 | 133.564705882353 | -13.5647058823529 |
| 45 | 117 | 131.164705882353 | -14.1647058823529 |
| 46 | 109 | 120.564705882353 | -11.5647058823529 |
| 47 | 105 | 112.564705882353 | -7.56470588235293 |
| 48 | 107 | 110.964705882353 | -3.96470588235294 |
| 49 | 109 | 109.980392156863 | -0.98039215686274 |
| 50 | 109 | 103.729411764706 | 5.27058823529413 |
| 51 | 108 | 98.9294117647059 | 9.07058823529412 |
| 52 | 107 | 96.1294117647059 | 10.8705882352941 |
| 53 | 99 | 89.7294117647059 | 9.27058823529412 |
| 54 | 103 | 91.1294117647059 | 11.8705882352941 |
| 55 | 131 | 122.329411764706 | 8.67058823529412 |
| 56 | 137 | 128.329411764706 | 8.67058823529412 |
| 57 | 135 | 125.929411764706 | 9.07058823529411 |
| 58 | 124 | 115.329411764706 | 8.67058823529412 |
| 59 | 118 | 107.329411764706 | 10.6705882352941 |
| 60 | 121 | 105.729411764706 | 15.2705882352941 |
| 61 | 121 | 104.745098039216 | 16.2549019607843 |
| Goldfeld-Quandt test for Heteroskedasticity | |||
| p-values | Alternative Hypothesis | ||
| breakpoint index | greater | 2-sided | less |
| 16 | 0.000450848598043393 | 0.000901697196086786 | 0.999549151401957 |
| 17 | 0.000441339325465568 | 0.000882678650931136 | 0.999558660674534 |
| 18 | 0.000137958909844143 | 0.000275917819688285 | 0.999862041090156 |
| 19 | 3.29025479413239e-05 | 6.58050958826478e-05 | 0.999967097452059 |
| 20 | 2.79751049813844e-05 | 5.59502099627688e-05 | 0.999972024895019 |
| 21 | 4.51424349777160e-05 | 9.02848699554319e-05 | 0.999954857565022 |
| 22 | 0.000830683663905003 | 0.00166136732781001 | 0.999169316336095 |
| 23 | 0.00408618280649845 | 0.0081723656129969 | 0.995913817193502 |
| 24 | 0.0120253934654021 | 0.0240507869308041 | 0.987974606534598 |
| 25 | 0.00883226551632808 | 0.0176645310326562 | 0.991167734483672 |
| 26 | 0.00834528735361933 | 0.0166905747072387 | 0.99165471264638 |
| 27 | 0.00742884176620452 | 0.0148576835324090 | 0.992571158233795 |
| 28 | 0.00569059971415847 | 0.0113811994283169 | 0.994309400285841 |
| 29 | 0.00850293161689065 | 0.0170058632337813 | 0.99149706838311 |
| 30 | 0.0137047324926328 | 0.0274094649852655 | 0.986295267507367 |
| 31 | 0.0433720049318896 | 0.0867440098637791 | 0.95662799506811 |
| 32 | 0.143045264572892 | 0.286090529145785 | 0.856954735427108 |
| 33 | 0.428949389704235 | 0.85789877940847 | 0.571050610295765 |
| 34 | 0.732872202757914 | 0.534255594484173 | 0.267127797242086 |
| 35 | 0.89745301404851 | 0.205093971902979 | 0.102546985951490 |
| 36 | 0.96082352326933 | 0.0783529534613396 | 0.0391764767306698 |
| 37 | 0.99897524454407 | 0.00204951091186017 | 0.00102475545593009 |
| 38 | 0.99992852993604 | 0.000142940127920599 | 7.14700639602997e-05 |
| 39 | 0.999827329430129 | 0.000345341139742611 | 0.000172670569871306 |
| 40 | 0.999448874291956 | 0.00110225141608833 | 0.000551125708044163 |
| 41 | 0.997993843267162 | 0.00401231346567543 | 0.00200615673283772 |
| 42 | 0.994085725866985 | 0.0118285482660303 | 0.00591427413301517 |
| 43 | 0.981434055361534 | 0.0371318892769323 | 0.0185659446384661 |
| 44 | 0.965998714168136 | 0.0680025716637287 | 0.0340012858318643 |
| 45 | 0.987350414448505 | 0.0252991711029895 | 0.0126495855514948 |
| Meta Analysis of Goldfeld-Quandt test for Heteroskedasticity | |||
| Description | # significant tests | % significant tests | OK/NOK |
| 1% type I error level | 13 | 0.433333333333333 | NOK |
| 5% type I error level | 23 | 0.766666666666667 | NOK |
| 10% type I error level | 26 | 0.866666666666667 | NOK |