Free Statistics

of Irreproducible Research!

Author's title

Author*The author of this computation has been verified*
R Software Modulerwasp_multipleregression.wasp
Title produced by softwareMultiple Regression
Date of computationWed, 15 Dec 2010 20:39:35 +0000
Cite this page as followsStatistical Computations at FreeStatistics.org, Office for Research Development and Education, URL https://freestatistics.org/blog/index.php?v=date/2010/Dec/15/t1292445460bvptjdakb6agbd2.htm/, Retrieved Fri, 03 May 2024 04:44:43 +0000
Statistical Computations at FreeStatistics.org, Office for Research Development and Education, URL https://freestatistics.org/blog/index.php?pk=110717, Retrieved Fri, 03 May 2024 04:44:43 +0000
QR Codes:

Original text written by user:
IsPrivate?No (this computation is public)
User-defined keywords
Estimated Impact176
Family? (F = Feedback message, R = changed R code, M = changed R Module, P = changed Parameters, D = changed Data)
-     [Multiple Regression] [HPC Retail Sales] [2008-03-08 13:40:54] [1c0f2c85e8a48e42648374b3bcceca26]
- RMPD  [Multiple Regression] [] [2010-11-26 11:40:42] [d39e5c40c631ed6c22677d2e41dbfc7d]
-    D      [Multiple Regression] [] [2010-12-15 20:39:35] [1d094c42a82a95b45a19e32ad4bfff5f] [Current]
-    D        [Multiple Regression] [] [2010-12-17 12:00:00] [d39e5c40c631ed6c22677d2e41dbfc7d]
-    D          [Multiple Regression] [] [2010-12-17 12:30:50] [d39e5c40c631ed6c22677d2e41dbfc7d]
-    D          [Multiple Regression] [] [2010-12-17 12:34:10] [d39e5c40c631ed6c22677d2e41dbfc7d]
-   PD        [Multiple Regression] [paper multiple alles] [2010-12-26 17:24:50] [eeb33d252044f8583501f5ba0605ad6d]
-   PD        [Multiple Regression] [paper Regression ...] [2010-12-26 17:36:00] [eeb33d252044f8583501f5ba0605ad6d]
-   PD        [Multiple Regression] [paper Regression ...] [2010-12-26 17:37:56] [eeb33d252044f8583501f5ba0605ad6d]
-   PD        [Multiple Regression] [paper Regression ...] [2010-12-26 17:42:43] [eeb33d252044f8583501f5ba0605ad6d]
Feedback Forum

Post a new message
Dataseries X:
130
127
122
117
112
113
149
157
157
147
137
132
125
123
117
114
111
112
144
150
149
134
123
116
117
111
105
102
95
93
124
130
124
115
106
105
105
101
95
93
84
87
116
120
117
109
105
107
109
109
108
107
99
103
131
137
135
124
118
121
121


Summary of computational transaction
Raw Inputview raw input (R code)
Raw Outputview raw output of R engine
Computing time7 seconds
R Server'Gwilym Jenkins' @ 72.249.127.135

\begin{tabular}{lllllllll}
\hline
Summary of computational transaction \tabularnewline
Raw Input & view raw input (R code)  \tabularnewline
Raw Output & view raw output of R engine  \tabularnewline
Computing time & 7 seconds \tabularnewline
R Server & 'Gwilym Jenkins' @ 72.249.127.135 \tabularnewline
\hline
\end{tabular}
%Source: https://freestatistics.org/blog/index.php?pk=110717&T=0

[TABLE]
[ROW][C]Summary of computational transaction[/C][/ROW]
[ROW][C]Raw Input[/C][C]view raw input (R code) [/C][/ROW]
[ROW][C]Raw Output[/C][C]view raw output of R engine [/C][/ROW]
[ROW][C]Computing time[/C][C]7 seconds[/C][/ROW]
[ROW][C]R Server[/C][C]'Gwilym Jenkins' @ 72.249.127.135[/C][/ROW]
[/TABLE]
Source: https://freestatistics.org/blog/index.php?pk=110717&T=0

Globally Unique Identifier (entire table): ba.freestatistics.org/blog/index.php?pk=110717&T=0

As an alternative you can also use a QR Code:  

The GUIDs for individual cells are displayed in the table below:

Summary of computational transaction
Raw Inputview raw input (R code)
Raw Outputview raw output of R engine
Computing time7 seconds
R Server'Gwilym Jenkins' @ 72.249.127.135


Multiple Linear Regression - Estimated Regression Equation
HPC[t] = + 131.905882352941 -0.54803921568628M1[t] -6.36274509803925M2[t] -10.7264705882353M3[t] -13.0901960784314M4[t] -19.0539215686275M5[t] -17.2176470588236M6[t] + 14.4186274509804M7[t] + 20.8549019607843M8[t] + 18.8911764705882M9[t] + 8.72745098039215M10[t] + 1.16372549019607M11[t] -0.436274509803922t + e[t]

\begin{tabular}{lllllllll}
\hline
Multiple Linear Regression - Estimated Regression Equation \tabularnewline
HPC[t] =  +  131.905882352941 -0.54803921568628M1[t] -6.36274509803925M2[t] -10.7264705882353M3[t] -13.0901960784314M4[t] -19.0539215686275M5[t] -17.2176470588236M6[t] +  14.4186274509804M7[t] +  20.8549019607843M8[t] +  18.8911764705882M9[t] +  8.72745098039215M10[t] +  1.16372549019607M11[t] -0.436274509803922t  + e[t] \tabularnewline
\hline
\end{tabular}
%Source: https://freestatistics.org/blog/index.php?pk=110717&T=1

[TABLE]
[ROW][C]Multiple Linear Regression - Estimated Regression Equation[/C][/ROW]
[ROW][C]HPC[t] =  +  131.905882352941 -0.54803921568628M1[t] -6.36274509803925M2[t] -10.7264705882353M3[t] -13.0901960784314M4[t] -19.0539215686275M5[t] -17.2176470588236M6[t] +  14.4186274509804M7[t] +  20.8549019607843M8[t] +  18.8911764705882M9[t] +  8.72745098039215M10[t] +  1.16372549019607M11[t] -0.436274509803922t  + e[t][/C][/ROW]
[/TABLE]
Source: https://freestatistics.org/blog/index.php?pk=110717&T=1

Globally Unique Identifier (entire table): ba.freestatistics.org/blog/index.php?pk=110717&T=1

As an alternative you can also use a QR Code:  

The GUIDs for individual cells are displayed in the table below:

Multiple Linear Regression - Estimated Regression Equation
HPC[t] = + 131.905882352941 -0.54803921568628M1[t] -6.36274509803925M2[t] -10.7264705882353M3[t] -13.0901960784314M4[t] -19.0539215686275M5[t] -17.2176470588236M6[t] + 14.4186274509804M7[t] + 20.8549019607843M8[t] + 18.8911764705882M9[t] + 8.72745098039215M10[t] + 1.16372549019607M11[t] -0.436274509803922t + e[t]


Multiple Linear Regression - Ordinary Least Squares
VariableParameterS.D.T-STATH0: parameter = 02-tail p-value1-tail p-value
(Intercept)131.9058823529414.84068527.249400
M1-0.548039215686285.645378-0.09710.9230690.461535
M2-6.362745098039255.925421-1.07380.2882790.144139
M3-10.72647058823535.917854-1.81260.0761560.038078
M4-13.09019607843145.911076-2.21450.0315750.015787
M5-19.05392156862755.905088-3.22670.0022580.001129
M6-17.21764705882365.899894-2.91830.0053420.002671
M714.41862745098045.8954962.44570.0181740.009087
M820.85490196078435.8918943.53960.0009020.000451
M918.89117647058825.8890923.20780.0023830.001192
M108.727450980392155.8870891.48250.1447510.072375
M111.163725490196075.8858870.19770.8441030.422052
t-0.4362745098039220.068678-6.352500

\begin{tabular}{lllllllll}
\hline
Multiple Linear Regression - Ordinary Least Squares \tabularnewline
Variable & Parameter & S.D. & T-STATH0: parameter = 0 & 2-tail p-value & 1-tail p-value \tabularnewline
(Intercept) & 131.905882352941 & 4.840685 & 27.2494 & 0 & 0 \tabularnewline
M1 & -0.54803921568628 & 5.645378 & -0.0971 & 0.923069 & 0.461535 \tabularnewline
M2 & -6.36274509803925 & 5.925421 & -1.0738 & 0.288279 & 0.144139 \tabularnewline
M3 & -10.7264705882353 & 5.917854 & -1.8126 & 0.076156 & 0.038078 \tabularnewline
M4 & -13.0901960784314 & 5.911076 & -2.2145 & 0.031575 & 0.015787 \tabularnewline
M5 & -19.0539215686275 & 5.905088 & -3.2267 & 0.002258 & 0.001129 \tabularnewline
M6 & -17.2176470588236 & 5.899894 & -2.9183 & 0.005342 & 0.002671 \tabularnewline
M7 & 14.4186274509804 & 5.895496 & 2.4457 & 0.018174 & 0.009087 \tabularnewline
M8 & 20.8549019607843 & 5.891894 & 3.5396 & 0.000902 & 0.000451 \tabularnewline
M9 & 18.8911764705882 & 5.889092 & 3.2078 & 0.002383 & 0.001192 \tabularnewline
M10 & 8.72745098039215 & 5.887089 & 1.4825 & 0.144751 & 0.072375 \tabularnewline
M11 & 1.16372549019607 & 5.885887 & 0.1977 & 0.844103 & 0.422052 \tabularnewline
t & -0.436274509803922 & 0.068678 & -6.3525 & 0 & 0 \tabularnewline
\hline
\end{tabular}
%Source: https://freestatistics.org/blog/index.php?pk=110717&T=2

[TABLE]
[ROW][C]Multiple Linear Regression - Ordinary Least Squares[/C][/ROW]
[ROW][C]Variable[/C][C]Parameter[/C][C]S.D.[/C][C]T-STATH0: parameter = 0[/C][C]2-tail p-value[/C][C]1-tail p-value[/C][/ROW]
[ROW][C](Intercept)[/C][C]131.905882352941[/C][C]4.840685[/C][C]27.2494[/C][C]0[/C][C]0[/C][/ROW]
[ROW][C]M1[/C][C]-0.54803921568628[/C][C]5.645378[/C][C]-0.0971[/C][C]0.923069[/C][C]0.461535[/C][/ROW]
[ROW][C]M2[/C][C]-6.36274509803925[/C][C]5.925421[/C][C]-1.0738[/C][C]0.288279[/C][C]0.144139[/C][/ROW]
[ROW][C]M3[/C][C]-10.7264705882353[/C][C]5.917854[/C][C]-1.8126[/C][C]0.076156[/C][C]0.038078[/C][/ROW]
[ROW][C]M4[/C][C]-13.0901960784314[/C][C]5.911076[/C][C]-2.2145[/C][C]0.031575[/C][C]0.015787[/C][/ROW]
[ROW][C]M5[/C][C]-19.0539215686275[/C][C]5.905088[/C][C]-3.2267[/C][C]0.002258[/C][C]0.001129[/C][/ROW]
[ROW][C]M6[/C][C]-17.2176470588236[/C][C]5.899894[/C][C]-2.9183[/C][C]0.005342[/C][C]0.002671[/C][/ROW]
[ROW][C]M7[/C][C]14.4186274509804[/C][C]5.895496[/C][C]2.4457[/C][C]0.018174[/C][C]0.009087[/C][/ROW]
[ROW][C]M8[/C][C]20.8549019607843[/C][C]5.891894[/C][C]3.5396[/C][C]0.000902[/C][C]0.000451[/C][/ROW]
[ROW][C]M9[/C][C]18.8911764705882[/C][C]5.889092[/C][C]3.2078[/C][C]0.002383[/C][C]0.001192[/C][/ROW]
[ROW][C]M10[/C][C]8.72745098039215[/C][C]5.887089[/C][C]1.4825[/C][C]0.144751[/C][C]0.072375[/C][/ROW]
[ROW][C]M11[/C][C]1.16372549019607[/C][C]5.885887[/C][C]0.1977[/C][C]0.844103[/C][C]0.422052[/C][/ROW]
[ROW][C]t[/C][C]-0.436274509803922[/C][C]0.068678[/C][C]-6.3525[/C][C]0[/C][C]0[/C][/ROW]
[/TABLE]
Source: https://freestatistics.org/blog/index.php?pk=110717&T=2

Globally Unique Identifier (entire table): ba.freestatistics.org/blog/index.php?pk=110717&T=2

As an alternative you can also use a QR Code:  

The GUIDs for individual cells are displayed in the table below:

Multiple Linear Regression - Ordinary Least Squares
VariableParameterS.D.T-STATH0: parameter = 02-tail p-value1-tail p-value
(Intercept)131.9058823529414.84068527.249400
M1-0.548039215686285.645378-0.09710.9230690.461535
M2-6.362745098039255.925421-1.07380.2882790.144139
M3-10.72647058823535.917854-1.81260.0761560.038078
M4-13.09019607843145.911076-2.21450.0315750.015787
M5-19.05392156862755.905088-3.22670.0022580.001129
M6-17.21764705882365.899894-2.91830.0053420.002671
M714.41862745098045.8954962.44570.0181740.009087
M820.85490196078435.8918943.53960.0009020.000451
M918.89117647058825.8890923.20780.0023830.001192
M108.727450980392155.8870891.48250.1447510.072375
M111.163725490196075.8858870.19770.8441030.422052
t-0.4362745098039220.068678-6.352500


Multiple Linear Regression - Regression Statistics
Multiple R0.868715394112654
R-squared0.754666435968303
Adjusted R-squared0.693333044960379
F-TEST (value)12.3043324943635
F-TEST (DF numerator)12
F-TEST (DF denominator)48
p-value7.01978475348142e-11
Multiple Linear Regression - Residual Statistics
Residual Standard Deviation9.3057716295273
Sum Squared Residuals4156.67450980392

\begin{tabular}{lllllllll}
\hline
Multiple Linear Regression - Regression Statistics \tabularnewline
Multiple R & 0.868715394112654 \tabularnewline
R-squared & 0.754666435968303 \tabularnewline
Adjusted R-squared & 0.693333044960379 \tabularnewline
F-TEST (value) & 12.3043324943635 \tabularnewline
F-TEST (DF numerator) & 12 \tabularnewline
F-TEST (DF denominator) & 48 \tabularnewline
p-value & 7.01978475348142e-11 \tabularnewline
Multiple Linear Regression - Residual Statistics \tabularnewline
Residual Standard Deviation & 9.3057716295273 \tabularnewline
Sum Squared Residuals & 4156.67450980392 \tabularnewline
\hline
\end{tabular}
%Source: https://freestatistics.org/blog/index.php?pk=110717&T=3

[TABLE]
[ROW][C]Multiple Linear Regression - Regression Statistics[/C][/ROW]
[ROW][C]Multiple R[/C][C]0.868715394112654[/C][/ROW]
[ROW][C]R-squared[/C][C]0.754666435968303[/C][/ROW]
[ROW][C]Adjusted R-squared[/C][C]0.693333044960379[/C][/ROW]
[ROW][C]F-TEST (value)[/C][C]12.3043324943635[/C][/ROW]
[ROW][C]F-TEST (DF numerator)[/C][C]12[/C][/ROW]
[ROW][C]F-TEST (DF denominator)[/C][C]48[/C][/ROW]
[ROW][C]p-value[/C][C]7.01978475348142e-11[/C][/ROW]
[ROW][C]Multiple Linear Regression - Residual Statistics[/C][/ROW]
[ROW][C]Residual Standard Deviation[/C][C]9.3057716295273[/C][/ROW]
[ROW][C]Sum Squared Residuals[/C][C]4156.67450980392[/C][/ROW]
[/TABLE]
Source: https://freestatistics.org/blog/index.php?pk=110717&T=3

Globally Unique Identifier (entire table): ba.freestatistics.org/blog/index.php?pk=110717&T=3

As an alternative you can also use a QR Code:  

The GUIDs for individual cells are displayed in the table below:

Multiple Linear Regression - Regression Statistics
Multiple R0.868715394112654
R-squared0.754666435968303
Adjusted R-squared0.693333044960379
F-TEST (value)12.3043324943635
F-TEST (DF numerator)12
F-TEST (DF denominator)48
p-value7.01978475348142e-11
Multiple Linear Regression - Residual Statistics
Residual Standard Deviation9.3057716295273
Sum Squared Residuals4156.67450980392


Multiple Linear Regression - Actuals, Interpolation, and Residuals
Time or IndexActualsInterpolationForecastResidualsPrediction Error
1130130.921568627451-0.921568627450961
2127124.6705882352942.32941176470585
3122119.8705882352942.12941176470588
4117117.070588235294-0.0705882352940977
5112110.6705882352941.32941176470590
6113112.0705882352940.929411764705907
7149143.2705882352945.7294117647059
8157149.2705882352947.7294117647059
9157146.87058823529410.1294117647059
10147136.27058823529410.7294117647059
11137128.2705882352948.72941176470587
12132126.6705882352945.32941176470587
13125125.686274509804-0.686274509803949
14123119.4352941176473.56470588235295
15117114.6352941176472.36470588235294
16114111.8352941176472.16470588235293
17111105.4352941176475.56470588235293
18112106.8352941176475.16470588235293
19144138.0352941176475.96470588235293
20150144.0352941176475.96470588235294
21149141.6352941176477.36470588235293
22134131.0352941176472.96470588235294
23123123.035294117647-0.0352941176470617
24116121.435294117647-5.43529411764707
25117120.450980392157-3.45098039215686
26111114.2-3.19999999999999
27105109.4-4.4
28102106.6-4.60000000000001
2995100.2-5.20000000000001
3093101.6-8.60000000000001
31124132.8-8.8
32130138.8-8.8
33124136.4-12.4
34115125.8-10.8
35106117.8-11.8
36105116.2-11.2
37105115.215686274510-10.2156862745098
38101108.964705882353-7.96470588235293
3995104.164705882353-9.16470588235294
4093101.364705882353-8.36470588235295
418494.964705882353-10.9647058823529
428796.364705882353-9.36470588235294
43116127.564705882353-11.5647058823529
44120133.564705882353-13.5647058823529
45117131.164705882353-14.1647058823529
46109120.564705882353-11.5647058823529
47105112.564705882353-7.56470588235293
48107110.964705882353-3.96470588235294
49109109.980392156863-0.98039215686274
50109103.7294117647065.27058823529413
5110898.92941176470599.07058823529412
5210796.129411764705910.8705882352941
539989.72941176470599.27058823529412
5410391.129411764705911.8705882352941
55131122.3294117647068.67058823529412
56137128.3294117647068.67058823529412
57135125.9294117647069.07058823529411
58124115.3294117647068.67058823529412
59118107.32941176470610.6705882352941
60121105.72941176470615.2705882352941
61121104.74509803921616.2549019607843

\begin{tabular}{lllllllll}
\hline
Multiple Linear Regression - Actuals, Interpolation, and Residuals \tabularnewline
Time or Index & Actuals & InterpolationForecast & ResidualsPrediction Error \tabularnewline
1 & 130 & 130.921568627451 & -0.921568627450961 \tabularnewline
2 & 127 & 124.670588235294 & 2.32941176470585 \tabularnewline
3 & 122 & 119.870588235294 & 2.12941176470588 \tabularnewline
4 & 117 & 117.070588235294 & -0.0705882352940977 \tabularnewline
5 & 112 & 110.670588235294 & 1.32941176470590 \tabularnewline
6 & 113 & 112.070588235294 & 0.929411764705907 \tabularnewline
7 & 149 & 143.270588235294 & 5.7294117647059 \tabularnewline
8 & 157 & 149.270588235294 & 7.7294117647059 \tabularnewline
9 & 157 & 146.870588235294 & 10.1294117647059 \tabularnewline
10 & 147 & 136.270588235294 & 10.7294117647059 \tabularnewline
11 & 137 & 128.270588235294 & 8.72941176470587 \tabularnewline
12 & 132 & 126.670588235294 & 5.32941176470587 \tabularnewline
13 & 125 & 125.686274509804 & -0.686274509803949 \tabularnewline
14 & 123 & 119.435294117647 & 3.56470588235295 \tabularnewline
15 & 117 & 114.635294117647 & 2.36470588235294 \tabularnewline
16 & 114 & 111.835294117647 & 2.16470588235293 \tabularnewline
17 & 111 & 105.435294117647 & 5.56470588235293 \tabularnewline
18 & 112 & 106.835294117647 & 5.16470588235293 \tabularnewline
19 & 144 & 138.035294117647 & 5.96470588235293 \tabularnewline
20 & 150 & 144.035294117647 & 5.96470588235294 \tabularnewline
21 & 149 & 141.635294117647 & 7.36470588235293 \tabularnewline
22 & 134 & 131.035294117647 & 2.96470588235294 \tabularnewline
23 & 123 & 123.035294117647 & -0.0352941176470617 \tabularnewline
24 & 116 & 121.435294117647 & -5.43529411764707 \tabularnewline
25 & 117 & 120.450980392157 & -3.45098039215686 \tabularnewline
26 & 111 & 114.2 & -3.19999999999999 \tabularnewline
27 & 105 & 109.4 & -4.4 \tabularnewline
28 & 102 & 106.6 & -4.60000000000001 \tabularnewline
29 & 95 & 100.2 & -5.20000000000001 \tabularnewline
30 & 93 & 101.6 & -8.60000000000001 \tabularnewline
31 & 124 & 132.8 & -8.8 \tabularnewline
32 & 130 & 138.8 & -8.8 \tabularnewline
33 & 124 & 136.4 & -12.4 \tabularnewline
34 & 115 & 125.8 & -10.8 \tabularnewline
35 & 106 & 117.8 & -11.8 \tabularnewline
36 & 105 & 116.2 & -11.2 \tabularnewline
37 & 105 & 115.215686274510 & -10.2156862745098 \tabularnewline
38 & 101 & 108.964705882353 & -7.96470588235293 \tabularnewline
39 & 95 & 104.164705882353 & -9.16470588235294 \tabularnewline
40 & 93 & 101.364705882353 & -8.36470588235295 \tabularnewline
41 & 84 & 94.964705882353 & -10.9647058823529 \tabularnewline
42 & 87 & 96.364705882353 & -9.36470588235294 \tabularnewline
43 & 116 & 127.564705882353 & -11.5647058823529 \tabularnewline
44 & 120 & 133.564705882353 & -13.5647058823529 \tabularnewline
45 & 117 & 131.164705882353 & -14.1647058823529 \tabularnewline
46 & 109 & 120.564705882353 & -11.5647058823529 \tabularnewline
47 & 105 & 112.564705882353 & -7.56470588235293 \tabularnewline
48 & 107 & 110.964705882353 & -3.96470588235294 \tabularnewline
49 & 109 & 109.980392156863 & -0.98039215686274 \tabularnewline
50 & 109 & 103.729411764706 & 5.27058823529413 \tabularnewline
51 & 108 & 98.9294117647059 & 9.07058823529412 \tabularnewline
52 & 107 & 96.1294117647059 & 10.8705882352941 \tabularnewline
53 & 99 & 89.7294117647059 & 9.27058823529412 \tabularnewline
54 & 103 & 91.1294117647059 & 11.8705882352941 \tabularnewline
55 & 131 & 122.329411764706 & 8.67058823529412 \tabularnewline
56 & 137 & 128.329411764706 & 8.67058823529412 \tabularnewline
57 & 135 & 125.929411764706 & 9.07058823529411 \tabularnewline
58 & 124 & 115.329411764706 & 8.67058823529412 \tabularnewline
59 & 118 & 107.329411764706 & 10.6705882352941 \tabularnewline
60 & 121 & 105.729411764706 & 15.2705882352941 \tabularnewline
61 & 121 & 104.745098039216 & 16.2549019607843 \tabularnewline
\hline
\end{tabular}
%Source: https://freestatistics.org/blog/index.php?pk=110717&T=4

[TABLE]
[ROW][C]Multiple Linear Regression - Actuals, Interpolation, and Residuals[/C][/ROW]
[ROW][C]Time or Index[/C][C]Actuals[/C][C]InterpolationForecast[/C][C]ResidualsPrediction Error[/C][/ROW]
[ROW][C]1[/C][C]130[/C][C]130.921568627451[/C][C]-0.921568627450961[/C][/ROW]
[ROW][C]2[/C][C]127[/C][C]124.670588235294[/C][C]2.32941176470585[/C][/ROW]
[ROW][C]3[/C][C]122[/C][C]119.870588235294[/C][C]2.12941176470588[/C][/ROW]
[ROW][C]4[/C][C]117[/C][C]117.070588235294[/C][C]-0.0705882352940977[/C][/ROW]
[ROW][C]5[/C][C]112[/C][C]110.670588235294[/C][C]1.32941176470590[/C][/ROW]
[ROW][C]6[/C][C]113[/C][C]112.070588235294[/C][C]0.929411764705907[/C][/ROW]
[ROW][C]7[/C][C]149[/C][C]143.270588235294[/C][C]5.7294117647059[/C][/ROW]
[ROW][C]8[/C][C]157[/C][C]149.270588235294[/C][C]7.7294117647059[/C][/ROW]
[ROW][C]9[/C][C]157[/C][C]146.870588235294[/C][C]10.1294117647059[/C][/ROW]
[ROW][C]10[/C][C]147[/C][C]136.270588235294[/C][C]10.7294117647059[/C][/ROW]
[ROW][C]11[/C][C]137[/C][C]128.270588235294[/C][C]8.72941176470587[/C][/ROW]
[ROW][C]12[/C][C]132[/C][C]126.670588235294[/C][C]5.32941176470587[/C][/ROW]
[ROW][C]13[/C][C]125[/C][C]125.686274509804[/C][C]-0.686274509803949[/C][/ROW]
[ROW][C]14[/C][C]123[/C][C]119.435294117647[/C][C]3.56470588235295[/C][/ROW]
[ROW][C]15[/C][C]117[/C][C]114.635294117647[/C][C]2.36470588235294[/C][/ROW]
[ROW][C]16[/C][C]114[/C][C]111.835294117647[/C][C]2.16470588235293[/C][/ROW]
[ROW][C]17[/C][C]111[/C][C]105.435294117647[/C][C]5.56470588235293[/C][/ROW]
[ROW][C]18[/C][C]112[/C][C]106.835294117647[/C][C]5.16470588235293[/C][/ROW]
[ROW][C]19[/C][C]144[/C][C]138.035294117647[/C][C]5.96470588235293[/C][/ROW]
[ROW][C]20[/C][C]150[/C][C]144.035294117647[/C][C]5.96470588235294[/C][/ROW]
[ROW][C]21[/C][C]149[/C][C]141.635294117647[/C][C]7.36470588235293[/C][/ROW]
[ROW][C]22[/C][C]134[/C][C]131.035294117647[/C][C]2.96470588235294[/C][/ROW]
[ROW][C]23[/C][C]123[/C][C]123.035294117647[/C][C]-0.0352941176470617[/C][/ROW]
[ROW][C]24[/C][C]116[/C][C]121.435294117647[/C][C]-5.43529411764707[/C][/ROW]
[ROW][C]25[/C][C]117[/C][C]120.450980392157[/C][C]-3.45098039215686[/C][/ROW]
[ROW][C]26[/C][C]111[/C][C]114.2[/C][C]-3.19999999999999[/C][/ROW]
[ROW][C]27[/C][C]105[/C][C]109.4[/C][C]-4.4[/C][/ROW]
[ROW][C]28[/C][C]102[/C][C]106.6[/C][C]-4.60000000000001[/C][/ROW]
[ROW][C]29[/C][C]95[/C][C]100.2[/C][C]-5.20000000000001[/C][/ROW]
[ROW][C]30[/C][C]93[/C][C]101.6[/C][C]-8.60000000000001[/C][/ROW]
[ROW][C]31[/C][C]124[/C][C]132.8[/C][C]-8.8[/C][/ROW]
[ROW][C]32[/C][C]130[/C][C]138.8[/C][C]-8.8[/C][/ROW]
[ROW][C]33[/C][C]124[/C][C]136.4[/C][C]-12.4[/C][/ROW]
[ROW][C]34[/C][C]115[/C][C]125.8[/C][C]-10.8[/C][/ROW]
[ROW][C]35[/C][C]106[/C][C]117.8[/C][C]-11.8[/C][/ROW]
[ROW][C]36[/C][C]105[/C][C]116.2[/C][C]-11.2[/C][/ROW]
[ROW][C]37[/C][C]105[/C][C]115.215686274510[/C][C]-10.2156862745098[/C][/ROW]
[ROW][C]38[/C][C]101[/C][C]108.964705882353[/C][C]-7.96470588235293[/C][/ROW]
[ROW][C]39[/C][C]95[/C][C]104.164705882353[/C][C]-9.16470588235294[/C][/ROW]
[ROW][C]40[/C][C]93[/C][C]101.364705882353[/C][C]-8.36470588235295[/C][/ROW]
[ROW][C]41[/C][C]84[/C][C]94.964705882353[/C][C]-10.9647058823529[/C][/ROW]
[ROW][C]42[/C][C]87[/C][C]96.364705882353[/C][C]-9.36470588235294[/C][/ROW]
[ROW][C]43[/C][C]116[/C][C]127.564705882353[/C][C]-11.5647058823529[/C][/ROW]
[ROW][C]44[/C][C]120[/C][C]133.564705882353[/C][C]-13.5647058823529[/C][/ROW]
[ROW][C]45[/C][C]117[/C][C]131.164705882353[/C][C]-14.1647058823529[/C][/ROW]
[ROW][C]46[/C][C]109[/C][C]120.564705882353[/C][C]-11.5647058823529[/C][/ROW]
[ROW][C]47[/C][C]105[/C][C]112.564705882353[/C][C]-7.56470588235293[/C][/ROW]
[ROW][C]48[/C][C]107[/C][C]110.964705882353[/C][C]-3.96470588235294[/C][/ROW]
[ROW][C]49[/C][C]109[/C][C]109.980392156863[/C][C]-0.98039215686274[/C][/ROW]
[ROW][C]50[/C][C]109[/C][C]103.729411764706[/C][C]5.27058823529413[/C][/ROW]
[ROW][C]51[/C][C]108[/C][C]98.9294117647059[/C][C]9.07058823529412[/C][/ROW]
[ROW][C]52[/C][C]107[/C][C]96.1294117647059[/C][C]10.8705882352941[/C][/ROW]
[ROW][C]53[/C][C]99[/C][C]89.7294117647059[/C][C]9.27058823529412[/C][/ROW]
[ROW][C]54[/C][C]103[/C][C]91.1294117647059[/C][C]11.8705882352941[/C][/ROW]
[ROW][C]55[/C][C]131[/C][C]122.329411764706[/C][C]8.67058823529412[/C][/ROW]
[ROW][C]56[/C][C]137[/C][C]128.329411764706[/C][C]8.67058823529412[/C][/ROW]
[ROW][C]57[/C][C]135[/C][C]125.929411764706[/C][C]9.07058823529411[/C][/ROW]
[ROW][C]58[/C][C]124[/C][C]115.329411764706[/C][C]8.67058823529412[/C][/ROW]
[ROW][C]59[/C][C]118[/C][C]107.329411764706[/C][C]10.6705882352941[/C][/ROW]
[ROW][C]60[/C][C]121[/C][C]105.729411764706[/C][C]15.2705882352941[/C][/ROW]
[ROW][C]61[/C][C]121[/C][C]104.745098039216[/C][C]16.2549019607843[/C][/ROW]
[/TABLE]
Source: https://freestatistics.org/blog/index.php?pk=110717&T=4

Globally Unique Identifier (entire table): ba.freestatistics.org/blog/index.php?pk=110717&T=4

As an alternative you can also use a QR Code:  

The GUIDs for individual cells are displayed in the table below:

Multiple Linear Regression - Actuals, Interpolation, and Residuals
Time or IndexActualsInterpolationForecastResidualsPrediction Error
1130130.921568627451-0.921568627450961
2127124.6705882352942.32941176470585
3122119.8705882352942.12941176470588
4117117.070588235294-0.0705882352940977
5112110.6705882352941.32941176470590
6113112.0705882352940.929411764705907
7149143.2705882352945.7294117647059
8157149.2705882352947.7294117647059
9157146.87058823529410.1294117647059
10147136.27058823529410.7294117647059
11137128.2705882352948.72941176470587
12132126.6705882352945.32941176470587
13125125.686274509804-0.686274509803949
14123119.4352941176473.56470588235295
15117114.6352941176472.36470588235294
16114111.8352941176472.16470588235293
17111105.4352941176475.56470588235293
18112106.8352941176475.16470588235293
19144138.0352941176475.96470588235293
20150144.0352941176475.96470588235294
21149141.6352941176477.36470588235293
22134131.0352941176472.96470588235294
23123123.035294117647-0.0352941176470617
24116121.435294117647-5.43529411764707
25117120.450980392157-3.45098039215686
26111114.2-3.19999999999999
27105109.4-4.4
28102106.6-4.60000000000001
2995100.2-5.20000000000001
3093101.6-8.60000000000001
31124132.8-8.8
32130138.8-8.8
33124136.4-12.4
34115125.8-10.8
35106117.8-11.8
36105116.2-11.2
37105115.215686274510-10.2156862745098
38101108.964705882353-7.96470588235293
3995104.164705882353-9.16470588235294
4093101.364705882353-8.36470588235295
418494.964705882353-10.9647058823529
428796.364705882353-9.36470588235294
43116127.564705882353-11.5647058823529
44120133.564705882353-13.5647058823529
45117131.164705882353-14.1647058823529
46109120.564705882353-11.5647058823529
47105112.564705882353-7.56470588235293
48107110.964705882353-3.96470588235294
49109109.980392156863-0.98039215686274
50109103.7294117647065.27058823529413
5110898.92941176470599.07058823529412
5210796.129411764705910.8705882352941
539989.72941176470599.27058823529412
5410391.129411764705911.8705882352941
55131122.3294117647068.67058823529412
56137128.3294117647068.67058823529412
57135125.9294117647069.07058823529411
58124115.3294117647068.67058823529412
59118107.32941176470610.6705882352941
60121105.72941176470615.2705882352941
61121104.74509803921616.2549019607843


Goldfeld-Quandt test for Heteroskedasticity
p-valuesAlternative Hypothesis
breakpoint indexgreater2-sidedless
160.0004508485980433930.0009016971960867860.999549151401957
170.0004413393254655680.0008826786509311360.999558660674534
180.0001379589098441430.0002759178196882850.999862041090156
193.29025479413239e-056.58050958826478e-050.999967097452059
202.79751049813844e-055.59502099627688e-050.999972024895019
214.51424349777160e-059.02848699554319e-050.999954857565022
220.0008306836639050030.001661367327810010.999169316336095
230.004086182806498450.00817236561299690.995913817193502
240.01202539346540210.02405078693080410.987974606534598
250.008832265516328080.01766453103265620.991167734483672
260.008345287353619330.01669057470723870.99165471264638
270.007428841766204520.01485768353240900.992571158233795
280.005690599714158470.01138119942831690.994309400285841
290.008502931616890650.01700586323378130.99149706838311
300.01370473249263280.02740946498526550.986295267507367
310.04337200493188960.08674400986377910.95662799506811
320.1430452645728920.2860905291457850.856954735427108
330.4289493897042350.857898779408470.571050610295765
340.7328722027579140.5342555944841730.267127797242086
350.897453014048510.2050939719029790.102546985951490
360.960823523269330.07835295346133960.0391764767306698
370.998975244544070.002049510911860170.00102475545593009
380.999928529936040.0001429401279205997.14700639602997e-05
390.9998273294301290.0003453411397426110.000172670569871306
400.9994488742919560.001102251416088330.000551125708044163
410.9979938432671620.004012313465675430.00200615673283772
420.9940857258669850.01182854826603030.00591427413301517
430.9814340553615340.03713188927693230.0185659446384661
440.9659987141681360.06800257166372870.0340012858318643
450.9873504144485050.02529917110298950.0126495855514948

\begin{tabular}{lllllllll}
\hline
Goldfeld-Quandt test for Heteroskedasticity \tabularnewline
p-values & Alternative Hypothesis \tabularnewline
breakpoint index & greater & 2-sided & less \tabularnewline
16 & 0.000450848598043393 & 0.000901697196086786 & 0.999549151401957 \tabularnewline
17 & 0.000441339325465568 & 0.000882678650931136 & 0.999558660674534 \tabularnewline
18 & 0.000137958909844143 & 0.000275917819688285 & 0.999862041090156 \tabularnewline
19 & 3.29025479413239e-05 & 6.58050958826478e-05 & 0.999967097452059 \tabularnewline
20 & 2.79751049813844e-05 & 5.59502099627688e-05 & 0.999972024895019 \tabularnewline
21 & 4.51424349777160e-05 & 9.02848699554319e-05 & 0.999954857565022 \tabularnewline
22 & 0.000830683663905003 & 0.00166136732781001 & 0.999169316336095 \tabularnewline
23 & 0.00408618280649845 & 0.0081723656129969 & 0.995913817193502 \tabularnewline
24 & 0.0120253934654021 & 0.0240507869308041 & 0.987974606534598 \tabularnewline
25 & 0.00883226551632808 & 0.0176645310326562 & 0.991167734483672 \tabularnewline
26 & 0.00834528735361933 & 0.0166905747072387 & 0.99165471264638 \tabularnewline
27 & 0.00742884176620452 & 0.0148576835324090 & 0.992571158233795 \tabularnewline
28 & 0.00569059971415847 & 0.0113811994283169 & 0.994309400285841 \tabularnewline
29 & 0.00850293161689065 & 0.0170058632337813 & 0.99149706838311 \tabularnewline
30 & 0.0137047324926328 & 0.0274094649852655 & 0.986295267507367 \tabularnewline
31 & 0.0433720049318896 & 0.0867440098637791 & 0.95662799506811 \tabularnewline
32 & 0.143045264572892 & 0.286090529145785 & 0.856954735427108 \tabularnewline
33 & 0.428949389704235 & 0.85789877940847 & 0.571050610295765 \tabularnewline
34 & 0.732872202757914 & 0.534255594484173 & 0.267127797242086 \tabularnewline
35 & 0.89745301404851 & 0.205093971902979 & 0.102546985951490 \tabularnewline
36 & 0.96082352326933 & 0.0783529534613396 & 0.0391764767306698 \tabularnewline
37 & 0.99897524454407 & 0.00204951091186017 & 0.00102475545593009 \tabularnewline
38 & 0.99992852993604 & 0.000142940127920599 & 7.14700639602997e-05 \tabularnewline
39 & 0.999827329430129 & 0.000345341139742611 & 0.000172670569871306 \tabularnewline
40 & 0.999448874291956 & 0.00110225141608833 & 0.000551125708044163 \tabularnewline
41 & 0.997993843267162 & 0.00401231346567543 & 0.00200615673283772 \tabularnewline
42 & 0.994085725866985 & 0.0118285482660303 & 0.00591427413301517 \tabularnewline
43 & 0.981434055361534 & 0.0371318892769323 & 0.0185659446384661 \tabularnewline
44 & 0.965998714168136 & 0.0680025716637287 & 0.0340012858318643 \tabularnewline
45 & 0.987350414448505 & 0.0252991711029895 & 0.0126495855514948 \tabularnewline
\hline
\end{tabular}
%Source: https://freestatistics.org/blog/index.php?pk=110717&T=5

[TABLE]
[ROW][C]Goldfeld-Quandt test for Heteroskedasticity[/C][/ROW]
[ROW][C]p-values[/C][C]Alternative Hypothesis[/C][/ROW]
[ROW][C]breakpoint index[/C][C]greater[/C][C]2-sided[/C][C]less[/C][/ROW]
[ROW][C]16[/C][C]0.000450848598043393[/C][C]0.000901697196086786[/C][C]0.999549151401957[/C][/ROW]
[ROW][C]17[/C][C]0.000441339325465568[/C][C]0.000882678650931136[/C][C]0.999558660674534[/C][/ROW]
[ROW][C]18[/C][C]0.000137958909844143[/C][C]0.000275917819688285[/C][C]0.999862041090156[/C][/ROW]
[ROW][C]19[/C][C]3.29025479413239e-05[/C][C]6.58050958826478e-05[/C][C]0.999967097452059[/C][/ROW]
[ROW][C]20[/C][C]2.79751049813844e-05[/C][C]5.59502099627688e-05[/C][C]0.999972024895019[/C][/ROW]
[ROW][C]21[/C][C]4.51424349777160e-05[/C][C]9.02848699554319e-05[/C][C]0.999954857565022[/C][/ROW]
[ROW][C]22[/C][C]0.000830683663905003[/C][C]0.00166136732781001[/C][C]0.999169316336095[/C][/ROW]
[ROW][C]23[/C][C]0.00408618280649845[/C][C]0.0081723656129969[/C][C]0.995913817193502[/C][/ROW]
[ROW][C]24[/C][C]0.0120253934654021[/C][C]0.0240507869308041[/C][C]0.987974606534598[/C][/ROW]
[ROW][C]25[/C][C]0.00883226551632808[/C][C]0.0176645310326562[/C][C]0.991167734483672[/C][/ROW]
[ROW][C]26[/C][C]0.00834528735361933[/C][C]0.0166905747072387[/C][C]0.99165471264638[/C][/ROW]
[ROW][C]27[/C][C]0.00742884176620452[/C][C]0.0148576835324090[/C][C]0.992571158233795[/C][/ROW]
[ROW][C]28[/C][C]0.00569059971415847[/C][C]0.0113811994283169[/C][C]0.994309400285841[/C][/ROW]
[ROW][C]29[/C][C]0.00850293161689065[/C][C]0.0170058632337813[/C][C]0.99149706838311[/C][/ROW]
[ROW][C]30[/C][C]0.0137047324926328[/C][C]0.0274094649852655[/C][C]0.986295267507367[/C][/ROW]
[ROW][C]31[/C][C]0.0433720049318896[/C][C]0.0867440098637791[/C][C]0.95662799506811[/C][/ROW]
[ROW][C]32[/C][C]0.143045264572892[/C][C]0.286090529145785[/C][C]0.856954735427108[/C][/ROW]
[ROW][C]33[/C][C]0.428949389704235[/C][C]0.85789877940847[/C][C]0.571050610295765[/C][/ROW]
[ROW][C]34[/C][C]0.732872202757914[/C][C]0.534255594484173[/C][C]0.267127797242086[/C][/ROW]
[ROW][C]35[/C][C]0.89745301404851[/C][C]0.205093971902979[/C][C]0.102546985951490[/C][/ROW]
[ROW][C]36[/C][C]0.96082352326933[/C][C]0.0783529534613396[/C][C]0.0391764767306698[/C][/ROW]
[ROW][C]37[/C][C]0.99897524454407[/C][C]0.00204951091186017[/C][C]0.00102475545593009[/C][/ROW]
[ROW][C]38[/C][C]0.99992852993604[/C][C]0.000142940127920599[/C][C]7.14700639602997e-05[/C][/ROW]
[ROW][C]39[/C][C]0.999827329430129[/C][C]0.000345341139742611[/C][C]0.000172670569871306[/C][/ROW]
[ROW][C]40[/C][C]0.999448874291956[/C][C]0.00110225141608833[/C][C]0.000551125708044163[/C][/ROW]
[ROW][C]41[/C][C]0.997993843267162[/C][C]0.00401231346567543[/C][C]0.00200615673283772[/C][/ROW]
[ROW][C]42[/C][C]0.994085725866985[/C][C]0.0118285482660303[/C][C]0.00591427413301517[/C][/ROW]
[ROW][C]43[/C][C]0.981434055361534[/C][C]0.0371318892769323[/C][C]0.0185659446384661[/C][/ROW]
[ROW][C]44[/C][C]0.965998714168136[/C][C]0.0680025716637287[/C][C]0.0340012858318643[/C][/ROW]
[ROW][C]45[/C][C]0.987350414448505[/C][C]0.0252991711029895[/C][C]0.0126495855514948[/C][/ROW]
[/TABLE]
Source: https://freestatistics.org/blog/index.php?pk=110717&T=5

Globally Unique Identifier (entire table): ba.freestatistics.org/blog/index.php?pk=110717&T=5

As an alternative you can also use a QR Code:  

The GUIDs for individual cells are displayed in the table below:

Goldfeld-Quandt test for Heteroskedasticity
p-valuesAlternative Hypothesis
breakpoint indexgreater2-sidedless
160.0004508485980433930.0009016971960867860.999549151401957
170.0004413393254655680.0008826786509311360.999558660674534
180.0001379589098441430.0002759178196882850.999862041090156
193.29025479413239e-056.58050958826478e-050.999967097452059
202.79751049813844e-055.59502099627688e-050.999972024895019
214.51424349777160e-059.02848699554319e-050.999954857565022
220.0008306836639050030.001661367327810010.999169316336095
230.004086182806498450.00817236561299690.995913817193502
240.01202539346540210.02405078693080410.987974606534598
250.008832265516328080.01766453103265620.991167734483672
260.008345287353619330.01669057470723870.99165471264638
270.007428841766204520.01485768353240900.992571158233795
280.005690599714158470.01138119942831690.994309400285841
290.008502931616890650.01700586323378130.99149706838311
300.01370473249263280.02740946498526550.986295267507367
310.04337200493188960.08674400986377910.95662799506811
320.1430452645728920.2860905291457850.856954735427108
330.4289493897042350.857898779408470.571050610295765
340.7328722027579140.5342555944841730.267127797242086
350.897453014048510.2050939719029790.102546985951490
360.960823523269330.07835295346133960.0391764767306698
370.998975244544070.002049510911860170.00102475545593009
380.999928529936040.0001429401279205997.14700639602997e-05
390.9998273294301290.0003453411397426110.000172670569871306
400.9994488742919560.001102251416088330.000551125708044163
410.9979938432671620.004012313465675430.00200615673283772
420.9940857258669850.01182854826603030.00591427413301517
430.9814340553615340.03713188927693230.0185659446384661
440.9659987141681360.06800257166372870.0340012858318643
450.9873504144485050.02529917110298950.0126495855514948


Meta Analysis of Goldfeld-Quandt test for Heteroskedasticity
Description# significant tests% significant testsOK/NOK
1% type I error level130.433333333333333NOK
5% type I error level230.766666666666667NOK
10% type I error level260.866666666666667NOK

\begin{tabular}{lllllllll}
\hline
Meta Analysis of Goldfeld-Quandt test for Heteroskedasticity \tabularnewline
Description & # significant tests & % significant tests & OK/NOK \tabularnewline
1% type I error level & 13 & 0.433333333333333 & NOK \tabularnewline
5% type I error level & 23 & 0.766666666666667 & NOK \tabularnewline
10% type I error level & 26 & 0.866666666666667 & NOK \tabularnewline
\hline
\end{tabular}
%Source: https://freestatistics.org/blog/index.php?pk=110717&T=6

[TABLE]
[ROW][C]Meta Analysis of Goldfeld-Quandt test for Heteroskedasticity[/C][/ROW]
[ROW][C]Description[/C][C]# significant tests[/C][C]% significant tests[/C][C]OK/NOK[/C][/ROW]
[ROW][C]1% type I error level[/C][C]13[/C][C]0.433333333333333[/C][C]NOK[/C][/ROW]
[ROW][C]5% type I error level[/C][C]23[/C][C]0.766666666666667[/C][C]NOK[/C][/ROW]
[ROW][C]10% type I error level[/C][C]26[/C][C]0.866666666666667[/C][C]NOK[/C][/ROW]
[/TABLE]
Source: https://freestatistics.org/blog/index.php?pk=110717&T=6

Globally Unique Identifier (entire table): ba.freestatistics.org/blog/index.php?pk=110717&T=6

As an alternative you can also use a QR Code:  

The GUIDs for individual cells are displayed in the table below:

Meta Analysis of Goldfeld-Quandt test for Heteroskedasticity
Description# significant tests% significant testsOK/NOK
1% type I error level130.433333333333333NOK
5% type I error level230.766666666666667NOK
10% type I error level260.866666666666667NOK


Parameters (Session):
par1 = 1 ; par2 = Include Monthly Dummies ; par3 = Linear Trend ;
Parameters (R input):
par1 = 1 ; par2 = Include Monthly Dummies ; par3 = Linear Trend ;
R code (references can be found in the software module):
library(lattice)
library(lmtest)
n25 <- 25 #minimum number of obs. for Goldfeld-Quandt test
par1 <- as.numeric(par1)
x <- t(y)
k <- length(x[1,])
n <- length(x[,1])
x1 <- cbind(x[,par1], x[,1:k!=par1])
mycolnames <- c(colnames(x)[par1], colnames(x)[1:k!=par1])
colnames(x1) <- mycolnames #colnames(x)[par1]
x <- x1
if (par3 == 'First Differences'){
x2 <- array(0, dim=c(n-1,k), dimnames=list(1:(n-1), paste('(1-B)',colnames(x),sep='')))
for (i in 1:n-1) {
for (j in 1:k) {
x2[i,j] <- x[i+1,j] - x[i,j]
}
}
x <- x2
}
if (par2 == 'Include Monthly Dummies'){
x2 <- array(0, dim=c(n,11), dimnames=list(1:n, paste('M', seq(1:11), sep ='')))
for (i in 1:11){
x2[seq(i,n,12),i] <- 1
}
x <- cbind(x, x2)
}
if (par2 == 'Include Quarterly Dummies'){
x2 <- array(0, dim=c(n,3), dimnames=list(1:n, paste('Q', seq(1:3), sep ='')))
for (i in 1:3){
x2[seq(i,n,4),i] <- 1
}
x <- cbind(x, x2)
}
k <- length(x[1,])
if (par3 == 'Linear Trend'){
x <- cbind(x, c(1:n))
colnames(x)[k+1] <- 't'
}
x
k <- length(x[1,])
df <- as.data.frame(x)
(mylm <- lm(df))
(mysum <- summary(mylm))
if (n > n25) {
kp3 <- k + 3
nmkm3 <- n - k - 3
gqarr <- array(NA, dim=c(nmkm3-kp3+1,3))
numgqtests <- 0
numsignificant1 <- 0
numsignificant5 <- 0
numsignificant10 <- 0
for (mypoint in kp3:nmkm3) {
j <- 0
numgqtests <- numgqtests + 1
for (myalt in c('greater', 'two.sided', 'less')) {
j <- j + 1
gqarr[mypoint-kp3+1,j] <- gqtest(mylm, point=mypoint, alternative=myalt)$p.value
}
if (gqarr[mypoint-kp3+1,2] < 0.01) numsignificant1 <- numsignificant1 + 1
if (gqarr[mypoint-kp3+1,2] < 0.05) numsignificant5 <- numsignificant5 + 1
if (gqarr[mypoint-kp3+1,2] < 0.10) numsignificant10 <- numsignificant10 + 1
}
gqarr
}
bitmap(file='test0.png')
plot(x[,1], type='l', main='Actuals and Interpolation', ylab='value of Actuals and Interpolation (dots)', xlab='time or index')
points(x[,1]-mysum$resid)
grid()
dev.off()
bitmap(file='test1.png')
plot(mysum$resid, type='b', pch=19, main='Residuals', ylab='value of Residuals', xlab='time or index')
grid()
dev.off()
bitmap(file='test2.png')
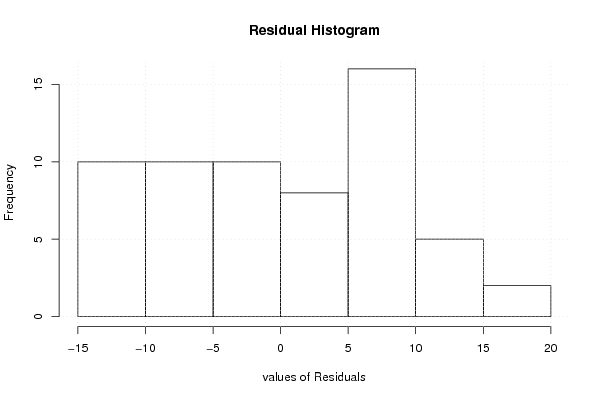
hist(mysum$resid, main='Residual Histogram', xlab='values of Residuals')
grid()
dev.off()
bitmap(file='test3.png')
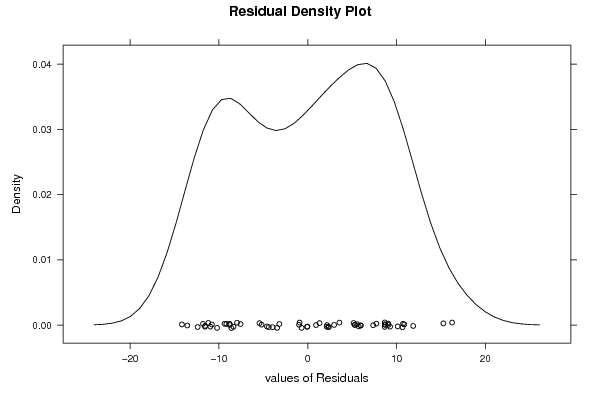
densityplot(~mysum$resid,col='black',main='Residual Density Plot', xlab='values of Residuals')
dev.off()
bitmap(file='test4.png')
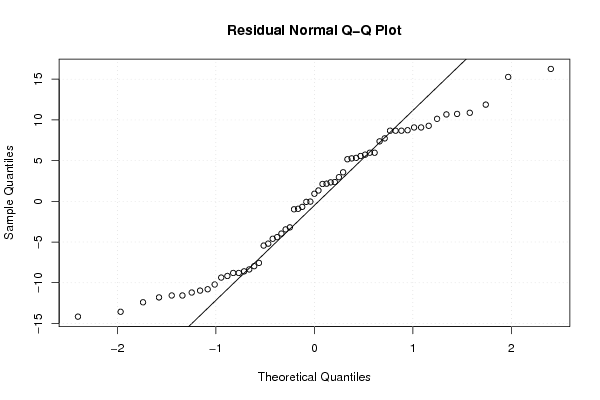
qqnorm(mysum$resid, main='Residual Normal Q-Q Plot')
qqline(mysum$resid)
grid()
dev.off()
(myerror <- as.ts(mysum$resid))
bitmap(file='test5.png')
dum <- cbind(lag(myerror,k=1),myerror)
dum
dum1 <- dum[2:length(myerror),]
dum1
z <- as.data.frame(dum1)
z
plot(z,main=paste('Residual Lag plot, lowess, and regression line'), ylab='values of Residuals', xlab='lagged values of Residuals')
lines(lowess(z))
abline(lm(z))
grid()
dev.off()
bitmap(file='test6.png')
acf(mysum$resid, lag.max=length(mysum$resid)/2, main='Residual Autocorrelation Function')
grid()
dev.off()
bitmap(file='test7.png')
pacf(mysum$resid, lag.max=length(mysum$resid)/2, main='Residual Partial Autocorrelation Function')
grid()
dev.off()
bitmap(file='test8.png')
opar <- par(mfrow = c(2,2), oma = c(0, 0, 1.1, 0))
plot(mylm, las = 1, sub='Residual Diagnostics')
par(opar)
dev.off()
if (n > n25) {
bitmap(file='test9.png')
plot(kp3:nmkm3,gqarr[,2], main='Goldfeld-Quandt test',ylab='2-sided p-value',xlab='breakpoint')
grid()
dev.off()
}
load(file='createtable')
a<-table.start()
a<-table.row.start(a)
a<-table.element(a, 'Multiple Linear Regression - Estimated Regression Equation', 1, TRUE)
a<-table.row.end(a)
myeq <- colnames(x)[1]
myeq <- paste(myeq, '[t] = ', sep='')
for (i in 1:k){
if (mysum$coefficients[i,1] > 0) myeq <- paste(myeq, '+', '')
myeq <- paste(myeq, mysum$coefficients[i,1], sep=' ')
if (rownames(mysum$coefficients)[i] != '(Intercept)') {
myeq <- paste(myeq, rownames(mysum$coefficients)[i], sep='')
if (rownames(mysum$coefficients)[i] != 't') myeq <- paste(myeq, '[t]', sep='')
}
}
myeq <- paste(myeq, ' + e[t]')
a<-table.row.start(a)
a<-table.element(a, myeq)
a<-table.row.end(a)
a<-table.end(a)
table.save(a,file='mytable1.tab')
a<-table.start()
a<-table.row.start(a)
a<-table.element(a,hyperlink('ols1.htm','Multiple Linear Regression - Ordinary Least Squares',''), 6, TRUE)
a<-table.row.end(a)
a<-table.row.start(a)
a<-table.element(a,'Variable',header=TRUE)
a<-table.element(a,'Parameter',header=TRUE)
a<-table.element(a,'S.D.',header=TRUE)
a<-table.element(a,'T-STAT
H0: parameter = 0',header=TRUE)
a<-table.element(a,'2-tail p-value',header=TRUE)
a<-table.element(a,'1-tail p-value',header=TRUE)
a<-table.row.end(a)
for (i in 1:k){
a<-table.row.start(a)
a<-table.element(a,rownames(mysum$coefficients)[i],header=TRUE)
a<-table.element(a,mysum$coefficients[i,1])
a<-table.element(a, round(mysum$coefficients[i,2],6))
a<-table.element(a, round(mysum$coefficients[i,3],4))
a<-table.element(a, round(mysum$coefficients[i,4],6))
a<-table.element(a, round(mysum$coefficients[i,4]/2,6))
a<-table.row.end(a)
}
a<-table.end(a)
table.save(a,file='mytable2.tab')
a<-table.start()
a<-table.row.start(a)
a<-table.element(a, 'Multiple Linear Regression - Regression Statistics', 2, TRUE)
a<-table.row.end(a)
a<-table.row.start(a)
a<-table.element(a, 'Multiple R',1,TRUE)
a<-table.element(a, sqrt(mysum$r.squared))
a<-table.row.end(a)
a<-table.row.start(a)
a<-table.element(a, 'R-squared',1,TRUE)
a<-table.element(a, mysum$r.squared)
a<-table.row.end(a)
a<-table.row.start(a)
a<-table.element(a, 'Adjusted R-squared',1,TRUE)
a<-table.element(a, mysum$adj.r.squared)
a<-table.row.end(a)
a<-table.row.start(a)
a<-table.element(a, 'F-TEST (value)',1,TRUE)
a<-table.element(a, mysum$fstatistic[1])
a<-table.row.end(a)
a<-table.row.start(a)
a<-table.element(a, 'F-TEST (DF numerator)',1,TRUE)
a<-table.element(a, mysum$fstatistic[2])
a<-table.row.end(a)
a<-table.row.start(a)
a<-table.element(a, 'F-TEST (DF denominator)',1,TRUE)
a<-table.element(a, mysum$fstatistic[3])
a<-table.row.end(a)
a<-table.row.start(a)
a<-table.element(a, 'p-value',1,TRUE)
a<-table.element(a, 1-pf(mysum$fstatistic[1],mysum$fstatistic[2],mysum$fstatistic[3]))
a<-table.row.end(a)
a<-table.row.start(a)
a<-table.element(a, 'Multiple Linear Regression - Residual Statistics', 2, TRUE)
a<-table.row.end(a)
a<-table.row.start(a)
a<-table.element(a, 'Residual Standard Deviation',1,TRUE)
a<-table.element(a, mysum$sigma)
a<-table.row.end(a)
a<-table.row.start(a)
a<-table.element(a, 'Sum Squared Residuals',1,TRUE)
a<-table.element(a, sum(myerror*myerror))
a<-table.row.end(a)
a<-table.end(a)
table.save(a,file='mytable3.tab')
a<-table.start()
a<-table.row.start(a)
a<-table.element(a, 'Multiple Linear Regression - Actuals, Interpolation, and Residuals', 4, TRUE)
a<-table.row.end(a)
a<-table.row.start(a)
a<-table.element(a, 'Time or Index', 1, TRUE)
a<-table.element(a, 'Actuals', 1, TRUE)
a<-table.element(a, 'Interpolation
Forecast', 1, TRUE)
a<-table.element(a, 'Residuals
Prediction Error', 1, TRUE)
a<-table.row.end(a)
for (i in 1:n) {
a<-table.row.start(a)
a<-table.element(a,i, 1, TRUE)
a<-table.element(a,x[i])
a<-table.element(a,x[i]-mysum$resid[i])
a<-table.element(a,mysum$resid[i])
a<-table.row.end(a)
}
a<-table.end(a)
table.save(a,file='mytable4.tab')
if (n > n25) {
a<-table.start()
a<-table.row.start(a)
a<-table.element(a,'Goldfeld-Quandt test for Heteroskedasticity',4,TRUE)
a<-table.row.end(a)
a<-table.row.start(a)
a<-table.element(a,'p-values',header=TRUE)
a<-table.element(a,'Alternative Hypothesis',3,header=TRUE)
a<-table.row.end(a)
a<-table.row.start(a)
a<-table.element(a,'breakpoint index',header=TRUE)
a<-table.element(a,'greater',header=TRUE)
a<-table.element(a,'2-sided',header=TRUE)
a<-table.element(a,'less',header=TRUE)
a<-table.row.end(a)
for (mypoint in kp3:nmkm3) {
a<-table.row.start(a)
a<-table.element(a,mypoint,header=TRUE)
a<-table.element(a,gqarr[mypoint-kp3+1,1])
a<-table.element(a,gqarr[mypoint-kp3+1,2])
a<-table.element(a,gqarr[mypoint-kp3+1,3])
a<-table.row.end(a)
}
a<-table.end(a)
table.save(a,file='mytable5.tab')
a<-table.start()
a<-table.row.start(a)
a<-table.element(a,'Meta Analysis of Goldfeld-Quandt test for Heteroskedasticity',4,TRUE)
a<-table.row.end(a)
a<-table.row.start(a)
a<-table.element(a,'Description',header=TRUE)
a<-table.element(a,'# significant tests',header=TRUE)
a<-table.element(a,'% significant tests',header=TRUE)
a<-table.element(a,'OK/NOK',header=TRUE)
a<-table.row.end(a)
a<-table.row.start(a)
a<-table.element(a,'1% type I error level',header=TRUE)
a<-table.element(a,numsignificant1)
a<-table.element(a,numsignificant1/numgqtests)
if (numsignificant1/numgqtests < 0.01) dum <- 'OK' else dum <- 'NOK'
a<-table.element(a,dum)
a<-table.row.end(a)
a<-table.row.start(a)
a<-table.element(a,'5% type I error level',header=TRUE)
a<-table.element(a,numsignificant5)
a<-table.element(a,numsignificant5/numgqtests)
if (numsignificant5/numgqtests < 0.05) dum <- 'OK' else dum <- 'NOK'
a<-table.element(a,dum)
a<-table.row.end(a)
a<-table.row.start(a)
a<-table.element(a,'10% type I error level',header=TRUE)
a<-table.element(a,numsignificant10)
a<-table.element(a,numsignificant10/numgqtests)
if (numsignificant10/numgqtests < 0.1) dum <- 'OK' else dum <- 'NOK'
a<-table.element(a,dum)
a<-table.row.end(a)
a<-table.end(a)
table.save(a,file='mytable6.tab')
}