| Multiple Linear Regression - Estimated Regression Equation |
| slow_wave_sl[t] = + 7.19519299579455 + 3.36679474202788paradoxical_sl[t] + 3.43730615240639max_life[t] -1.65097896744842body_weight[t] -0.880440616381254brain_weight[t] -0.315657209275309gestation_time[t] + 1.33733451027365predation_i[t] + 0.314979429813487sleep_i[t] -1.8837396565904overall_i[t] + e[t] |
| Multiple Linear Regression - Ordinary Least Squares | |||||
| Variable | Parameter | S.D. | T-STAT H0: parameter = 0 | 2-tail p-value | 1-tail p-value |
| (Intercept) | 7.19519299579455 | 4.516729 | 1.593 | 0.121641 | 0.060821 |
| paradoxical_sl | 3.36679474202788 | 2.745137 | 1.2265 | 0.229566 | 0.114783 |
| max_life | 3.43730615240639 | 1.782017 | 1.9289 | 0.063254 | 0.031627 |
| body_weight | -1.65097896744842 | 1.157343 | -1.4265 | 0.164042 | 0.082021 |
| brain_weight | -0.880440616381254 | 1.620254 | -0.5434 | 0.590872 | 0.295436 |
| gestation_time | -0.315657209275309 | 1.911325 | -0.1652 | 0.869933 | 0.434967 |
| predation_i | 1.33733451027365 | 0.993734 | 1.3458 | 0.188461 | 0.09423 |
| sleep_i | 0.314979429813487 | 0.626066 | 0.5031 | 0.618562 | 0.309281 |
| overall_i | -1.8837396565904 | 1.344971 | -1.4006 | 0.171599 | 0.085799 |
| Multiple Linear Regression - Regression Statistics | |
| Multiple R | 0.827535230258193 |
| R-squared | 0.684814557318481 |
| Adjusted R-squared | 0.600765105936743 |
| F-TEST (value) | 8.14775761245805 |
| F-TEST (DF numerator) | 8 |
| F-TEST (DF denominator) | 30 |
| p-value | 8.60521098511313e-06 |
| Multiple Linear Regression - Residual Statistics | |
| Residual Standard Deviation | 2.50737645315805 |
| Sum Squared Residuals | 188.608100335543 |
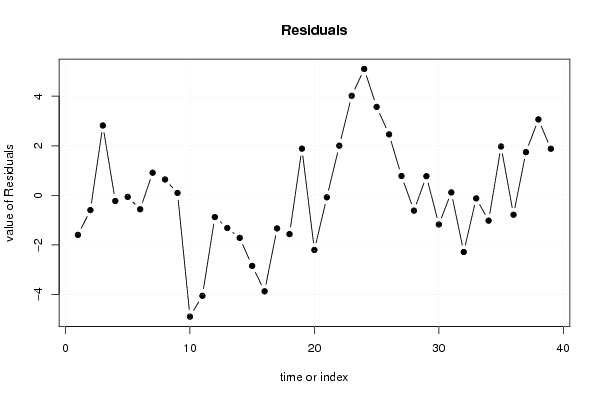
| Multiple Linear Regression - Actuals, Interpolation, and Residuals | |||
| Time or Index | Actuals | Interpolation Forecast | Residuals Prediction Error |
| 1 | 6.3 | 7.89580447858142 | -1.59580447858142 |
| 2 | 2.1 | 2.69658009911775 | -0.596580099117745 |
| 3 | 9.1 | 6.28217128635656 | 2.81782871364344 |
| 4 | 15.8 | 16.0269484710272 | -0.226948471027212 |
| 5 | 5.2 | 5.26249293291376 | -0.0624929329137551 |
| 6 | 10.9 | 11.4621261596098 | -0.562126159609779 |
| 7 | 8.3 | 7.38744267930867 | 0.912557320691332 |
| 8 | 11 | 10.3614264823333 | 0.638573517666651 |
| 9 | 3.2 | 3.10466202956652 | 0.0953379704334817 |
| 10 | 6.3 | 11.1938874110275 | -4.89388741102751 |
| 11 | 6.6 | 10.6523611499443 | -4.05236114994431 |
| 12 | 9.5 | 10.3770581634728 | -0.877058163472793 |
| 13 | 3.3 | 4.616748165744 | -1.31674816574400 |
| 14 | 11 | 12.7159103188329 | -1.71591031883285 |
| 15 | 4.7 | 7.54681065752132 | -2.84681065752132 |
| 16 | 10.4 | 14.2719906123763 | -3.87199061237634 |
| 17 | 7.4 | 8.73478335079519 | -1.33478335079519 |
| 18 | 2.1 | 3.66476364640126 | -1.56476364640126 |
| 19 | 17.9 | 16.0172259551301 | 1.88277404486992 |
| 20 | 6.1 | 8.30425895410857 | -2.20425895410858 |
| 21 | 11.9 | 11.9797381420859 | -0.0797381420859159 |
| 22 | 13.8 | 11.7977816522966 | 2.00221834770342 |
| 23 | 14.3 | 10.2852261457175 | 4.01477385428248 |
| 24 | 15.2 | 10.1020748797700 | 5.09792512022995 |
| 25 | 10 | 6.43296801568258 | 3.56703198431742 |
| 26 | 11.9 | 9.44092968369552 | 2.45907031630448 |
| 27 | 6.5 | 5.72224181110631 | 0.777758188893687 |
| 28 | 7.5 | 8.11768636346933 | -0.61768636346933 |
| 29 | 10.6 | 9.8282295932576 | 0.771770406742397 |
| 30 | 7.4 | 8.57552835820276 | -1.17552835820276 |
| 31 | 8.4 | 8.28352818624708 | 0.116471813752919 |
| 32 | 5.7 | 7.98733730490201 | -2.28733730490201 |
| 33 | 4.9 | 5.02211161876452 | -0.122111618764523 |
| 34 | 3.2 | 4.22072100537454 | -1.02072100537454 |
| 35 | 11 | 9.0294159061704 | 1.97058409382961 |
| 36 | 4.9 | 5.68237661528557 | -0.782376615285571 |
| 37 | 13.2 | 11.4578087146267 | 1.74219128537329 |
| 38 | 9.7 | 6.63891893149884 | 3.06108106850116 |
| 39 | 12.8 | 10.9199240676769 | 1.88007593232306 |
| Goldfeld-Quandt test for Heteroskedasticity | |||
| p-values | Alternative Hypothesis | ||
| breakpoint index | greater | 2-sided | less |
| 12 | 0.0297158298932441 | 0.0594316597864883 | 0.970284170106756 |
| 13 | 0.0605689334568977 | 0.121137866913795 | 0.939431066543102 |
| 14 | 0.0247739769265243 | 0.0495479538530486 | 0.975226023073476 |
| 15 | 0.0151794925406772 | 0.0303589850813544 | 0.984820507459323 |
| 16 | 0.450376711488359 | 0.900753422976717 | 0.549623288511641 |
| 17 | 0.342066127106946 | 0.684132254213892 | 0.657933872893054 |
| 18 | 0.329419603682306 | 0.658839207364613 | 0.670580396317694 |
| 19 | 0.229275160535754 | 0.458550321071507 | 0.770724839464246 |
| 20 | 0.463631916408468 | 0.927263832816936 | 0.536368083591532 |
| 21 | 0.489587473093327 | 0.979174946186653 | 0.510412526906673 |
| 22 | 0.622229258918395 | 0.75554148216321 | 0.377770741081605 |
| 23 | 0.727030459285787 | 0.545939081428426 | 0.272969540714213 |
| 24 | 0.844470163623206 | 0.311059672753588 | 0.155529836376794 |
| 25 | 0.916201265418629 | 0.167597469162742 | 0.0837987345813711 |
| 26 | 0.884110697014314 | 0.231778605971371 | 0.115889302985686 |
| 27 | 0.8062656576367 | 0.3874686847266 | 0.1937343423633 |
| Meta Analysis of Goldfeld-Quandt test for Heteroskedasticity | |||
| Description | # significant tests | % significant tests | OK/NOK |
| 1% type I error level | 0 | 0 | OK |
| 5% type I error level | 2 | 0.125 | NOK |
| 10% type I error level | 3 | 0.1875 | NOK |