Free Statistics

of Irreproducible Research!

Author's title

Author*The author of this computation has been verified*
R Software Modulerwasp_smp.wasp
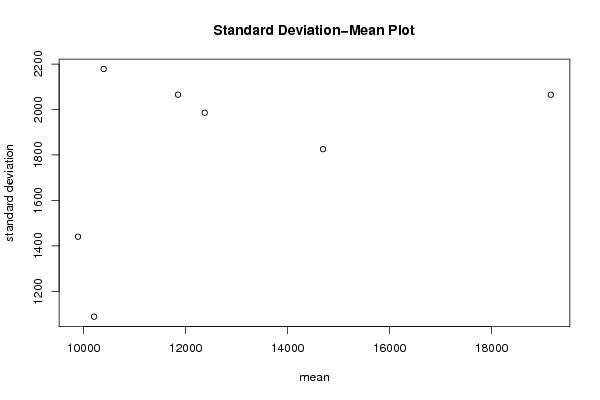
Title produced by softwareStandard Deviation-Mean Plot
Date of computationWed, 15 Dec 2010 17:34:46 +0000
Cite this page as followsStatistical Computations at FreeStatistics.org, Office for Research Development and Education, URL https://freestatistics.org/blog/index.php?v=date/2010/Dec/15/t1292434369fthv8eqf0vxte3i.htm/, Retrieved Fri, 03 May 2024 08:54:33 +0000
Statistical Computations at FreeStatistics.org, Office for Research Development and Education, URL https://freestatistics.org/blog/index.php?pk=110611, Retrieved Fri, 03 May 2024 08:54:33 +0000
QR Codes:

Original text written by user:
IsPrivate?No (this computation is public)
User-defined keywords
Estimated Impact148
Family? (F = Feedback message, R = changed R code, M = changed R Module, P = changed Parameters, D = changed Data)
-       [Standard Deviation-Mean Plot] [standard mean] [2010-12-15 17:34:46] [4c854bb223ec27caaa7bcfc5e77b0dbd] [Current]
Feedback Forum

Post a new message
Dataseries X:
12231
13604
15107
10853
13698
11536
8879
11005
13656
12631
10931
8064
12332
12452
14029
10003
12388
10492
9114
9304
9660
10569
8356
5998
10408
11420
11538
10860
10412
9521
7602
8197
10449
11561
8603
8080
10792
11943
11179
9939
10065
11021
9226
9554
11468
9937
8928
8395
11996
12385
15277
12657
11482
16797
11047
11794
13077
11725
10921
9334
11431
13085
16394
15701
14936
18282
12824
14784
16061
14814
14375
13644
16397
19254
21943
16731
22065
20937
18242
19017
20372
20561
18267
16170


Summary of computational transaction
Raw Inputview raw input (R code)
Raw Outputview raw output of R engine
Computing time2 seconds
R Server'RServer@AstonUniversity' @ vre.aston.ac.uk

\begin{tabular}{lllllllll}
\hline
Summary of computational transaction \tabularnewline
Raw Input & view raw input (R code)  \tabularnewline
Raw Output & view raw output of R engine  \tabularnewline
Computing time & 2 seconds \tabularnewline
R Server & 'RServer@AstonUniversity' @ vre.aston.ac.uk \tabularnewline
\hline
\end{tabular}
%Source: https://freestatistics.org/blog/index.php?pk=110611&T=0

[TABLE]
[ROW][C]Summary of computational transaction[/C][/ROW]
[ROW][C]Raw Input[/C][C]view raw input (R code) [/C][/ROW]
[ROW][C]Raw Output[/C][C]view raw output of R engine [/C][/ROW]
[ROW][C]Computing time[/C][C]2 seconds[/C][/ROW]
[ROW][C]R Server[/C][C]'RServer@AstonUniversity' @ vre.aston.ac.uk[/C][/ROW]
[/TABLE]
Source: https://freestatistics.org/blog/index.php?pk=110611&T=0

Globally Unique Identifier (entire table): ba.freestatistics.org/blog/index.php?pk=110611&T=0

As an alternative you can also use a QR Code:  

The GUIDs for individual cells are displayed in the table below:

Summary of computational transaction
Raw Inputview raw input (R code)
Raw Outputview raw output of R engine
Computing time2 seconds
R Server'RServer@AstonUniversity' @ vre.aston.ac.uk


Standard Deviation-Mean Plot
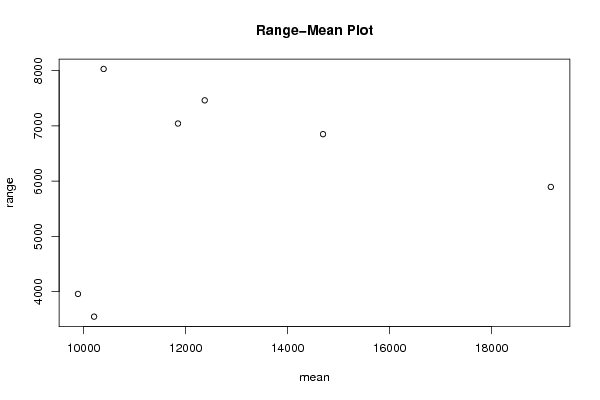
SectionMeanStandard DeviationRange
111849.58333333332065.479317399737043
210391.41666666672178.761427063698031
39887.583333333331440.106906279933959
410203.91666666671088.207488431683548
512374.33333333331985.736471270387463
614694.251825.694295080896851
7191632065.237120438325895

\begin{tabular}{lllllllll}
\hline
Standard Deviation-Mean Plot \tabularnewline
Section & Mean & Standard Deviation & Range \tabularnewline
1 & 11849.5833333333 & 2065.47931739973 & 7043 \tabularnewline
2 & 10391.4166666667 & 2178.76142706369 & 8031 \tabularnewline
3 & 9887.58333333333 & 1440.10690627993 & 3959 \tabularnewline
4 & 10203.9166666667 & 1088.20748843168 & 3548 \tabularnewline
5 & 12374.3333333333 & 1985.73647127038 & 7463 \tabularnewline
6 & 14694.25 & 1825.69429508089 & 6851 \tabularnewline
7 & 19163 & 2065.23712043832 & 5895 \tabularnewline
\hline
\end{tabular}
%Source: https://freestatistics.org/blog/index.php?pk=110611&T=1

[TABLE]
[ROW][C]Standard Deviation-Mean Plot[/C][/ROW]
[ROW][C]Section[/C][C]Mean[/C][C]Standard Deviation[/C][C]Range[/C][/ROW]
[ROW][C]1[/C][C]11849.5833333333[/C][C]2065.47931739973[/C][C]7043[/C][/ROW]
[ROW][C]2[/C][C]10391.4166666667[/C][C]2178.76142706369[/C][C]8031[/C][/ROW]
[ROW][C]3[/C][C]9887.58333333333[/C][C]1440.10690627993[/C][C]3959[/C][/ROW]
[ROW][C]4[/C][C]10203.9166666667[/C][C]1088.20748843168[/C][C]3548[/C][/ROW]
[ROW][C]5[/C][C]12374.3333333333[/C][C]1985.73647127038[/C][C]7463[/C][/ROW]
[ROW][C]6[/C][C]14694.25[/C][C]1825.69429508089[/C][C]6851[/C][/ROW]
[ROW][C]7[/C][C]19163[/C][C]2065.23712043832[/C][C]5895[/C][/ROW]
[/TABLE]
Source: https://freestatistics.org/blog/index.php?pk=110611&T=1

Globally Unique Identifier (entire table): ba.freestatistics.org/blog/index.php?pk=110611&T=1

As an alternative you can also use a QR Code:  

The GUIDs for individual cells are displayed in the table below:

Standard Deviation-Mean Plot
SectionMeanStandard DeviationRange
111849.58333333332065.479317399737043
210391.41666666672178.761427063698031
39887.583333333331440.106906279933959
410203.91666666671088.207488431683548
512374.33333333331985.736471270387463
614694.251825.694295080896851
7191632065.237120438325895


Regression: S.E.(k) = alpha + beta * Mean(k)
alpha1156.31969149193
beta0.0514315173158547
S.D.0.048625139731945
T-STAT1.05771454024359
p-value0.338586734897739

\begin{tabular}{lllllllll}
\hline
Regression: S.E.(k) = alpha + beta * Mean(k) \tabularnewline
alpha & 1156.31969149193 \tabularnewline
beta & 0.0514315173158547 \tabularnewline
S.D. & 0.048625139731945 \tabularnewline
T-STAT & 1.05771454024359 \tabularnewline
p-value & 0.338586734897739 \tabularnewline
\hline
\end{tabular}
%Source: https://freestatistics.org/blog/index.php?pk=110611&T=2

[TABLE]
[ROW][C]Regression: S.E.(k) = alpha + beta * Mean(k)[/C][/ROW]
[ROW][C]alpha[/C][C]1156.31969149193[/C][/ROW]
[ROW][C]beta[/C][C]0.0514315173158547[/C][/ROW]
[ROW][C]S.D.[/C][C]0.048625139731945[/C][/ROW]
[ROW][C]T-STAT[/C][C]1.05771454024359[/C][/ROW]
[ROW][C]p-value[/C][C]0.338586734897739[/C][/ROW]
[/TABLE]
Source: https://freestatistics.org/blog/index.php?pk=110611&T=2

Globally Unique Identifier (entire table): ba.freestatistics.org/blog/index.php?pk=110611&T=2

As an alternative you can also use a QR Code:  

The GUIDs for individual cells are displayed in the table below:

Regression: S.E.(k) = alpha + beta * Mean(k)
alpha1156.31969149193
beta0.0514315173158547
S.D.0.048625139731945
T-STAT1.05771454024359
p-value0.338586734897739


Regression: ln S.E.(k) = alpha + beta * ln Mean(k)
alpha2.77884028730348
beta0.498485412945976
S.D.0.419284496180291
T-STAT1.18889540988806
p-value0.287861260998572
Lambda0.501514587054024

\begin{tabular}{lllllllll}
\hline
Regression: ln S.E.(k) = alpha + beta * ln Mean(k) \tabularnewline
alpha & 2.77884028730348 \tabularnewline
beta & 0.498485412945976 \tabularnewline
S.D. & 0.419284496180291 \tabularnewline
T-STAT & 1.18889540988806 \tabularnewline
p-value & 0.287861260998572 \tabularnewline
Lambda & 0.501514587054024 \tabularnewline
\hline
\end{tabular}
%Source: https://freestatistics.org/blog/index.php?pk=110611&T=3

[TABLE]
[ROW][C]Regression: ln S.E.(k) = alpha + beta * ln Mean(k)[/C][/ROW]
[ROW][C]alpha[/C][C]2.77884028730348[/C][/ROW]
[ROW][C]beta[/C][C]0.498485412945976[/C][/ROW]
[ROW][C]S.D.[/C][C]0.419284496180291[/C][/ROW]
[ROW][C]T-STAT[/C][C]1.18889540988806[/C][/ROW]
[ROW][C]p-value[/C][C]0.287861260998572[/C][/ROW]
[ROW][C]Lambda[/C][C]0.501514587054024[/C][/ROW]
[/TABLE]
Source: https://freestatistics.org/blog/index.php?pk=110611&T=3

Globally Unique Identifier (entire table): ba.freestatistics.org/blog/index.php?pk=110611&T=3

As an alternative you can also use a QR Code:  

The GUIDs for individual cells are displayed in the table below:

Regression: ln S.E.(k) = alpha + beta * ln Mean(k)
alpha2.77884028730348
beta0.498485412945976
S.D.0.419284496180291
T-STAT1.18889540988806
p-value0.287861260998572
Lambda0.501514587054024


Parameters (Session):
par1 = 12 ;
Parameters (R input):
par1 = 12 ;
R code (references can be found in the software module):
par1 <- as.numeric(par1)
(n <- length(x))
(np <- floor(n / par1))
arr <- array(NA,dim=c(par1,np))
j <- 0
k <- 1
for (i in 1:(np*par1))
{
j = j + 1
arr[j,k] <- x[i]
if (j == par1) {
j = 0
k=k+1
}
}
arr
arr.mean <- array(NA,dim=np)
arr.sd <- array(NA,dim=np)
arr.range <- array(NA,dim=np)
for (j in 1:np)
{
arr.mean[j] <- mean(arr[,j],na.rm=TRUE)
arr.sd[j] <- sd(arr[,j],na.rm=TRUE)
arr.range[j] <- max(arr[,j],na.rm=TRUE) - min(arr[,j],na.rm=TRUE)
}
arr.mean
arr.sd
arr.range
(lm1 <- lm(arr.sd~arr.mean))
(lnlm1 <- lm(log(arr.sd)~log(arr.mean)))
(lm2 <- lm(arr.range~arr.mean))
bitmap(file='test1.png')
plot(arr.mean,arr.sd,main='Standard Deviation-Mean Plot',xlab='mean',ylab='standard deviation')
dev.off()
bitmap(file='test2.png')
plot(arr.mean,arr.range,main='Range-Mean Plot',xlab='mean',ylab='range')
dev.off()
load(file='createtable')
a<-table.start()
a<-table.row.start(a)
a<-table.element(a,'Standard Deviation-Mean Plot',4,TRUE)
a<-table.row.end(a)
a<-table.row.start(a)
a<-table.element(a,'Section',header=TRUE)
a<-table.element(a,'Mean',header=TRUE)
a<-table.element(a,'Standard Deviation',header=TRUE)
a<-table.element(a,'Range',header=TRUE)
a<-table.row.end(a)
for (j in 1:np) {
a<-table.row.start(a)
a<-table.element(a,j,header=TRUE)
a<-table.element(a,arr.mean[j])
a<-table.element(a,arr.sd[j] )
a<-table.element(a,arr.range[j] )
a<-table.row.end(a)
}
a<-table.end(a)
table.save(a,file='mytable.tab')
a<-table.start()
a<-table.row.start(a)
a<-table.element(a,'Regression: S.E.(k) = alpha + beta * Mean(k)',2,TRUE)
a<-table.row.end(a)
a<-table.row.start(a)
a<-table.element(a,'alpha',header=TRUE)
a<-table.element(a,lm1$coefficients[[1]])
a<-table.row.end(a)
a<-table.row.start(a)
a<-table.element(a,'beta',header=TRUE)
a<-table.element(a,lm1$coefficients[[2]])
a<-table.row.end(a)
a<-table.row.start(a)
a<-table.element(a,'S.D.',header=TRUE)
a<-table.element(a,summary(lm1)$coefficients[2,2])
a<-table.row.end(a)
a<-table.row.start(a)
a<-table.element(a,'T-STAT',header=TRUE)
a<-table.element(a,summary(lm1)$coefficients[2,3])
a<-table.row.end(a)
a<-table.row.start(a)
a<-table.element(a,'p-value',header=TRUE)
a<-table.element(a,summary(lm1)$coefficients[2,4])
a<-table.row.end(a)
a<-table.end(a)
table.save(a,file='mytable1.tab')
a<-table.start()
a<-table.row.start(a)
a<-table.element(a,'Regression: ln S.E.(k) = alpha + beta * ln Mean(k)',2,TRUE)
a<-table.row.end(a)
a<-table.row.start(a)
a<-table.element(a,'alpha',header=TRUE)
a<-table.element(a,lnlm1$coefficients[[1]])
a<-table.row.end(a)
a<-table.row.start(a)
a<-table.element(a,'beta',header=TRUE)
a<-table.element(a,lnlm1$coefficients[[2]])
a<-table.row.end(a)
a<-table.row.start(a)
a<-table.element(a,'S.D.',header=TRUE)
a<-table.element(a,summary(lnlm1)$coefficients[2,2])
a<-table.row.end(a)
a<-table.row.start(a)
a<-table.element(a,'T-STAT',header=TRUE)
a<-table.element(a,summary(lnlm1)$coefficients[2,3])
a<-table.row.end(a)
a<-table.row.start(a)
a<-table.element(a,'p-value',header=TRUE)
a<-table.element(a,summary(lnlm1)$coefficients[2,4])
a<-table.row.end(a)
a<-table.row.start(a)
a<-table.element(a,'Lambda',header=TRUE)
a<-table.element(a,1-lnlm1$coefficients[[2]])
a<-table.row.end(a)
a<-table.end(a)
table.save(a,file='mytable2.tab')