Free Statistics

of Irreproducible Research!

Author's title

Author*The author of this computation has been verified*
R Software Modulerwasp_autocorrelation.wasp
Title produced by software(Partial) Autocorrelation Function
Date of computationWed, 15 Dec 2010 17:17:28 +0000
Cite this page as followsStatistical Computations at FreeStatistics.org, Office for Research Development and Education, URL https://freestatistics.org/blog/index.php?v=date/2010/Dec/15/t1292433421vnc13pndbisr8x7.htm/, Retrieved Fri, 03 May 2024 11:35:05 +0000
Statistical Computations at FreeStatistics.org, Office for Research Development and Education, URL https://freestatistics.org/blog/index.php?pk=110599, Retrieved Fri, 03 May 2024 11:35:05 +0000
QR Codes:

Original text written by user:
IsPrivate?No (this computation is public)
User-defined keywords
Estimated Impact118
Family? (F = Feedback message, R = changed R code, M = changed R Module, P = changed Parameters, D = changed Data)
-       [(Partial) Autocorrelation Function] [ACF 3] [2010-12-15 17:17:28] [4c854bb223ec27caaa7bcfc5e77b0dbd] [Current]
Feedback Forum

Post a new message
Dataseries X:
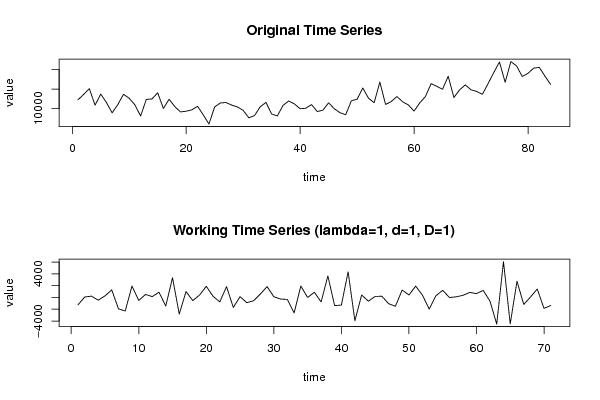
12231
13604
15107
10853
13698
11536
8879
11005
13656
12631
10931
8064
12332
12452
14029
10003
12388
10492
9114
9304
9660
10569
8356
5998
10408
11420
11538
10860
10412
9521
7602
8197
10449
11561
8603
8080
10792
11943
11179
9939
10065
11021
9226
9554
11468
9937
8928
8395
11996
12385
15277
12657
11482
16797
11047
11794
13077
11725
10921
9334
11431
13085
16394
15701
14936
18282
12824
14784
16061
14814
14375
13644
16397
19254
21943
16731
22065
20937
18242
19017
20372
20561
18267
16170


Summary of computational transaction
Raw Inputview raw input (R code)
Raw Outputview raw output of R engine
Computing time2 seconds
R Server'George Udny Yule' @ 72.249.76.132

\begin{tabular}{lllllllll}
\hline
Summary of computational transaction \tabularnewline
Raw Input & view raw input (R code)  \tabularnewline
Raw Output & view raw output of R engine  \tabularnewline
Computing time & 2 seconds \tabularnewline
R Server & 'George Udny Yule' @ 72.249.76.132 \tabularnewline
\hline
\end{tabular}
%Source: https://freestatistics.org/blog/index.php?pk=110599&T=0

[TABLE]
[ROW][C]Summary of computational transaction[/C][/ROW]
[ROW][C]Raw Input[/C][C]view raw input (R code) [/C][/ROW]
[ROW][C]Raw Output[/C][C]view raw output of R engine [/C][/ROW]
[ROW][C]Computing time[/C][C]2 seconds[/C][/ROW]
[ROW][C]R Server[/C][C]'George Udny Yule' @ 72.249.76.132[/C][/ROW]
[/TABLE]
Source: https://freestatistics.org/blog/index.php?pk=110599&T=0

Globally Unique Identifier (entire table): ba.freestatistics.org/blog/index.php?pk=110599&T=0

As an alternative you can also use a QR Code:  

The GUIDs for individual cells are displayed in the table below:

Summary of computational transaction
Raw Inputview raw input (R code)
Raw Outputview raw output of R engine
Computing time2 seconds
R Server'George Udny Yule' @ 72.249.76.132


Autocorrelation Function
Time lag kACF(k)T-STATP-value
1-0.54952-4.63038e-06
20.1505211.26830.104415
30.0066810.05630.477631
4-0.127243-1.07220.143637
50.0618360.5210.301981
60.0248280.20920.417444
7-0.071622-0.60350.27405
80.0029720.0250.490046
90.0968550.81610.208583
10-0.009269-0.07810.468983
11-0.009418-0.07940.468486
12-0.074181-0.62510.266967
13-0.047145-0.39730.346186
140.0026710.02250.491053
150.085950.72420.235653
16-0.085343-0.71910.237215
170.0587440.4950.311069
180.0244420.2060.418709
19-0.064529-0.54370.294165
200.0107290.09040.464109
210.1396421.17660.121634
22-0.311082-2.62120.005355
230.362213.0520.001598
24-0.190444-1.60470.056499
25-0.055241-0.46550.32151
260.2462192.07470.020821
27-0.268748-2.26450.013299
280.143771.21140.114873
29-0.066104-0.5570.289638
300.0634970.5350.297149
31-0.083475-0.70340.242061
320.1752861.4770.072051
33-0.193172-1.62770.05401
34-0.010852-0.09140.463699
350.0652320.54970.292141
36-0.026677-0.22480.411397
370.0049970.04210.483267
380.0038460.03240.487121
390.051660.43530.332334
40-0.045049-0.37960.352691
410.1059890.89310.187417
42-0.114179-0.96210.169635
43-0.000131-0.00110.499561
440.0099630.08390.466667
45-0.005236-0.04410.482467
460.0621190.52340.301155
470.045160.38050.352345
48-0.176668-1.48860.070507
490.2099511.76910.040588
50-0.18145-1.52890.065363
510.071390.60150.274698
52-0.038419-0.32370.373548
53-0.001185-0.010.496032
54-0.033228-0.280.390152
550.1037210.8740.192542
56-0.074042-0.62390.26735
57-0.007005-0.0590.476549
580.0235290.19830.421704
59-0.030632-0.25810.398533
600.0098020.08260.467203

\begin{tabular}{lllllllll}
\hline
Autocorrelation Function \tabularnewline
Time lag k & ACF(k) & T-STAT & P-value \tabularnewline
1 & -0.54952 & -4.6303 & 8e-06 \tabularnewline
2 & 0.150521 & 1.2683 & 0.104415 \tabularnewline
3 & 0.006681 & 0.0563 & 0.477631 \tabularnewline
4 & -0.127243 & -1.0722 & 0.143637 \tabularnewline
5 & 0.061836 & 0.521 & 0.301981 \tabularnewline
6 & 0.024828 & 0.2092 & 0.417444 \tabularnewline
7 & -0.071622 & -0.6035 & 0.27405 \tabularnewline
8 & 0.002972 & 0.025 & 0.490046 \tabularnewline
9 & 0.096855 & 0.8161 & 0.208583 \tabularnewline
10 & -0.009269 & -0.0781 & 0.468983 \tabularnewline
11 & -0.009418 & -0.0794 & 0.468486 \tabularnewline
12 & -0.074181 & -0.6251 & 0.266967 \tabularnewline
13 & -0.047145 & -0.3973 & 0.346186 \tabularnewline
14 & 0.002671 & 0.0225 & 0.491053 \tabularnewline
15 & 0.08595 & 0.7242 & 0.235653 \tabularnewline
16 & -0.085343 & -0.7191 & 0.237215 \tabularnewline
17 & 0.058744 & 0.495 & 0.311069 \tabularnewline
18 & 0.024442 & 0.206 & 0.418709 \tabularnewline
19 & -0.064529 & -0.5437 & 0.294165 \tabularnewline
20 & 0.010729 & 0.0904 & 0.464109 \tabularnewline
21 & 0.139642 & 1.1766 & 0.121634 \tabularnewline
22 & -0.311082 & -2.6212 & 0.005355 \tabularnewline
23 & 0.36221 & 3.052 & 0.001598 \tabularnewline
24 & -0.190444 & -1.6047 & 0.056499 \tabularnewline
25 & -0.055241 & -0.4655 & 0.32151 \tabularnewline
26 & 0.246219 & 2.0747 & 0.020821 \tabularnewline
27 & -0.268748 & -2.2645 & 0.013299 \tabularnewline
28 & 0.14377 & 1.2114 & 0.114873 \tabularnewline
29 & -0.066104 & -0.557 & 0.289638 \tabularnewline
30 & 0.063497 & 0.535 & 0.297149 \tabularnewline
31 & -0.083475 & -0.7034 & 0.242061 \tabularnewline
32 & 0.175286 & 1.477 & 0.072051 \tabularnewline
33 & -0.193172 & -1.6277 & 0.05401 \tabularnewline
34 & -0.010852 & -0.0914 & 0.463699 \tabularnewline
35 & 0.065232 & 0.5497 & 0.292141 \tabularnewline
36 & -0.026677 & -0.2248 & 0.411397 \tabularnewline
37 & 0.004997 & 0.0421 & 0.483267 \tabularnewline
38 & 0.003846 & 0.0324 & 0.487121 \tabularnewline
39 & 0.05166 & 0.4353 & 0.332334 \tabularnewline
40 & -0.045049 & -0.3796 & 0.352691 \tabularnewline
41 & 0.105989 & 0.8931 & 0.187417 \tabularnewline
42 & -0.114179 & -0.9621 & 0.169635 \tabularnewline
43 & -0.000131 & -0.0011 & 0.499561 \tabularnewline
44 & 0.009963 & 0.0839 & 0.466667 \tabularnewline
45 & -0.005236 & -0.0441 & 0.482467 \tabularnewline
46 & 0.062119 & 0.5234 & 0.301155 \tabularnewline
47 & 0.04516 & 0.3805 & 0.352345 \tabularnewline
48 & -0.176668 & -1.4886 & 0.070507 \tabularnewline
49 & 0.209951 & 1.7691 & 0.040588 \tabularnewline
50 & -0.18145 & -1.5289 & 0.065363 \tabularnewline
51 & 0.07139 & 0.6015 & 0.274698 \tabularnewline
52 & -0.038419 & -0.3237 & 0.373548 \tabularnewline
53 & -0.001185 & -0.01 & 0.496032 \tabularnewline
54 & -0.033228 & -0.28 & 0.390152 \tabularnewline
55 & 0.103721 & 0.874 & 0.192542 \tabularnewline
56 & -0.074042 & -0.6239 & 0.26735 \tabularnewline
57 & -0.007005 & -0.059 & 0.476549 \tabularnewline
58 & 0.023529 & 0.1983 & 0.421704 \tabularnewline
59 & -0.030632 & -0.2581 & 0.398533 \tabularnewline
60 & 0.009802 & 0.0826 & 0.467203 \tabularnewline
\hline
\end{tabular}
%Source: https://freestatistics.org/blog/index.php?pk=110599&T=1

[TABLE]
[ROW][C]Autocorrelation Function[/C][/ROW]
[ROW][C]Time lag k[/C][C]ACF(k)[/C][C]T-STAT[/C][C]P-value[/C][/ROW]
[ROW][C]1[/C][C]-0.54952[/C][C]-4.6303[/C][C]8e-06[/C][/ROW]
[ROW][C]2[/C][C]0.150521[/C][C]1.2683[/C][C]0.104415[/C][/ROW]
[ROW][C]3[/C][C]0.006681[/C][C]0.0563[/C][C]0.477631[/C][/ROW]
[ROW][C]4[/C][C]-0.127243[/C][C]-1.0722[/C][C]0.143637[/C][/ROW]
[ROW][C]5[/C][C]0.061836[/C][C]0.521[/C][C]0.301981[/C][/ROW]
[ROW][C]6[/C][C]0.024828[/C][C]0.2092[/C][C]0.417444[/C][/ROW]
[ROW][C]7[/C][C]-0.071622[/C][C]-0.6035[/C][C]0.27405[/C][/ROW]
[ROW][C]8[/C][C]0.002972[/C][C]0.025[/C][C]0.490046[/C][/ROW]
[ROW][C]9[/C][C]0.096855[/C][C]0.8161[/C][C]0.208583[/C][/ROW]
[ROW][C]10[/C][C]-0.009269[/C][C]-0.0781[/C][C]0.468983[/C][/ROW]
[ROW][C]11[/C][C]-0.009418[/C][C]-0.0794[/C][C]0.468486[/C][/ROW]
[ROW][C]12[/C][C]-0.074181[/C][C]-0.6251[/C][C]0.266967[/C][/ROW]
[ROW][C]13[/C][C]-0.047145[/C][C]-0.3973[/C][C]0.346186[/C][/ROW]
[ROW][C]14[/C][C]0.002671[/C][C]0.0225[/C][C]0.491053[/C][/ROW]
[ROW][C]15[/C][C]0.08595[/C][C]0.7242[/C][C]0.235653[/C][/ROW]
[ROW][C]16[/C][C]-0.085343[/C][C]-0.7191[/C][C]0.237215[/C][/ROW]
[ROW][C]17[/C][C]0.058744[/C][C]0.495[/C][C]0.311069[/C][/ROW]
[ROW][C]18[/C][C]0.024442[/C][C]0.206[/C][C]0.418709[/C][/ROW]
[ROW][C]19[/C][C]-0.064529[/C][C]-0.5437[/C][C]0.294165[/C][/ROW]
[ROW][C]20[/C][C]0.010729[/C][C]0.0904[/C][C]0.464109[/C][/ROW]
[ROW][C]21[/C][C]0.139642[/C][C]1.1766[/C][C]0.121634[/C][/ROW]
[ROW][C]22[/C][C]-0.311082[/C][C]-2.6212[/C][C]0.005355[/C][/ROW]
[ROW][C]23[/C][C]0.36221[/C][C]3.052[/C][C]0.001598[/C][/ROW]
[ROW][C]24[/C][C]-0.190444[/C][C]-1.6047[/C][C]0.056499[/C][/ROW]
[ROW][C]25[/C][C]-0.055241[/C][C]-0.4655[/C][C]0.32151[/C][/ROW]
[ROW][C]26[/C][C]0.246219[/C][C]2.0747[/C][C]0.020821[/C][/ROW]
[ROW][C]27[/C][C]-0.268748[/C][C]-2.2645[/C][C]0.013299[/C][/ROW]
[ROW][C]28[/C][C]0.14377[/C][C]1.2114[/C][C]0.114873[/C][/ROW]
[ROW][C]29[/C][C]-0.066104[/C][C]-0.557[/C][C]0.289638[/C][/ROW]
[ROW][C]30[/C][C]0.063497[/C][C]0.535[/C][C]0.297149[/C][/ROW]
[ROW][C]31[/C][C]-0.083475[/C][C]-0.7034[/C][C]0.242061[/C][/ROW]
[ROW][C]32[/C][C]0.175286[/C][C]1.477[/C][C]0.072051[/C][/ROW]
[ROW][C]33[/C][C]-0.193172[/C][C]-1.6277[/C][C]0.05401[/C][/ROW]
[ROW][C]34[/C][C]-0.010852[/C][C]-0.0914[/C][C]0.463699[/C][/ROW]
[ROW][C]35[/C][C]0.065232[/C][C]0.5497[/C][C]0.292141[/C][/ROW]
[ROW][C]36[/C][C]-0.026677[/C][C]-0.2248[/C][C]0.411397[/C][/ROW]
[ROW][C]37[/C][C]0.004997[/C][C]0.0421[/C][C]0.483267[/C][/ROW]
[ROW][C]38[/C][C]0.003846[/C][C]0.0324[/C][C]0.487121[/C][/ROW]
[ROW][C]39[/C][C]0.05166[/C][C]0.4353[/C][C]0.332334[/C][/ROW]
[ROW][C]40[/C][C]-0.045049[/C][C]-0.3796[/C][C]0.352691[/C][/ROW]
[ROW][C]41[/C][C]0.105989[/C][C]0.8931[/C][C]0.187417[/C][/ROW]
[ROW][C]42[/C][C]-0.114179[/C][C]-0.9621[/C][C]0.169635[/C][/ROW]
[ROW][C]43[/C][C]-0.000131[/C][C]-0.0011[/C][C]0.499561[/C][/ROW]
[ROW][C]44[/C][C]0.009963[/C][C]0.0839[/C][C]0.466667[/C][/ROW]
[ROW][C]45[/C][C]-0.005236[/C][C]-0.0441[/C][C]0.482467[/C][/ROW]
[ROW][C]46[/C][C]0.062119[/C][C]0.5234[/C][C]0.301155[/C][/ROW]
[ROW][C]47[/C][C]0.04516[/C][C]0.3805[/C][C]0.352345[/C][/ROW]
[ROW][C]48[/C][C]-0.176668[/C][C]-1.4886[/C][C]0.070507[/C][/ROW]
[ROW][C]49[/C][C]0.209951[/C][C]1.7691[/C][C]0.040588[/C][/ROW]
[ROW][C]50[/C][C]-0.18145[/C][C]-1.5289[/C][C]0.065363[/C][/ROW]
[ROW][C]51[/C][C]0.07139[/C][C]0.6015[/C][C]0.274698[/C][/ROW]
[ROW][C]52[/C][C]-0.038419[/C][C]-0.3237[/C][C]0.373548[/C][/ROW]
[ROW][C]53[/C][C]-0.001185[/C][C]-0.01[/C][C]0.496032[/C][/ROW]
[ROW][C]54[/C][C]-0.033228[/C][C]-0.28[/C][C]0.390152[/C][/ROW]
[ROW][C]55[/C][C]0.103721[/C][C]0.874[/C][C]0.192542[/C][/ROW]
[ROW][C]56[/C][C]-0.074042[/C][C]-0.6239[/C][C]0.26735[/C][/ROW]
[ROW][C]57[/C][C]-0.007005[/C][C]-0.059[/C][C]0.476549[/C][/ROW]
[ROW][C]58[/C][C]0.023529[/C][C]0.1983[/C][C]0.421704[/C][/ROW]
[ROW][C]59[/C][C]-0.030632[/C][C]-0.2581[/C][C]0.398533[/C][/ROW]
[ROW][C]60[/C][C]0.009802[/C][C]0.0826[/C][C]0.467203[/C][/ROW]
[/TABLE]
Source: https://freestatistics.org/blog/index.php?pk=110599&T=1

Globally Unique Identifier (entire table): ba.freestatistics.org/blog/index.php?pk=110599&T=1

As an alternative you can also use a QR Code:  

The GUIDs for individual cells are displayed in the table below:

Autocorrelation Function
Time lag kACF(k)T-STATP-value
1-0.54952-4.63038e-06
20.1505211.26830.104415
30.0066810.05630.477631
4-0.127243-1.07220.143637
50.0618360.5210.301981
60.0248280.20920.417444
7-0.071622-0.60350.27405
80.0029720.0250.490046
90.0968550.81610.208583
10-0.009269-0.07810.468983
11-0.009418-0.07940.468486
12-0.074181-0.62510.266967
13-0.047145-0.39730.346186
140.0026710.02250.491053
150.085950.72420.235653
16-0.085343-0.71910.237215
170.0587440.4950.311069
180.0244420.2060.418709
19-0.064529-0.54370.294165
200.0107290.09040.464109
210.1396421.17660.121634
22-0.311082-2.62120.005355
230.362213.0520.001598
24-0.190444-1.60470.056499
25-0.055241-0.46550.32151
260.2462192.07470.020821
27-0.268748-2.26450.013299
280.143771.21140.114873
29-0.066104-0.5570.289638
300.0634970.5350.297149
31-0.083475-0.70340.242061
320.1752861.4770.072051
33-0.193172-1.62770.05401
34-0.010852-0.09140.463699
350.0652320.54970.292141
36-0.026677-0.22480.411397
370.0049970.04210.483267
380.0038460.03240.487121
390.051660.43530.332334
40-0.045049-0.37960.352691
410.1059890.89310.187417
42-0.114179-0.96210.169635
43-0.000131-0.00110.499561
440.0099630.08390.466667
45-0.005236-0.04410.482467
460.0621190.52340.301155
470.045160.38050.352345
48-0.176668-1.48860.070507
490.2099511.76910.040588
50-0.18145-1.52890.065363
510.071390.60150.274698
52-0.038419-0.32370.373548
53-0.001185-0.010.496032
54-0.033228-0.280.390152
550.1037210.8740.192542
56-0.074042-0.62390.26735
57-0.007005-0.0590.476549
580.0235290.19830.421704
59-0.030632-0.25810.398533
600.0098020.08260.467203


Partial Autocorrelation Function
Time lag kPACF(k)T-STATP-value
1-0.54952-4.63038e-06
2-0.21697-1.82820.035858
3-0.017872-0.15060.440364
4-0.147548-1.24330.108931
5-0.131878-1.11120.13511
6-0.005395-0.04550.481936
7-0.058596-0.49370.311506
8-0.133605-1.12580.132026
90.0442210.37260.355274
100.150171.26540.10494
110.0722660.60890.272259
12-0.112934-0.95160.172265
13-0.192293-1.62030.054802
14-0.173205-1.45950.074425
15-0.004755-0.04010.484076
16-0.057701-0.48620.314161
17-0.048516-0.40880.341957
180.0349220.29430.384709
19-0.048831-0.41150.34099
20-0.153187-1.29080.100485
210.1816521.53060.065153
22-0.10193-0.85890.196648
230.1684041.4190.080137
240.0851020.71710.237837
25-0.199438-1.68050.048628
260.0751050.63280.264433
27-0.063013-0.5310.298554
28-0.020535-0.1730.431558
29-0.069186-0.5830.280879
300.0693830.58460.280324
31-0.037542-0.31630.376337
320.1268591.06890.144361
33-0.047324-0.39880.345634
34-0.214343-1.80610.037571
35-0.078541-0.66180.255122
360.0177530.14960.440756
370.0184830.15570.438341
38-0.10055-0.84730.199851
390.1107760.93340.176885
400.0372580.31390.377244
410.0157040.13230.447552
420.0202050.17030.432649
430.0709160.59760.27602
44-0.063449-0.53460.297289
450.0590960.4980.310029
46-0.040531-0.34150.36686
47-0.010943-0.09220.463395
48-0.011144-0.09390.462727
49-0.057751-0.48660.314013
50-0.056702-0.47780.317137
51-0.00159-0.01340.494676
52-0.010323-0.0870.465466
53-0.044074-0.37140.355733
54-0.015544-0.1310.448084
55-0.011213-0.09450.462497
56-0.105016-0.88490.189603
570.0237410.20.42101
58-0.087188-0.73470.232483
590.0158310.13340.447128
60-0.044485-0.37480.354448

\begin{tabular}{lllllllll}
\hline
Partial Autocorrelation Function \tabularnewline
Time lag k & PACF(k) & T-STAT & P-value \tabularnewline
1 & -0.54952 & -4.6303 & 8e-06 \tabularnewline
2 & -0.21697 & -1.8282 & 0.035858 \tabularnewline
3 & -0.017872 & -0.1506 & 0.440364 \tabularnewline
4 & -0.147548 & -1.2433 & 0.108931 \tabularnewline
5 & -0.131878 & -1.1112 & 0.13511 \tabularnewline
6 & -0.005395 & -0.0455 & 0.481936 \tabularnewline
7 & -0.058596 & -0.4937 & 0.311506 \tabularnewline
8 & -0.133605 & -1.1258 & 0.132026 \tabularnewline
9 & 0.044221 & 0.3726 & 0.355274 \tabularnewline
10 & 0.15017 & 1.2654 & 0.10494 \tabularnewline
11 & 0.072266 & 0.6089 & 0.272259 \tabularnewline
12 & -0.112934 & -0.9516 & 0.172265 \tabularnewline
13 & -0.192293 & -1.6203 & 0.054802 \tabularnewline
14 & -0.173205 & -1.4595 & 0.074425 \tabularnewline
15 & -0.004755 & -0.0401 & 0.484076 \tabularnewline
16 & -0.057701 & -0.4862 & 0.314161 \tabularnewline
17 & -0.048516 & -0.4088 & 0.341957 \tabularnewline
18 & 0.034922 & 0.2943 & 0.384709 \tabularnewline
19 & -0.048831 & -0.4115 & 0.34099 \tabularnewline
20 & -0.153187 & -1.2908 & 0.100485 \tabularnewline
21 & 0.181652 & 1.5306 & 0.065153 \tabularnewline
22 & -0.10193 & -0.8589 & 0.196648 \tabularnewline
23 & 0.168404 & 1.419 & 0.080137 \tabularnewline
24 & 0.085102 & 0.7171 & 0.237837 \tabularnewline
25 & -0.199438 & -1.6805 & 0.048628 \tabularnewline
26 & 0.075105 & 0.6328 & 0.264433 \tabularnewline
27 & -0.063013 & -0.531 & 0.298554 \tabularnewline
28 & -0.020535 & -0.173 & 0.431558 \tabularnewline
29 & -0.069186 & -0.583 & 0.280879 \tabularnewline
30 & 0.069383 & 0.5846 & 0.280324 \tabularnewline
31 & -0.037542 & -0.3163 & 0.376337 \tabularnewline
32 & 0.126859 & 1.0689 & 0.144361 \tabularnewline
33 & -0.047324 & -0.3988 & 0.345634 \tabularnewline
34 & -0.214343 & -1.8061 & 0.037571 \tabularnewline
35 & -0.078541 & -0.6618 & 0.255122 \tabularnewline
36 & 0.017753 & 0.1496 & 0.440756 \tabularnewline
37 & 0.018483 & 0.1557 & 0.438341 \tabularnewline
38 & -0.10055 & -0.8473 & 0.199851 \tabularnewline
39 & 0.110776 & 0.9334 & 0.176885 \tabularnewline
40 & 0.037258 & 0.3139 & 0.377244 \tabularnewline
41 & 0.015704 & 0.1323 & 0.447552 \tabularnewline
42 & 0.020205 & 0.1703 & 0.432649 \tabularnewline
43 & 0.070916 & 0.5976 & 0.27602 \tabularnewline
44 & -0.063449 & -0.5346 & 0.297289 \tabularnewline
45 & 0.059096 & 0.498 & 0.310029 \tabularnewline
46 & -0.040531 & -0.3415 & 0.36686 \tabularnewline
47 & -0.010943 & -0.0922 & 0.463395 \tabularnewline
48 & -0.011144 & -0.0939 & 0.462727 \tabularnewline
49 & -0.057751 & -0.4866 & 0.314013 \tabularnewline
50 & -0.056702 & -0.4778 & 0.317137 \tabularnewline
51 & -0.00159 & -0.0134 & 0.494676 \tabularnewline
52 & -0.010323 & -0.087 & 0.465466 \tabularnewline
53 & -0.044074 & -0.3714 & 0.355733 \tabularnewline
54 & -0.015544 & -0.131 & 0.448084 \tabularnewline
55 & -0.011213 & -0.0945 & 0.462497 \tabularnewline
56 & -0.105016 & -0.8849 & 0.189603 \tabularnewline
57 & 0.023741 & 0.2 & 0.42101 \tabularnewline
58 & -0.087188 & -0.7347 & 0.232483 \tabularnewline
59 & 0.015831 & 0.1334 & 0.447128 \tabularnewline
60 & -0.044485 & -0.3748 & 0.354448 \tabularnewline
\hline
\end{tabular}
%Source: https://freestatistics.org/blog/index.php?pk=110599&T=2

[TABLE]
[ROW][C]Partial Autocorrelation Function[/C][/ROW]
[ROW][C]Time lag k[/C][C]PACF(k)[/C][C]T-STAT[/C][C]P-value[/C][/ROW]
[ROW][C]1[/C][C]-0.54952[/C][C]-4.6303[/C][C]8e-06[/C][/ROW]
[ROW][C]2[/C][C]-0.21697[/C][C]-1.8282[/C][C]0.035858[/C][/ROW]
[ROW][C]3[/C][C]-0.017872[/C][C]-0.1506[/C][C]0.440364[/C][/ROW]
[ROW][C]4[/C][C]-0.147548[/C][C]-1.2433[/C][C]0.108931[/C][/ROW]
[ROW][C]5[/C][C]-0.131878[/C][C]-1.1112[/C][C]0.13511[/C][/ROW]
[ROW][C]6[/C][C]-0.005395[/C][C]-0.0455[/C][C]0.481936[/C][/ROW]
[ROW][C]7[/C][C]-0.058596[/C][C]-0.4937[/C][C]0.311506[/C][/ROW]
[ROW][C]8[/C][C]-0.133605[/C][C]-1.1258[/C][C]0.132026[/C][/ROW]
[ROW][C]9[/C][C]0.044221[/C][C]0.3726[/C][C]0.355274[/C][/ROW]
[ROW][C]10[/C][C]0.15017[/C][C]1.2654[/C][C]0.10494[/C][/ROW]
[ROW][C]11[/C][C]0.072266[/C][C]0.6089[/C][C]0.272259[/C][/ROW]
[ROW][C]12[/C][C]-0.112934[/C][C]-0.9516[/C][C]0.172265[/C][/ROW]
[ROW][C]13[/C][C]-0.192293[/C][C]-1.6203[/C][C]0.054802[/C][/ROW]
[ROW][C]14[/C][C]-0.173205[/C][C]-1.4595[/C][C]0.074425[/C][/ROW]
[ROW][C]15[/C][C]-0.004755[/C][C]-0.0401[/C][C]0.484076[/C][/ROW]
[ROW][C]16[/C][C]-0.057701[/C][C]-0.4862[/C][C]0.314161[/C][/ROW]
[ROW][C]17[/C][C]-0.048516[/C][C]-0.4088[/C][C]0.341957[/C][/ROW]
[ROW][C]18[/C][C]0.034922[/C][C]0.2943[/C][C]0.384709[/C][/ROW]
[ROW][C]19[/C][C]-0.048831[/C][C]-0.4115[/C][C]0.34099[/C][/ROW]
[ROW][C]20[/C][C]-0.153187[/C][C]-1.2908[/C][C]0.100485[/C][/ROW]
[ROW][C]21[/C][C]0.181652[/C][C]1.5306[/C][C]0.065153[/C][/ROW]
[ROW][C]22[/C][C]-0.10193[/C][C]-0.8589[/C][C]0.196648[/C][/ROW]
[ROW][C]23[/C][C]0.168404[/C][C]1.419[/C][C]0.080137[/C][/ROW]
[ROW][C]24[/C][C]0.085102[/C][C]0.7171[/C][C]0.237837[/C][/ROW]
[ROW][C]25[/C][C]-0.199438[/C][C]-1.6805[/C][C]0.048628[/C][/ROW]
[ROW][C]26[/C][C]0.075105[/C][C]0.6328[/C][C]0.264433[/C][/ROW]
[ROW][C]27[/C][C]-0.063013[/C][C]-0.531[/C][C]0.298554[/C][/ROW]
[ROW][C]28[/C][C]-0.020535[/C][C]-0.173[/C][C]0.431558[/C][/ROW]
[ROW][C]29[/C][C]-0.069186[/C][C]-0.583[/C][C]0.280879[/C][/ROW]
[ROW][C]30[/C][C]0.069383[/C][C]0.5846[/C][C]0.280324[/C][/ROW]
[ROW][C]31[/C][C]-0.037542[/C][C]-0.3163[/C][C]0.376337[/C][/ROW]
[ROW][C]32[/C][C]0.126859[/C][C]1.0689[/C][C]0.144361[/C][/ROW]
[ROW][C]33[/C][C]-0.047324[/C][C]-0.3988[/C][C]0.345634[/C][/ROW]
[ROW][C]34[/C][C]-0.214343[/C][C]-1.8061[/C][C]0.037571[/C][/ROW]
[ROW][C]35[/C][C]-0.078541[/C][C]-0.6618[/C][C]0.255122[/C][/ROW]
[ROW][C]36[/C][C]0.017753[/C][C]0.1496[/C][C]0.440756[/C][/ROW]
[ROW][C]37[/C][C]0.018483[/C][C]0.1557[/C][C]0.438341[/C][/ROW]
[ROW][C]38[/C][C]-0.10055[/C][C]-0.8473[/C][C]0.199851[/C][/ROW]
[ROW][C]39[/C][C]0.110776[/C][C]0.9334[/C][C]0.176885[/C][/ROW]
[ROW][C]40[/C][C]0.037258[/C][C]0.3139[/C][C]0.377244[/C][/ROW]
[ROW][C]41[/C][C]0.015704[/C][C]0.1323[/C][C]0.447552[/C][/ROW]
[ROW][C]42[/C][C]0.020205[/C][C]0.1703[/C][C]0.432649[/C][/ROW]
[ROW][C]43[/C][C]0.070916[/C][C]0.5976[/C][C]0.27602[/C][/ROW]
[ROW][C]44[/C][C]-0.063449[/C][C]-0.5346[/C][C]0.297289[/C][/ROW]
[ROW][C]45[/C][C]0.059096[/C][C]0.498[/C][C]0.310029[/C][/ROW]
[ROW][C]46[/C][C]-0.040531[/C][C]-0.3415[/C][C]0.36686[/C][/ROW]
[ROW][C]47[/C][C]-0.010943[/C][C]-0.0922[/C][C]0.463395[/C][/ROW]
[ROW][C]48[/C][C]-0.011144[/C][C]-0.0939[/C][C]0.462727[/C][/ROW]
[ROW][C]49[/C][C]-0.057751[/C][C]-0.4866[/C][C]0.314013[/C][/ROW]
[ROW][C]50[/C][C]-0.056702[/C][C]-0.4778[/C][C]0.317137[/C][/ROW]
[ROW][C]51[/C][C]-0.00159[/C][C]-0.0134[/C][C]0.494676[/C][/ROW]
[ROW][C]52[/C][C]-0.010323[/C][C]-0.087[/C][C]0.465466[/C][/ROW]
[ROW][C]53[/C][C]-0.044074[/C][C]-0.3714[/C][C]0.355733[/C][/ROW]
[ROW][C]54[/C][C]-0.015544[/C][C]-0.131[/C][C]0.448084[/C][/ROW]
[ROW][C]55[/C][C]-0.011213[/C][C]-0.0945[/C][C]0.462497[/C][/ROW]
[ROW][C]56[/C][C]-0.105016[/C][C]-0.8849[/C][C]0.189603[/C][/ROW]
[ROW][C]57[/C][C]0.023741[/C][C]0.2[/C][C]0.42101[/C][/ROW]
[ROW][C]58[/C][C]-0.087188[/C][C]-0.7347[/C][C]0.232483[/C][/ROW]
[ROW][C]59[/C][C]0.015831[/C][C]0.1334[/C][C]0.447128[/C][/ROW]
[ROW][C]60[/C][C]-0.044485[/C][C]-0.3748[/C][C]0.354448[/C][/ROW]
[/TABLE]
Source: https://freestatistics.org/blog/index.php?pk=110599&T=2

Globally Unique Identifier (entire table): ba.freestatistics.org/blog/index.php?pk=110599&T=2

As an alternative you can also use a QR Code:  

The GUIDs for individual cells are displayed in the table below:

Partial Autocorrelation Function
Time lag kPACF(k)T-STATP-value
1-0.54952-4.63038e-06
2-0.21697-1.82820.035858
3-0.017872-0.15060.440364
4-0.147548-1.24330.108931
5-0.131878-1.11120.13511
6-0.005395-0.04550.481936
7-0.058596-0.49370.311506
8-0.133605-1.12580.132026
90.0442210.37260.355274
100.150171.26540.10494
110.0722660.60890.272259
12-0.112934-0.95160.172265
13-0.192293-1.62030.054802
14-0.173205-1.45950.074425
15-0.004755-0.04010.484076
16-0.057701-0.48620.314161
17-0.048516-0.40880.341957
180.0349220.29430.384709
19-0.048831-0.41150.34099
20-0.153187-1.29080.100485
210.1816521.53060.065153
22-0.10193-0.85890.196648
230.1684041.4190.080137
240.0851020.71710.237837
25-0.199438-1.68050.048628
260.0751050.63280.264433
27-0.063013-0.5310.298554
28-0.020535-0.1730.431558
29-0.069186-0.5830.280879
300.0693830.58460.280324
31-0.037542-0.31630.376337
320.1268591.06890.144361
33-0.047324-0.39880.345634
34-0.214343-1.80610.037571
35-0.078541-0.66180.255122
360.0177530.14960.440756
370.0184830.15570.438341
38-0.10055-0.84730.199851
390.1107760.93340.176885
400.0372580.31390.377244
410.0157040.13230.447552
420.0202050.17030.432649
430.0709160.59760.27602
44-0.063449-0.53460.297289
450.0590960.4980.310029
46-0.040531-0.34150.36686
47-0.010943-0.09220.463395
48-0.011144-0.09390.462727
49-0.057751-0.48660.314013
50-0.056702-0.47780.317137
51-0.00159-0.01340.494676
52-0.010323-0.0870.465466
53-0.044074-0.37140.355733
54-0.015544-0.1310.448084
55-0.011213-0.09450.462497
56-0.105016-0.88490.189603
570.0237410.20.42101
58-0.087188-0.73470.232483
590.0158310.13340.447128
60-0.044485-0.37480.354448


Parameters (Session):
par1 = 60 ; par2 = 1 ; par3 = 1 ; par4 = 1 ; par5 = 12 ; par6 = White Noise ; par7 = 0.95 ;
Parameters (R input):
par1 = 60 ; par2 = 1 ; par3 = 1 ; par4 = 1 ; par5 = 12 ; par6 = White Noise ; par7 = 0.95 ; par8 = ;
R code (references can be found in the software module):
if (par1 == 'Default') {
par1 = 10*log10(length(x))
} else {
par1 <- as.numeric(par1)
}
par2 <- as.numeric(par2)
par3 <- as.numeric(par3)
par4 <- as.numeric(par4)
par5 <- as.numeric(par5)
if (par6 == 'White Noise') par6 <- 'white' else par6 <- 'ma'
par7 <- as.numeric(par7)
if (par8 != '') par8 <- as.numeric(par8)
ox <- x
if (par8 == '') {
if (par2 == 0) {
x <- log(x)
} else {
x <- (x ^ par2 - 1) / par2
}
} else {
x <- log(x,base=par8)
}
if (par3 > 0) x <- diff(x,lag=1,difference=par3)
if (par4 > 0) x <- diff(x,lag=par5,difference=par4)
bitmap(file='picts.png')
op <- par(mfrow=c(2,1))
plot(ox,type='l',main='Original Time Series',xlab='time',ylab='value')
if (par8=='') {
mytitle <- paste('Working Time Series (lambda=',par2,', d=',par3,', D=',par4,')',sep='')
mysub <- paste('(lambda=',par2,', d=',par3,', D=',par4,', CI=', par7, ', CI type=',par6,')',sep='')
} else {
mytitle <- paste('Working Time Series (base=',par8,', d=',par3,', D=',par4,')',sep='')
mysub <- paste('(base=',par8,', d=',par3,', D=',par4,', CI=', par7, ', CI type=',par6,')',sep='')
}
plot(x,type='l', main=mytitle,xlab='time',ylab='value')
par(op)
dev.off()
bitmap(file='pic1.png')
racf <- acf(x, par1, main='Autocorrelation', xlab='time lag', ylab='ACF', ci.type=par6, ci=par7, sub=mysub)
dev.off()
bitmap(file='pic2.png')
rpacf <- pacf(x,par1,main='Partial Autocorrelation',xlab='lags',ylab='PACF',sub=mysub)
dev.off()
(myacf <- c(racf$acf))
(mypacf <- c(rpacf$acf))
lengthx <- length(x)
sqrtn <- sqrt(lengthx)
load(file='createtable')
a<-table.start()
a<-table.row.start(a)
a<-table.element(a,'Autocorrelation Function',4,TRUE)
a<-table.row.end(a)
a<-table.row.start(a)
a<-table.element(a,'Time lag k',header=TRUE)
a<-table.element(a,hyperlink('basics.htm','ACF(k)','click here for more information about the Autocorrelation Function'),header=TRUE)
a<-table.element(a,'T-STAT',header=TRUE)
a<-table.element(a,'P-value',header=TRUE)
a<-table.row.end(a)
for (i in 2:(par1+1)) {
a<-table.row.start(a)
a<-table.element(a,i-1,header=TRUE)
a<-table.element(a,round(myacf[i],6))
mytstat <- myacf[i]*sqrtn
a<-table.element(a,round(mytstat,4))
a<-table.element(a,round(1-pt(abs(mytstat),lengthx),6))
a<-table.row.end(a)
}
a<-table.end(a)
table.save(a,file='mytable.tab')
a<-table.start()
a<-table.row.start(a)
a<-table.element(a,'Partial Autocorrelation Function',4,TRUE)
a<-table.row.end(a)
a<-table.row.start(a)
a<-table.element(a,'Time lag k',header=TRUE)
a<-table.element(a,hyperlink('basics.htm','PACF(k)','click here for more information about the Partial Autocorrelation Function'),header=TRUE)
a<-table.element(a,'T-STAT',header=TRUE)
a<-table.element(a,'P-value',header=TRUE)
a<-table.row.end(a)
for (i in 1:par1) {
a<-table.row.start(a)
a<-table.element(a,i,header=TRUE)
a<-table.element(a,round(mypacf[i],6))
mytstat <- mypacf[i]*sqrtn
a<-table.element(a,round(mytstat,4))
a<-table.element(a,round(1-pt(abs(mytstat),lengthx),6))
a<-table.row.end(a)
}
a<-table.end(a)
table.save(a,file='mytable1.tab')