Free Statistics

of Irreproducible Research!

Author's title

Author*The author of this computation has been verified*
R Software Modulerwasp_autocorrelation.wasp
Title produced by software(Partial) Autocorrelation Function
Date of computationWed, 15 Dec 2010 17:14:50 +0000
Cite this page as followsStatistical Computations at FreeStatistics.org, Office for Research Development and Education, URL https://freestatistics.org/blog/index.php?v=date/2010/Dec/15/t1292433166dbwwno3bvgwh4fb.htm/, Retrieved Fri, 03 May 2024 12:47:31 +0000
Statistical Computations at FreeStatistics.org, Office for Research Development and Education, URL https://freestatistics.org/blog/index.php?pk=110593, Retrieved Fri, 03 May 2024 12:47:31 +0000
QR Codes:

Original text written by user:
IsPrivate?No (this computation is public)
User-defined keywords
Estimated Impact120
Family? (F = Feedback message, R = changed R code, M = changed R Module, P = changed Parameters, D = changed Data)
-       [(Partial) Autocorrelation Function] [ACF 2] [2010-12-15 17:14:50] [4c854bb223ec27caaa7bcfc5e77b0dbd] [Current]
Feedback Forum

Post a new message
Dataseries X:
12231
13604
15107
10853
13698
11536
8879
11005
13656
12631
10931
8064
12332
12452
14029
10003
12388
10492
9114
9304
9660
10569
8356
5998
10408
11420
11538
10860
10412
9521
7602
8197
10449
11561
8603
8080
10792
11943
11179
9939
10065
11021
9226
9554
11468
9937
8928
8395
11996
12385
15277
12657
11482
16797
11047
11794
13077
11725
10921
9334
11431
13085
16394
15701
14936
18282
12824
14784
16061
14814
14375
13644
16397
19254
21943
16731
22065
20937
18242
19017
20372
20561
18267
16170


Summary of computational transaction
Raw Inputview raw input (R code)
Raw Outputview raw output of R engine
Computing time3 seconds
R Server'Gwilym Jenkins' @ 72.249.127.135

\begin{tabular}{lllllllll}
\hline
Summary of computational transaction \tabularnewline
Raw Input & view raw input (R code)  \tabularnewline
Raw Output & view raw output of R engine  \tabularnewline
Computing time & 3 seconds \tabularnewline
R Server & 'Gwilym Jenkins' @ 72.249.127.135 \tabularnewline
\hline
\end{tabular}
%Source: https://freestatistics.org/blog/index.php?pk=110593&T=0

[TABLE]
[ROW][C]Summary of computational transaction[/C][/ROW]
[ROW][C]Raw Input[/C][C]view raw input (R code) [/C][/ROW]
[ROW][C]Raw Output[/C][C]view raw output of R engine [/C][/ROW]
[ROW][C]Computing time[/C][C]3 seconds[/C][/ROW]
[ROW][C]R Server[/C][C]'Gwilym Jenkins' @ 72.249.127.135[/C][/ROW]
[/TABLE]
Source: https://freestatistics.org/blog/index.php?pk=110593&T=0

Globally Unique Identifier (entire table): ba.freestatistics.org/blog/index.php?pk=110593&T=0

As an alternative you can also use a QR Code:  

The GUIDs for individual cells are displayed in the table below:

Summary of computational transaction
Raw Inputview raw input (R code)
Raw Outputview raw output of R engine
Computing time3 seconds
R Server'Gwilym Jenkins' @ 72.249.127.135


Autocorrelation Function
Time lag kACF(k)T-STATP-value
1-0.307151-2.79830.003193
2-0.167261-1.52380.065677
30.0176510.16080.436316
40.0216340.19710.422117
50.0818160.74540.229075
6-0.154784-1.41010.081117
70.0071030.06470.474281
80.0756220.68890.246388
90.0306250.2790.390466
10-0.281994-2.56910.005993
11-0.050358-0.45880.323794
120.5430684.94762e-06
13-0.168489-1.5350.064293
14-0.087602-0.79810.213547
15-0.035608-0.32440.373224
160.0165240.15050.440353
170.1361661.24050.109138
18-0.174138-1.58650.058218
199.1e-058e-040.49967
200.1179891.07490.14276
21-0.029819-0.27170.393277
22-0.302288-2.7540.003616
230.0781250.71180.239306
240.3081352.80720.003113
25-0.041224-0.37560.354099
26-0.064032-0.58340.280616
27-0.098705-0.89920.185562
280.0943820.85990.19617
290.1082750.98640.163395
30-0.1612-1.46860.07286
31-0.007292-0.06640.473597
320.139981.27530.102885
33-0.122657-1.11750.133511
34-0.101619-0.92580.178618
35-0.061671-0.56190.287865
360.2188071.99340.02475
370.0795350.72460.235369
38-0.164481-1.49850.068899
39-0.023499-0.21410.415503
400.0592680.540.295338
410.1239411.12920.131042
42-0.168512-1.53520.064267
430.0235450.21450.41534
440.0682960.62220.267757
45-0.088558-0.80680.211044
46-0.019928-0.18160.428189
47-0.123274-1.12310.132321
480.1805651.6450.051873
490.1415911.290.100324
50-0.21023-1.91530.02945
510.0157980.14390.442952
520.047170.42970.334251
530.0216970.19770.421895
54-0.068472-0.62380.267232
550.0499130.45470.325247
560.0227310.20710.418224
57-0.053915-0.49120.312295
58-0.038666-0.35230.362765
59-0.122857-1.11930.133124
600.2064991.88130.031719

\begin{tabular}{lllllllll}
\hline
Autocorrelation Function \tabularnewline
Time lag k & ACF(k) & T-STAT & P-value \tabularnewline
1 & -0.307151 & -2.7983 & 0.003193 \tabularnewline
2 & -0.167261 & -1.5238 & 0.065677 \tabularnewline
3 & 0.017651 & 0.1608 & 0.436316 \tabularnewline
4 & 0.021634 & 0.1971 & 0.422117 \tabularnewline
5 & 0.081816 & 0.7454 & 0.229075 \tabularnewline
6 & -0.154784 & -1.4101 & 0.081117 \tabularnewline
7 & 0.007103 & 0.0647 & 0.474281 \tabularnewline
8 & 0.075622 & 0.6889 & 0.246388 \tabularnewline
9 & 0.030625 & 0.279 & 0.390466 \tabularnewline
10 & -0.281994 & -2.5691 & 0.005993 \tabularnewline
11 & -0.050358 & -0.4588 & 0.323794 \tabularnewline
12 & 0.543068 & 4.9476 & 2e-06 \tabularnewline
13 & -0.168489 & -1.535 & 0.064293 \tabularnewline
14 & -0.087602 & -0.7981 & 0.213547 \tabularnewline
15 & -0.035608 & -0.3244 & 0.373224 \tabularnewline
16 & 0.016524 & 0.1505 & 0.440353 \tabularnewline
17 & 0.136166 & 1.2405 & 0.109138 \tabularnewline
18 & -0.174138 & -1.5865 & 0.058218 \tabularnewline
19 & 9.1e-05 & 8e-04 & 0.49967 \tabularnewline
20 & 0.117989 & 1.0749 & 0.14276 \tabularnewline
21 & -0.029819 & -0.2717 & 0.393277 \tabularnewline
22 & -0.302288 & -2.754 & 0.003616 \tabularnewline
23 & 0.078125 & 0.7118 & 0.239306 \tabularnewline
24 & 0.308135 & 2.8072 & 0.003113 \tabularnewline
25 & -0.041224 & -0.3756 & 0.354099 \tabularnewline
26 & -0.064032 & -0.5834 & 0.280616 \tabularnewline
27 & -0.098705 & -0.8992 & 0.185562 \tabularnewline
28 & 0.094382 & 0.8599 & 0.19617 \tabularnewline
29 & 0.108275 & 0.9864 & 0.163395 \tabularnewline
30 & -0.1612 & -1.4686 & 0.07286 \tabularnewline
31 & -0.007292 & -0.0664 & 0.473597 \tabularnewline
32 & 0.13998 & 1.2753 & 0.102885 \tabularnewline
33 & -0.122657 & -1.1175 & 0.133511 \tabularnewline
34 & -0.101619 & -0.9258 & 0.178618 \tabularnewline
35 & -0.061671 & -0.5619 & 0.287865 \tabularnewline
36 & 0.218807 & 1.9934 & 0.02475 \tabularnewline
37 & 0.079535 & 0.7246 & 0.235369 \tabularnewline
38 & -0.164481 & -1.4985 & 0.068899 \tabularnewline
39 & -0.023499 & -0.2141 & 0.415503 \tabularnewline
40 & 0.059268 & 0.54 & 0.295338 \tabularnewline
41 & 0.123941 & 1.1292 & 0.131042 \tabularnewline
42 & -0.168512 & -1.5352 & 0.064267 \tabularnewline
43 & 0.023545 & 0.2145 & 0.41534 \tabularnewline
44 & 0.068296 & 0.6222 & 0.267757 \tabularnewline
45 & -0.088558 & -0.8068 & 0.211044 \tabularnewline
46 & -0.019928 & -0.1816 & 0.428189 \tabularnewline
47 & -0.123274 & -1.1231 & 0.132321 \tabularnewline
48 & 0.180565 & 1.645 & 0.051873 \tabularnewline
49 & 0.141591 & 1.29 & 0.100324 \tabularnewline
50 & -0.21023 & -1.9153 & 0.02945 \tabularnewline
51 & 0.015798 & 0.1439 & 0.442952 \tabularnewline
52 & 0.04717 & 0.4297 & 0.334251 \tabularnewline
53 & 0.021697 & 0.1977 & 0.421895 \tabularnewline
54 & -0.068472 & -0.6238 & 0.267232 \tabularnewline
55 & 0.049913 & 0.4547 & 0.325247 \tabularnewline
56 & 0.022731 & 0.2071 & 0.418224 \tabularnewline
57 & -0.053915 & -0.4912 & 0.312295 \tabularnewline
58 & -0.038666 & -0.3523 & 0.362765 \tabularnewline
59 & -0.122857 & -1.1193 & 0.133124 \tabularnewline
60 & 0.206499 & 1.8813 & 0.031719 \tabularnewline
\hline
\end{tabular}
%Source: https://freestatistics.org/blog/index.php?pk=110593&T=1

[TABLE]
[ROW][C]Autocorrelation Function[/C][/ROW]
[ROW][C]Time lag k[/C][C]ACF(k)[/C][C]T-STAT[/C][C]P-value[/C][/ROW]
[ROW][C]1[/C][C]-0.307151[/C][C]-2.7983[/C][C]0.003193[/C][/ROW]
[ROW][C]2[/C][C]-0.167261[/C][C]-1.5238[/C][C]0.065677[/C][/ROW]
[ROW][C]3[/C][C]0.017651[/C][C]0.1608[/C][C]0.436316[/C][/ROW]
[ROW][C]4[/C][C]0.021634[/C][C]0.1971[/C][C]0.422117[/C][/ROW]
[ROW][C]5[/C][C]0.081816[/C][C]0.7454[/C][C]0.229075[/C][/ROW]
[ROW][C]6[/C][C]-0.154784[/C][C]-1.4101[/C][C]0.081117[/C][/ROW]
[ROW][C]7[/C][C]0.007103[/C][C]0.0647[/C][C]0.474281[/C][/ROW]
[ROW][C]8[/C][C]0.075622[/C][C]0.6889[/C][C]0.246388[/C][/ROW]
[ROW][C]9[/C][C]0.030625[/C][C]0.279[/C][C]0.390466[/C][/ROW]
[ROW][C]10[/C][C]-0.281994[/C][C]-2.5691[/C][C]0.005993[/C][/ROW]
[ROW][C]11[/C][C]-0.050358[/C][C]-0.4588[/C][C]0.323794[/C][/ROW]
[ROW][C]12[/C][C]0.543068[/C][C]4.9476[/C][C]2e-06[/C][/ROW]
[ROW][C]13[/C][C]-0.168489[/C][C]-1.535[/C][C]0.064293[/C][/ROW]
[ROW][C]14[/C][C]-0.087602[/C][C]-0.7981[/C][C]0.213547[/C][/ROW]
[ROW][C]15[/C][C]-0.035608[/C][C]-0.3244[/C][C]0.373224[/C][/ROW]
[ROW][C]16[/C][C]0.016524[/C][C]0.1505[/C][C]0.440353[/C][/ROW]
[ROW][C]17[/C][C]0.136166[/C][C]1.2405[/C][C]0.109138[/C][/ROW]
[ROW][C]18[/C][C]-0.174138[/C][C]-1.5865[/C][C]0.058218[/C][/ROW]
[ROW][C]19[/C][C]9.1e-05[/C][C]8e-04[/C][C]0.49967[/C][/ROW]
[ROW][C]20[/C][C]0.117989[/C][C]1.0749[/C][C]0.14276[/C][/ROW]
[ROW][C]21[/C][C]-0.029819[/C][C]-0.2717[/C][C]0.393277[/C][/ROW]
[ROW][C]22[/C][C]-0.302288[/C][C]-2.754[/C][C]0.003616[/C][/ROW]
[ROW][C]23[/C][C]0.078125[/C][C]0.7118[/C][C]0.239306[/C][/ROW]
[ROW][C]24[/C][C]0.308135[/C][C]2.8072[/C][C]0.003113[/C][/ROW]
[ROW][C]25[/C][C]-0.041224[/C][C]-0.3756[/C][C]0.354099[/C][/ROW]
[ROW][C]26[/C][C]-0.064032[/C][C]-0.5834[/C][C]0.280616[/C][/ROW]
[ROW][C]27[/C][C]-0.098705[/C][C]-0.8992[/C][C]0.185562[/C][/ROW]
[ROW][C]28[/C][C]0.094382[/C][C]0.8599[/C][C]0.19617[/C][/ROW]
[ROW][C]29[/C][C]0.108275[/C][C]0.9864[/C][C]0.163395[/C][/ROW]
[ROW][C]30[/C][C]-0.1612[/C][C]-1.4686[/C][C]0.07286[/C][/ROW]
[ROW][C]31[/C][C]-0.007292[/C][C]-0.0664[/C][C]0.473597[/C][/ROW]
[ROW][C]32[/C][C]0.13998[/C][C]1.2753[/C][C]0.102885[/C][/ROW]
[ROW][C]33[/C][C]-0.122657[/C][C]-1.1175[/C][C]0.133511[/C][/ROW]
[ROW][C]34[/C][C]-0.101619[/C][C]-0.9258[/C][C]0.178618[/C][/ROW]
[ROW][C]35[/C][C]-0.061671[/C][C]-0.5619[/C][C]0.287865[/C][/ROW]
[ROW][C]36[/C][C]0.218807[/C][C]1.9934[/C][C]0.02475[/C][/ROW]
[ROW][C]37[/C][C]0.079535[/C][C]0.7246[/C][C]0.235369[/C][/ROW]
[ROW][C]38[/C][C]-0.164481[/C][C]-1.4985[/C][C]0.068899[/C][/ROW]
[ROW][C]39[/C][C]-0.023499[/C][C]-0.2141[/C][C]0.415503[/C][/ROW]
[ROW][C]40[/C][C]0.059268[/C][C]0.54[/C][C]0.295338[/C][/ROW]
[ROW][C]41[/C][C]0.123941[/C][C]1.1292[/C][C]0.131042[/C][/ROW]
[ROW][C]42[/C][C]-0.168512[/C][C]-1.5352[/C][C]0.064267[/C][/ROW]
[ROW][C]43[/C][C]0.023545[/C][C]0.2145[/C][C]0.41534[/C][/ROW]
[ROW][C]44[/C][C]0.068296[/C][C]0.6222[/C][C]0.267757[/C][/ROW]
[ROW][C]45[/C][C]-0.088558[/C][C]-0.8068[/C][C]0.211044[/C][/ROW]
[ROW][C]46[/C][C]-0.019928[/C][C]-0.1816[/C][C]0.428189[/C][/ROW]
[ROW][C]47[/C][C]-0.123274[/C][C]-1.1231[/C][C]0.132321[/C][/ROW]
[ROW][C]48[/C][C]0.180565[/C][C]1.645[/C][C]0.051873[/C][/ROW]
[ROW][C]49[/C][C]0.141591[/C][C]1.29[/C][C]0.100324[/C][/ROW]
[ROW][C]50[/C][C]-0.21023[/C][C]-1.9153[/C][C]0.02945[/C][/ROW]
[ROW][C]51[/C][C]0.015798[/C][C]0.1439[/C][C]0.442952[/C][/ROW]
[ROW][C]52[/C][C]0.04717[/C][C]0.4297[/C][C]0.334251[/C][/ROW]
[ROW][C]53[/C][C]0.021697[/C][C]0.1977[/C][C]0.421895[/C][/ROW]
[ROW][C]54[/C][C]-0.068472[/C][C]-0.6238[/C][C]0.267232[/C][/ROW]
[ROW][C]55[/C][C]0.049913[/C][C]0.4547[/C][C]0.325247[/C][/ROW]
[ROW][C]56[/C][C]0.022731[/C][C]0.2071[/C][C]0.418224[/C][/ROW]
[ROW][C]57[/C][C]-0.053915[/C][C]-0.4912[/C][C]0.312295[/C][/ROW]
[ROW][C]58[/C][C]-0.038666[/C][C]-0.3523[/C][C]0.362765[/C][/ROW]
[ROW][C]59[/C][C]-0.122857[/C][C]-1.1193[/C][C]0.133124[/C][/ROW]
[ROW][C]60[/C][C]0.206499[/C][C]1.8813[/C][C]0.031719[/C][/ROW]
[/TABLE]
Source: https://freestatistics.org/blog/index.php?pk=110593&T=1

Globally Unique Identifier (entire table): ba.freestatistics.org/blog/index.php?pk=110593&T=1

As an alternative you can also use a QR Code:  

The GUIDs for individual cells are displayed in the table below:

Autocorrelation Function
Time lag kACF(k)T-STATP-value
1-0.307151-2.79830.003193
2-0.167261-1.52380.065677
30.0176510.16080.436316
40.0216340.19710.422117
50.0818160.74540.229075
6-0.154784-1.41010.081117
70.0071030.06470.474281
80.0756220.68890.246388
90.0306250.2790.390466
10-0.281994-2.56910.005993
11-0.050358-0.45880.323794
120.5430684.94762e-06
13-0.168489-1.5350.064293
14-0.087602-0.79810.213547
15-0.035608-0.32440.373224
160.0165240.15050.440353
170.1361661.24050.109138
18-0.174138-1.58650.058218
199.1e-058e-040.49967
200.1179891.07490.14276
21-0.029819-0.27170.393277
22-0.302288-2.7540.003616
230.0781250.71180.239306
240.3081352.80720.003113
25-0.041224-0.37560.354099
26-0.064032-0.58340.280616
27-0.098705-0.89920.185562
280.0943820.85990.19617
290.1082750.98640.163395
30-0.1612-1.46860.07286
31-0.007292-0.06640.473597
320.139981.27530.102885
33-0.122657-1.11750.133511
34-0.101619-0.92580.178618
35-0.061671-0.56190.287865
360.2188071.99340.02475
370.0795350.72460.235369
38-0.164481-1.49850.068899
39-0.023499-0.21410.415503
400.0592680.540.295338
410.1239411.12920.131042
42-0.168512-1.53520.064267
430.0235450.21450.41534
440.0682960.62220.267757
45-0.088558-0.80680.211044
46-0.019928-0.18160.428189
47-0.123274-1.12310.132321
480.1805651.6450.051873
490.1415911.290.100324
50-0.21023-1.91530.02945
510.0157980.14390.442952
520.047170.42970.334251
530.0216970.19770.421895
54-0.068472-0.62380.267232
550.0499130.45470.325247
560.0227310.20710.418224
57-0.053915-0.49120.312295
58-0.038666-0.35230.362765
59-0.122857-1.11930.133124
600.2064991.88130.031719


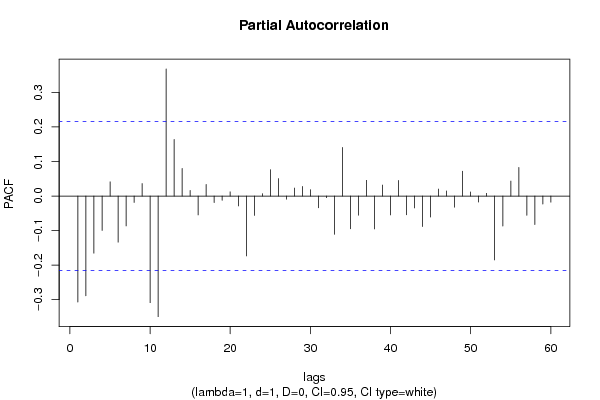
Partial Autocorrelation Function
Time lag kPACF(k)T-STATP-value
1-0.307151-2.79830.003193
2-0.288854-2.63160.005065
3-0.165385-1.50670.067839
4-0.099825-0.90950.182873
50.0411820.37520.354241
6-0.133697-1.2180.11333
7-0.086601-0.7890.216188
8-0.018513-0.16870.433238
90.0360250.32820.371792
10-0.308696-2.81240.003068
11-0.349254-3.18190.00103
120.3678663.35140.000606
130.1639481.49360.069531
140.0799170.72810.234307
150.0162120.14770.44147
16-0.054683-0.49820.309836
170.0334840.30510.380546
18-0.018857-0.17180.432009
19-0.012407-0.1130.455138
200.0121870.1110.455932
21-0.028923-0.26350.396408
22-0.173321-1.5790.059066
23-0.05637-0.51360.304463
240.0067590.06160.475523
250.076230.69450.244657
260.0504930.460.323355
27-0.009111-0.0830.467024
280.0231550.2110.416721
290.0275980.25140.401053
300.0183750.16740.433728
31-0.033993-0.30970.378785
32-0.004685-0.04270.483028
33-0.111002-1.01130.157412
340.1407351.28220.101678
35-0.094965-0.86520.19472
36-0.055691-0.50740.30662
370.0453430.41310.3403
38-0.095401-0.86910.193638
390.0317780.28950.386455
40-0.05476-0.49890.309589
410.0450150.41010.341393
42-0.054562-0.49710.310222
43-0.034547-0.31470.376874
44-0.088513-0.80640.211161
45-0.061069-0.55640.289729
460.0203060.1850.426841
470.0146970.13390.446906
48-0.032456-0.29570.384102
490.0719770.65570.256903
500.0118320.10780.457209
51-0.017679-0.16110.436216
520.0079540.07250.471205
53-0.185152-1.68680.047697
54-0.086835-0.79110.215568
550.04330.39450.347118
560.0826980.75340.226666
57-0.056027-0.51040.305551
58-0.08257-0.75230.227014
59-0.023223-0.21160.41648
60-0.017963-0.16370.435202

\begin{tabular}{lllllllll}
\hline
Partial Autocorrelation Function \tabularnewline
Time lag k & PACF(k) & T-STAT & P-value \tabularnewline
1 & -0.307151 & -2.7983 & 0.003193 \tabularnewline
2 & -0.288854 & -2.6316 & 0.005065 \tabularnewline
3 & -0.165385 & -1.5067 & 0.067839 \tabularnewline
4 & -0.099825 & -0.9095 & 0.182873 \tabularnewline
5 & 0.041182 & 0.3752 & 0.354241 \tabularnewline
6 & -0.133697 & -1.218 & 0.11333 \tabularnewline
7 & -0.086601 & -0.789 & 0.216188 \tabularnewline
8 & -0.018513 & -0.1687 & 0.433238 \tabularnewline
9 & 0.036025 & 0.3282 & 0.371792 \tabularnewline
10 & -0.308696 & -2.8124 & 0.003068 \tabularnewline
11 & -0.349254 & -3.1819 & 0.00103 \tabularnewline
12 & 0.367866 & 3.3514 & 0.000606 \tabularnewline
13 & 0.163948 & 1.4936 & 0.069531 \tabularnewline
14 & 0.079917 & 0.7281 & 0.234307 \tabularnewline
15 & 0.016212 & 0.1477 & 0.44147 \tabularnewline
16 & -0.054683 & -0.4982 & 0.309836 \tabularnewline
17 & 0.033484 & 0.3051 & 0.380546 \tabularnewline
18 & -0.018857 & -0.1718 & 0.432009 \tabularnewline
19 & -0.012407 & -0.113 & 0.455138 \tabularnewline
20 & 0.012187 & 0.111 & 0.455932 \tabularnewline
21 & -0.028923 & -0.2635 & 0.396408 \tabularnewline
22 & -0.173321 & -1.579 & 0.059066 \tabularnewline
23 & -0.05637 & -0.5136 & 0.304463 \tabularnewline
24 & 0.006759 & 0.0616 & 0.475523 \tabularnewline
25 & 0.07623 & 0.6945 & 0.244657 \tabularnewline
26 & 0.050493 & 0.46 & 0.323355 \tabularnewline
27 & -0.009111 & -0.083 & 0.467024 \tabularnewline
28 & 0.023155 & 0.211 & 0.416721 \tabularnewline
29 & 0.027598 & 0.2514 & 0.401053 \tabularnewline
30 & 0.018375 & 0.1674 & 0.433728 \tabularnewline
31 & -0.033993 & -0.3097 & 0.378785 \tabularnewline
32 & -0.004685 & -0.0427 & 0.483028 \tabularnewline
33 & -0.111002 & -1.0113 & 0.157412 \tabularnewline
34 & 0.140735 & 1.2822 & 0.101678 \tabularnewline
35 & -0.094965 & -0.8652 & 0.19472 \tabularnewline
36 & -0.055691 & -0.5074 & 0.30662 \tabularnewline
37 & 0.045343 & 0.4131 & 0.3403 \tabularnewline
38 & -0.095401 & -0.8691 & 0.193638 \tabularnewline
39 & 0.031778 & 0.2895 & 0.386455 \tabularnewline
40 & -0.05476 & -0.4989 & 0.309589 \tabularnewline
41 & 0.045015 & 0.4101 & 0.341393 \tabularnewline
42 & -0.054562 & -0.4971 & 0.310222 \tabularnewline
43 & -0.034547 & -0.3147 & 0.376874 \tabularnewline
44 & -0.088513 & -0.8064 & 0.211161 \tabularnewline
45 & -0.061069 & -0.5564 & 0.289729 \tabularnewline
46 & 0.020306 & 0.185 & 0.426841 \tabularnewline
47 & 0.014697 & 0.1339 & 0.446906 \tabularnewline
48 & -0.032456 & -0.2957 & 0.384102 \tabularnewline
49 & 0.071977 & 0.6557 & 0.256903 \tabularnewline
50 & 0.011832 & 0.1078 & 0.457209 \tabularnewline
51 & -0.017679 & -0.1611 & 0.436216 \tabularnewline
52 & 0.007954 & 0.0725 & 0.471205 \tabularnewline
53 & -0.185152 & -1.6868 & 0.047697 \tabularnewline
54 & -0.086835 & -0.7911 & 0.215568 \tabularnewline
55 & 0.0433 & 0.3945 & 0.347118 \tabularnewline
56 & 0.082698 & 0.7534 & 0.226666 \tabularnewline
57 & -0.056027 & -0.5104 & 0.305551 \tabularnewline
58 & -0.08257 & -0.7523 & 0.227014 \tabularnewline
59 & -0.023223 & -0.2116 & 0.41648 \tabularnewline
60 & -0.017963 & -0.1637 & 0.435202 \tabularnewline
\hline
\end{tabular}
%Source: https://freestatistics.org/blog/index.php?pk=110593&T=2

[TABLE]
[ROW][C]Partial Autocorrelation Function[/C][/ROW]
[ROW][C]Time lag k[/C][C]PACF(k)[/C][C]T-STAT[/C][C]P-value[/C][/ROW]
[ROW][C]1[/C][C]-0.307151[/C][C]-2.7983[/C][C]0.003193[/C][/ROW]
[ROW][C]2[/C][C]-0.288854[/C][C]-2.6316[/C][C]0.005065[/C][/ROW]
[ROW][C]3[/C][C]-0.165385[/C][C]-1.5067[/C][C]0.067839[/C][/ROW]
[ROW][C]4[/C][C]-0.099825[/C][C]-0.9095[/C][C]0.182873[/C][/ROW]
[ROW][C]5[/C][C]0.041182[/C][C]0.3752[/C][C]0.354241[/C][/ROW]
[ROW][C]6[/C][C]-0.133697[/C][C]-1.218[/C][C]0.11333[/C][/ROW]
[ROW][C]7[/C][C]-0.086601[/C][C]-0.789[/C][C]0.216188[/C][/ROW]
[ROW][C]8[/C][C]-0.018513[/C][C]-0.1687[/C][C]0.433238[/C][/ROW]
[ROW][C]9[/C][C]0.036025[/C][C]0.3282[/C][C]0.371792[/C][/ROW]
[ROW][C]10[/C][C]-0.308696[/C][C]-2.8124[/C][C]0.003068[/C][/ROW]
[ROW][C]11[/C][C]-0.349254[/C][C]-3.1819[/C][C]0.00103[/C][/ROW]
[ROW][C]12[/C][C]0.367866[/C][C]3.3514[/C][C]0.000606[/C][/ROW]
[ROW][C]13[/C][C]0.163948[/C][C]1.4936[/C][C]0.069531[/C][/ROW]
[ROW][C]14[/C][C]0.079917[/C][C]0.7281[/C][C]0.234307[/C][/ROW]
[ROW][C]15[/C][C]0.016212[/C][C]0.1477[/C][C]0.44147[/C][/ROW]
[ROW][C]16[/C][C]-0.054683[/C][C]-0.4982[/C][C]0.309836[/C][/ROW]
[ROW][C]17[/C][C]0.033484[/C][C]0.3051[/C][C]0.380546[/C][/ROW]
[ROW][C]18[/C][C]-0.018857[/C][C]-0.1718[/C][C]0.432009[/C][/ROW]
[ROW][C]19[/C][C]-0.012407[/C][C]-0.113[/C][C]0.455138[/C][/ROW]
[ROW][C]20[/C][C]0.012187[/C][C]0.111[/C][C]0.455932[/C][/ROW]
[ROW][C]21[/C][C]-0.028923[/C][C]-0.2635[/C][C]0.396408[/C][/ROW]
[ROW][C]22[/C][C]-0.173321[/C][C]-1.579[/C][C]0.059066[/C][/ROW]
[ROW][C]23[/C][C]-0.05637[/C][C]-0.5136[/C][C]0.304463[/C][/ROW]
[ROW][C]24[/C][C]0.006759[/C][C]0.0616[/C][C]0.475523[/C][/ROW]
[ROW][C]25[/C][C]0.07623[/C][C]0.6945[/C][C]0.244657[/C][/ROW]
[ROW][C]26[/C][C]0.050493[/C][C]0.46[/C][C]0.323355[/C][/ROW]
[ROW][C]27[/C][C]-0.009111[/C][C]-0.083[/C][C]0.467024[/C][/ROW]
[ROW][C]28[/C][C]0.023155[/C][C]0.211[/C][C]0.416721[/C][/ROW]
[ROW][C]29[/C][C]0.027598[/C][C]0.2514[/C][C]0.401053[/C][/ROW]
[ROW][C]30[/C][C]0.018375[/C][C]0.1674[/C][C]0.433728[/C][/ROW]
[ROW][C]31[/C][C]-0.033993[/C][C]-0.3097[/C][C]0.378785[/C][/ROW]
[ROW][C]32[/C][C]-0.004685[/C][C]-0.0427[/C][C]0.483028[/C][/ROW]
[ROW][C]33[/C][C]-0.111002[/C][C]-1.0113[/C][C]0.157412[/C][/ROW]
[ROW][C]34[/C][C]0.140735[/C][C]1.2822[/C][C]0.101678[/C][/ROW]
[ROW][C]35[/C][C]-0.094965[/C][C]-0.8652[/C][C]0.19472[/C][/ROW]
[ROW][C]36[/C][C]-0.055691[/C][C]-0.5074[/C][C]0.30662[/C][/ROW]
[ROW][C]37[/C][C]0.045343[/C][C]0.4131[/C][C]0.3403[/C][/ROW]
[ROW][C]38[/C][C]-0.095401[/C][C]-0.8691[/C][C]0.193638[/C][/ROW]
[ROW][C]39[/C][C]0.031778[/C][C]0.2895[/C][C]0.386455[/C][/ROW]
[ROW][C]40[/C][C]-0.05476[/C][C]-0.4989[/C][C]0.309589[/C][/ROW]
[ROW][C]41[/C][C]0.045015[/C][C]0.4101[/C][C]0.341393[/C][/ROW]
[ROW][C]42[/C][C]-0.054562[/C][C]-0.4971[/C][C]0.310222[/C][/ROW]
[ROW][C]43[/C][C]-0.034547[/C][C]-0.3147[/C][C]0.376874[/C][/ROW]
[ROW][C]44[/C][C]-0.088513[/C][C]-0.8064[/C][C]0.211161[/C][/ROW]
[ROW][C]45[/C][C]-0.061069[/C][C]-0.5564[/C][C]0.289729[/C][/ROW]
[ROW][C]46[/C][C]0.020306[/C][C]0.185[/C][C]0.426841[/C][/ROW]
[ROW][C]47[/C][C]0.014697[/C][C]0.1339[/C][C]0.446906[/C][/ROW]
[ROW][C]48[/C][C]-0.032456[/C][C]-0.2957[/C][C]0.384102[/C][/ROW]
[ROW][C]49[/C][C]0.071977[/C][C]0.6557[/C][C]0.256903[/C][/ROW]
[ROW][C]50[/C][C]0.011832[/C][C]0.1078[/C][C]0.457209[/C][/ROW]
[ROW][C]51[/C][C]-0.017679[/C][C]-0.1611[/C][C]0.436216[/C][/ROW]
[ROW][C]52[/C][C]0.007954[/C][C]0.0725[/C][C]0.471205[/C][/ROW]
[ROW][C]53[/C][C]-0.185152[/C][C]-1.6868[/C][C]0.047697[/C][/ROW]
[ROW][C]54[/C][C]-0.086835[/C][C]-0.7911[/C][C]0.215568[/C][/ROW]
[ROW][C]55[/C][C]0.0433[/C][C]0.3945[/C][C]0.347118[/C][/ROW]
[ROW][C]56[/C][C]0.082698[/C][C]0.7534[/C][C]0.226666[/C][/ROW]
[ROW][C]57[/C][C]-0.056027[/C][C]-0.5104[/C][C]0.305551[/C][/ROW]
[ROW][C]58[/C][C]-0.08257[/C][C]-0.7523[/C][C]0.227014[/C][/ROW]
[ROW][C]59[/C][C]-0.023223[/C][C]-0.2116[/C][C]0.41648[/C][/ROW]
[ROW][C]60[/C][C]-0.017963[/C][C]-0.1637[/C][C]0.435202[/C][/ROW]
[/TABLE]
Source: https://freestatistics.org/blog/index.php?pk=110593&T=2

Globally Unique Identifier (entire table): ba.freestatistics.org/blog/index.php?pk=110593&T=2

As an alternative you can also use a QR Code:  

The GUIDs for individual cells are displayed in the table below:

Partial Autocorrelation Function
Time lag kPACF(k)T-STATP-value
1-0.307151-2.79830.003193
2-0.288854-2.63160.005065
3-0.165385-1.50670.067839
4-0.099825-0.90950.182873
50.0411820.37520.354241
6-0.133697-1.2180.11333
7-0.086601-0.7890.216188
8-0.018513-0.16870.433238
90.0360250.32820.371792
10-0.308696-2.81240.003068
11-0.349254-3.18190.00103
120.3678663.35140.000606
130.1639481.49360.069531
140.0799170.72810.234307
150.0162120.14770.44147
16-0.054683-0.49820.309836
170.0334840.30510.380546
18-0.018857-0.17180.432009
19-0.012407-0.1130.455138
200.0121870.1110.455932
21-0.028923-0.26350.396408
22-0.173321-1.5790.059066
23-0.05637-0.51360.304463
240.0067590.06160.475523
250.076230.69450.244657
260.0504930.460.323355
27-0.009111-0.0830.467024
280.0231550.2110.416721
290.0275980.25140.401053
300.0183750.16740.433728
31-0.033993-0.30970.378785
32-0.004685-0.04270.483028
33-0.111002-1.01130.157412
340.1407351.28220.101678
35-0.094965-0.86520.19472
36-0.055691-0.50740.30662
370.0453430.41310.3403
38-0.095401-0.86910.193638
390.0317780.28950.386455
40-0.05476-0.49890.309589
410.0450150.41010.341393
42-0.054562-0.49710.310222
43-0.034547-0.31470.376874
44-0.088513-0.80640.211161
45-0.061069-0.55640.289729
460.0203060.1850.426841
470.0146970.13390.446906
48-0.032456-0.29570.384102
490.0719770.65570.256903
500.0118320.10780.457209
51-0.017679-0.16110.436216
520.0079540.07250.471205
53-0.185152-1.68680.047697
54-0.086835-0.79110.215568
550.04330.39450.347118
560.0826980.75340.226666
57-0.056027-0.51040.305551
58-0.08257-0.75230.227014
59-0.023223-0.21160.41648
60-0.017963-0.16370.435202


Parameters (Session):
par1 = 60 ; par2 = 1 ; par3 = 1 ; par4 = 0 ; par5 = 12 ; par6 = White Noise ; par7 = 0.95 ;
Parameters (R input):
par1 = 60 ; par2 = 1 ; par3 = 1 ; par4 = 0 ; par5 = 12 ; par6 = White Noise ; par7 = 0.95 ; par8 = ;
R code (references can be found in the software module):
if (par1 == 'Default') {
par1 = 10*log10(length(x))
} else {
par1 <- as.numeric(par1)
}
par2 <- as.numeric(par2)
par3 <- as.numeric(par3)
par4 <- as.numeric(par4)
par5 <- as.numeric(par5)
if (par6 == 'White Noise') par6 <- 'white' else par6 <- 'ma'
par7 <- as.numeric(par7)
if (par8 != '') par8 <- as.numeric(par8)
ox <- x
if (par8 == '') {
if (par2 == 0) {
x <- log(x)
} else {
x <- (x ^ par2 - 1) / par2
}
} else {
x <- log(x,base=par8)
}
if (par3 > 0) x <- diff(x,lag=1,difference=par3)
if (par4 > 0) x <- diff(x,lag=par5,difference=par4)
bitmap(file='picts.png')
op <- par(mfrow=c(2,1))
plot(ox,type='l',main='Original Time Series',xlab='time',ylab='value')
if (par8=='') {
mytitle <- paste('Working Time Series (lambda=',par2,', d=',par3,', D=',par4,')',sep='')
mysub <- paste('(lambda=',par2,', d=',par3,', D=',par4,', CI=', par7, ', CI type=',par6,')',sep='')
} else {
mytitle <- paste('Working Time Series (base=',par8,', d=',par3,', D=',par4,')',sep='')
mysub <- paste('(base=',par8,', d=',par3,', D=',par4,', CI=', par7, ', CI type=',par6,')',sep='')
}
plot(x,type='l', main=mytitle,xlab='time',ylab='value')
par(op)
dev.off()
bitmap(file='pic1.png')
racf <- acf(x, par1, main='Autocorrelation', xlab='time lag', ylab='ACF', ci.type=par6, ci=par7, sub=mysub)
dev.off()
bitmap(file='pic2.png')
rpacf <- pacf(x,par1,main='Partial Autocorrelation',xlab='lags',ylab='PACF',sub=mysub)
dev.off()
(myacf <- c(racf$acf))
(mypacf <- c(rpacf$acf))
lengthx <- length(x)
sqrtn <- sqrt(lengthx)
load(file='createtable')
a<-table.start()
a<-table.row.start(a)
a<-table.element(a,'Autocorrelation Function',4,TRUE)
a<-table.row.end(a)
a<-table.row.start(a)
a<-table.element(a,'Time lag k',header=TRUE)
a<-table.element(a,hyperlink('basics.htm','ACF(k)','click here for more information about the Autocorrelation Function'),header=TRUE)
a<-table.element(a,'T-STAT',header=TRUE)
a<-table.element(a,'P-value',header=TRUE)
a<-table.row.end(a)
for (i in 2:(par1+1)) {
a<-table.row.start(a)
a<-table.element(a,i-1,header=TRUE)
a<-table.element(a,round(myacf[i],6))
mytstat <- myacf[i]*sqrtn
a<-table.element(a,round(mytstat,4))
a<-table.element(a,round(1-pt(abs(mytstat),lengthx),6))
a<-table.row.end(a)
}
a<-table.end(a)
table.save(a,file='mytable.tab')
a<-table.start()
a<-table.row.start(a)
a<-table.element(a,'Partial Autocorrelation Function',4,TRUE)
a<-table.row.end(a)
a<-table.row.start(a)
a<-table.element(a,'Time lag k',header=TRUE)
a<-table.element(a,hyperlink('basics.htm','PACF(k)','click here for more information about the Partial Autocorrelation Function'),header=TRUE)
a<-table.element(a,'T-STAT',header=TRUE)
a<-table.element(a,'P-value',header=TRUE)
a<-table.row.end(a)
for (i in 1:par1) {
a<-table.row.start(a)
a<-table.element(a,i,header=TRUE)
a<-table.element(a,round(mypacf[i],6))
mytstat <- mypacf[i]*sqrtn
a<-table.element(a,round(mytstat,4))
a<-table.element(a,round(1-pt(abs(mytstat),lengthx),6))
a<-table.row.end(a)
}
a<-table.end(a)
table.save(a,file='mytable1.tab')