Free Statistics

of Irreproducible Research!

Author's title

Author*The author of this computation has been verified*
R Software Modulerwasp_arimabackwardselection.wasp
Title produced by softwareARIMA Backward Selection
Date of computationWed, 15 Dec 2010 16:58:59 +0000
Cite this page as followsStatistical Computations at FreeStatistics.org, Office for Research Development and Education, URL https://freestatistics.org/blog/index.php?v=date/2010/Dec/15/t1292432802u8fnkcaxj988vgf.htm/, Retrieved Fri, 03 May 2024 04:23:50 +0000
Statistical Computations at FreeStatistics.org, Office for Research Development and Education, URL https://freestatistics.org/blog/index.php?pk=110586, Retrieved Fri, 03 May 2024 04:23:50 +0000
QR Codes:

Original text written by user:
IsPrivate?No (this computation is public)
User-defined keywords
Estimated Impact112
Family? (F = Feedback message, R = changed R code, M = changed R Module, P = changed Parameters, D = changed Data)
-       [ARIMA Backward Selection] [] [2010-12-15 16:58:59] [b7dd4adfab743bef2d672ff51f950617] [Current]
Feedback Forum

Post a new message
Dataseries X:
186448
190530
194207
190855
200779
204428
207617
212071
214239
215883
223484
221529
225247
226699
231406
232324
237192
236727
240698
240688
245283
243556
247826
245798
250479
249216
251896
247616
249994
246552
248771
247551
249745
245742
249019
245841
248771
244723
246878
246014
248496
244351
248016
246509
249426
247840
251035
250161
254278
250801
253985
249174
251287
247947
249992
243805
255812
250417
253033
248705
253950
251484
251093
245996
252721
248019
250464
245571
252690
250183
253639
254436
265280
268705
270643
271480


Summary of computational transaction
Raw Inputview raw input (R code)
Raw Outputview raw output of R engine
Computing time5 seconds
R Server'George Udny Yule' @ 72.249.76.132

\begin{tabular}{lllllllll}
\hline
Summary of computational transaction \tabularnewline
Raw Input & view raw input (R code)  \tabularnewline
Raw Output & view raw output of R engine  \tabularnewline
Computing time & 5 seconds \tabularnewline
R Server & 'George Udny Yule' @ 72.249.76.132 \tabularnewline
\hline
\end{tabular}
%Source: https://freestatistics.org/blog/index.php?pk=110586&T=0

[TABLE]
[ROW][C]Summary of computational transaction[/C][/ROW]
[ROW][C]Raw Input[/C][C]view raw input (R code) [/C][/ROW]
[ROW][C]Raw Output[/C][C]view raw output of R engine [/C][/ROW]
[ROW][C]Computing time[/C][C]5 seconds[/C][/ROW]
[ROW][C]R Server[/C][C]'George Udny Yule' @ 72.249.76.132[/C][/ROW]
[/TABLE]
Source: https://freestatistics.org/blog/index.php?pk=110586&T=0

Globally Unique Identifier (entire table): ba.freestatistics.org/blog/index.php?pk=110586&T=0

As an alternative you can also use a QR Code:  

The GUIDs for individual cells are displayed in the table below:

Summary of computational transaction
Raw Inputview raw input (R code)
Raw Outputview raw output of R engine
Computing time5 seconds
R Server'George Udny Yule' @ 72.249.76.132


ARIMA Parameter Estimation and Backward Selection
Iterationar1ar2ar3ma1sar1sar2sma1
Estimates ( 1 )-0.3350.18120.41280.29340.08170.0715-0.52
(p-val)(0.3331 )(0.1597 )(0.0028 )(0.3981 )(0.9016 )(0.8147 )(0.4008 )
Estimates ( 2 )-0.30940.18780.40680.266700.0455-0.4524
(p-val)(0.3873 )(0.1356 )(0.0038 )(0.4597 )(NA )(0.7934 )(0.0241 )
Estimates ( 3 )-0.34170.18050.41930.295100-0.4263
(p-val)(0.2548 )(0.1448 )(0.001 )(0.3367 )(NA )(NA )(0.0104 )
Estimates ( 4 )-0.0650.20050.3607000-0.5076
(p-val)(0.5729 )(0.0776 )(0.0036 )(NA )(NA )(NA )(1e-04 )
Estimates ( 5 )00.20220.3483000-0.5241
(p-val)(NA )(0.0746 )(0.0044 )(NA )(NA )(NA )(0 )
Estimates ( 6 )000.3466000-0.4955
(p-val)(NA )(NA )(0.0053 )(NA )(NA )(NA )(1e-04 )
Estimates ( 7 )NANANANANANANA
(p-val)(NA )(NA )(NA )(NA )(NA )(NA )(NA )
Estimates ( 8 )NANANANANANANA
(p-val)(NA )(NA )(NA )(NA )(NA )(NA )(NA )
Estimates ( 9 )NANANANANANANA
(p-val)(NA )(NA )(NA )(NA )(NA )(NA )(NA )
Estimates ( 10 )NANANANANANANA
(p-val)(NA )(NA )(NA )(NA )(NA )(NA )(NA )
Estimates ( 11 )NANANANANANANA
(p-val)(NA )(NA )(NA )(NA )(NA )(NA )(NA )
Estimates ( 12 )NANANANANANANA
(p-val)(NA )(NA )(NA )(NA )(NA )(NA )(NA )
Estimates ( 13 )NANANANANANANA
(p-val)(NA )(NA )(NA )(NA )(NA )(NA )(NA )

\begin{tabular}{lllllllll}
\hline
ARIMA Parameter Estimation and Backward Selection \tabularnewline
Iteration & ar1 & ar2 & ar3 & ma1 & sar1 & sar2 & sma1 \tabularnewline
Estimates ( 1 ) & -0.335 & 0.1812 & 0.4128 & 0.2934 & 0.0817 & 0.0715 & -0.52 \tabularnewline
(p-val) & (0.3331 ) & (0.1597 ) & (0.0028 ) & (0.3981 ) & (0.9016 ) & (0.8147 ) & (0.4008 ) \tabularnewline
Estimates ( 2 ) & -0.3094 & 0.1878 & 0.4068 & 0.2667 & 0 & 0.0455 & -0.4524 \tabularnewline
(p-val) & (0.3873 ) & (0.1356 ) & (0.0038 ) & (0.4597 ) & (NA ) & (0.7934 ) & (0.0241 ) \tabularnewline
Estimates ( 3 ) & -0.3417 & 0.1805 & 0.4193 & 0.2951 & 0 & 0 & -0.4263 \tabularnewline
(p-val) & (0.2548 ) & (0.1448 ) & (0.001 ) & (0.3367 ) & (NA ) & (NA ) & (0.0104 ) \tabularnewline
Estimates ( 4 ) & -0.065 & 0.2005 & 0.3607 & 0 & 0 & 0 & -0.5076 \tabularnewline
(p-val) & (0.5729 ) & (0.0776 ) & (0.0036 ) & (NA ) & (NA ) & (NA ) & (1e-04 ) \tabularnewline
Estimates ( 5 ) & 0 & 0.2022 & 0.3483 & 0 & 0 & 0 & -0.5241 \tabularnewline
(p-val) & (NA ) & (0.0746 ) & (0.0044 ) & (NA ) & (NA ) & (NA ) & (0 ) \tabularnewline
Estimates ( 6 ) & 0 & 0 & 0.3466 & 0 & 0 & 0 & -0.4955 \tabularnewline
(p-val) & (NA ) & (NA ) & (0.0053 ) & (NA ) & (NA ) & (NA ) & (1e-04 ) \tabularnewline
Estimates ( 7 ) & NA & NA & NA & NA & NA & NA & NA \tabularnewline
(p-val) & (NA ) & (NA ) & (NA ) & (NA ) & (NA ) & (NA ) & (NA ) \tabularnewline
Estimates ( 8 ) & NA & NA & NA & NA & NA & NA & NA \tabularnewline
(p-val) & (NA ) & (NA ) & (NA ) & (NA ) & (NA ) & (NA ) & (NA ) \tabularnewline
Estimates ( 9 ) & NA & NA & NA & NA & NA & NA & NA \tabularnewline
(p-val) & (NA ) & (NA ) & (NA ) & (NA ) & (NA ) & (NA ) & (NA ) \tabularnewline
Estimates ( 10 ) & NA & NA & NA & NA & NA & NA & NA \tabularnewline
(p-val) & (NA ) & (NA ) & (NA ) & (NA ) & (NA ) & (NA ) & (NA ) \tabularnewline
Estimates ( 11 ) & NA & NA & NA & NA & NA & NA & NA \tabularnewline
(p-val) & (NA ) & (NA ) & (NA ) & (NA ) & (NA ) & (NA ) & (NA ) \tabularnewline
Estimates ( 12 ) & NA & NA & NA & NA & NA & NA & NA \tabularnewline
(p-val) & (NA ) & (NA ) & (NA ) & (NA ) & (NA ) & (NA ) & (NA ) \tabularnewline
Estimates ( 13 ) & NA & NA & NA & NA & NA & NA & NA \tabularnewline
(p-val) & (NA ) & (NA ) & (NA ) & (NA ) & (NA ) & (NA ) & (NA ) \tabularnewline
\hline
\end{tabular}
%Source: https://freestatistics.org/blog/index.php?pk=110586&T=1

[TABLE]
[ROW][C]ARIMA Parameter Estimation and Backward Selection[/C][/ROW]
[ROW][C]Iteration[/C][C]ar1[/C][C]ar2[/C][C]ar3[/C][C]ma1[/C][C]sar1[/C][C]sar2[/C][C]sma1[/C][/ROW]
[ROW][C]Estimates ( 1 )[/C][C]-0.335[/C][C]0.1812[/C][C]0.4128[/C][C]0.2934[/C][C]0.0817[/C][C]0.0715[/C][C]-0.52[/C][/ROW]
[ROW][C](p-val)[/C][C](0.3331 )[/C][C](0.1597 )[/C][C](0.0028 )[/C][C](0.3981 )[/C][C](0.9016 )[/C][C](0.8147 )[/C][C](0.4008 )[/C][/ROW]
[ROW][C]Estimates ( 2 )[/C][C]-0.3094[/C][C]0.1878[/C][C]0.4068[/C][C]0.2667[/C][C]0[/C][C]0.0455[/C][C]-0.4524[/C][/ROW]
[ROW][C](p-val)[/C][C](0.3873 )[/C][C](0.1356 )[/C][C](0.0038 )[/C][C](0.4597 )[/C][C](NA )[/C][C](0.7934 )[/C][C](0.0241 )[/C][/ROW]
[ROW][C]Estimates ( 3 )[/C][C]-0.3417[/C][C]0.1805[/C][C]0.4193[/C][C]0.2951[/C][C]0[/C][C]0[/C][C]-0.4263[/C][/ROW]
[ROW][C](p-val)[/C][C](0.2548 )[/C][C](0.1448 )[/C][C](0.001 )[/C][C](0.3367 )[/C][C](NA )[/C][C](NA )[/C][C](0.0104 )[/C][/ROW]
[ROW][C]Estimates ( 4 )[/C][C]-0.065[/C][C]0.2005[/C][C]0.3607[/C][C]0[/C][C]0[/C][C]0[/C][C]-0.5076[/C][/ROW]
[ROW][C](p-val)[/C][C](0.5729 )[/C][C](0.0776 )[/C][C](0.0036 )[/C][C](NA )[/C][C](NA )[/C][C](NA )[/C][C](1e-04 )[/C][/ROW]
[ROW][C]Estimates ( 5 )[/C][C]0[/C][C]0.2022[/C][C]0.3483[/C][C]0[/C][C]0[/C][C]0[/C][C]-0.5241[/C][/ROW]
[ROW][C](p-val)[/C][C](NA )[/C][C](0.0746 )[/C][C](0.0044 )[/C][C](NA )[/C][C](NA )[/C][C](NA )[/C][C](0 )[/C][/ROW]
[ROW][C]Estimates ( 6 )[/C][C]0[/C][C]0[/C][C]0.3466[/C][C]0[/C][C]0[/C][C]0[/C][C]-0.4955[/C][/ROW]
[ROW][C](p-val)[/C][C](NA )[/C][C](NA )[/C][C](0.0053 )[/C][C](NA )[/C][C](NA )[/C][C](NA )[/C][C](1e-04 )[/C][/ROW]
[ROW][C]Estimates ( 7 )[/C][C]NA[/C][C]NA[/C][C]NA[/C][C]NA[/C][C]NA[/C][C]NA[/C][C]NA[/C][/ROW]
[ROW][C](p-val)[/C][C](NA )[/C][C](NA )[/C][C](NA )[/C][C](NA )[/C][C](NA )[/C][C](NA )[/C][C](NA )[/C][/ROW]
[ROW][C]Estimates ( 8 )[/C][C]NA[/C][C]NA[/C][C]NA[/C][C]NA[/C][C]NA[/C][C]NA[/C][C]NA[/C][/ROW]
[ROW][C](p-val)[/C][C](NA )[/C][C](NA )[/C][C](NA )[/C][C](NA )[/C][C](NA )[/C][C](NA )[/C][C](NA )[/C][/ROW]
[ROW][C]Estimates ( 9 )[/C][C]NA[/C][C]NA[/C][C]NA[/C][C]NA[/C][C]NA[/C][C]NA[/C][C]NA[/C][/ROW]
[ROW][C](p-val)[/C][C](NA )[/C][C](NA )[/C][C](NA )[/C][C](NA )[/C][C](NA )[/C][C](NA )[/C][C](NA )[/C][/ROW]
[ROW][C]Estimates ( 10 )[/C][C]NA[/C][C]NA[/C][C]NA[/C][C]NA[/C][C]NA[/C][C]NA[/C][C]NA[/C][/ROW]
[ROW][C](p-val)[/C][C](NA )[/C][C](NA )[/C][C](NA )[/C][C](NA )[/C][C](NA )[/C][C](NA )[/C][C](NA )[/C][/ROW]
[ROW][C]Estimates ( 11 )[/C][C]NA[/C][C]NA[/C][C]NA[/C][C]NA[/C][C]NA[/C][C]NA[/C][C]NA[/C][/ROW]
[ROW][C](p-val)[/C][C](NA )[/C][C](NA )[/C][C](NA )[/C][C](NA )[/C][C](NA )[/C][C](NA )[/C][C](NA )[/C][/ROW]
[ROW][C]Estimates ( 12 )[/C][C]NA[/C][C]NA[/C][C]NA[/C][C]NA[/C][C]NA[/C][C]NA[/C][C]NA[/C][/ROW]
[ROW][C](p-val)[/C][C](NA )[/C][C](NA )[/C][C](NA )[/C][C](NA )[/C][C](NA )[/C][C](NA )[/C][C](NA )[/C][/ROW]
[ROW][C]Estimates ( 13 )[/C][C]NA[/C][C]NA[/C][C]NA[/C][C]NA[/C][C]NA[/C][C]NA[/C][C]NA[/C][/ROW]
[ROW][C](p-val)[/C][C](NA )[/C][C](NA )[/C][C](NA )[/C][C](NA )[/C][C](NA )[/C][C](NA )[/C][C](NA )[/C][/ROW]
[/TABLE]
Source: https://freestatistics.org/blog/index.php?pk=110586&T=1

Globally Unique Identifier (entire table): ba.freestatistics.org/blog/index.php?pk=110586&T=1

As an alternative you can also use a QR Code:  

The GUIDs for individual cells are displayed in the table below:

ARIMA Parameter Estimation and Backward Selection
Iterationar1ar2ar3ma1sar1sar2sma1
Estimates ( 1 )-0.3350.18120.41280.29340.08170.0715-0.52
(p-val)(0.3331 )(0.1597 )(0.0028 )(0.3981 )(0.9016 )(0.8147 )(0.4008 )
Estimates ( 2 )-0.30940.18780.40680.266700.0455-0.4524
(p-val)(0.3873 )(0.1356 )(0.0038 )(0.4597 )(NA )(0.7934 )(0.0241 )
Estimates ( 3 )-0.34170.18050.41930.295100-0.4263
(p-val)(0.2548 )(0.1448 )(0.001 )(0.3367 )(NA )(NA )(0.0104 )
Estimates ( 4 )-0.0650.20050.3607000-0.5076
(p-val)(0.5729 )(0.0776 )(0.0036 )(NA )(NA )(NA )(1e-04 )
Estimates ( 5 )00.20220.3483000-0.5241
(p-val)(NA )(0.0746 )(0.0044 )(NA )(NA )(NA )(0 )
Estimates ( 6 )000.3466000-0.4955
(p-val)(NA )(NA )(0.0053 )(NA )(NA )(NA )(1e-04 )
Estimates ( 7 )NANANANANANANA
(p-val)(NA )(NA )(NA )(NA )(NA )(NA )(NA )
Estimates ( 8 )NANANANANANANA
(p-val)(NA )(NA )(NA )(NA )(NA )(NA )(NA )
Estimates ( 9 )NANANANANANANA
(p-val)(NA )(NA )(NA )(NA )(NA )(NA )(NA )
Estimates ( 10 )NANANANANANANA
(p-val)(NA )(NA )(NA )(NA )(NA )(NA )(NA )
Estimates ( 11 )NANANANANANANA
(p-val)(NA )(NA )(NA )(NA )(NA )(NA )(NA )
Estimates ( 12 )NANANANANANANA
(p-val)(NA )(NA )(NA )(NA )(NA )(NA )(NA )
Estimates ( 13 )NANANANANANANA
(p-val)(NA )(NA )(NA )(NA )(NA )(NA )(NA )


Estimated ARIMA Residuals
Value
-61398500.5306697
-50170611.9562072
-90565242.3431427
2653177045.91264
-2240570914.00404
-1232077483.96963
1434769069.68265
-503925110.791992
-441606639.171465
-806580533.67542
328047613.778977
777660397.812968
657513330.759815
-1137852092.56682
-663863370.100012
-67293422.6658567
645011450.626913
-1040638954.92127
15793563.3341636
-886162268.658963
602962795.193745
-201086674.733709
-418148793.272082
-1675015562.27364
-745620116.626504
-690534638.565388
163320490.376713
1269520643.44274
-58110473.7662917
-861093950.997105
92664086.567032
-214211552.342320
317649949.333784
-451883945.697547
-248879651.292323
912651044.394715
63227286.3049204
-318165453.381839
260054904.379655
245357176.591509
117481657.674422
892451276.686886
-7398296.94498098
105818380.505839
297403504.764255
-488496011.354148
-224972474.820311
-1951065502.94437
-529099586.961479
228942286.280969
189889880.479415
-1319879704.97439
4752300427.61518
-610229360.088148
-379906262.719908
-1314423426.44209
-561597353.278516
882142389.544464
-1340545143.42955
-179957577.963141
211952544.212539
-45274107.0990954
693776841.059231
-13618584.4804789
404154241.684562
555486531.794982
809841819.862022
2536415337.41736
1813856891.86413
2626113622.68319
-1680366322.26436
25889643.0143246

\begin{tabular}{lllllllll}
\hline
Estimated ARIMA Residuals \tabularnewline
Value \tabularnewline
-61398500.5306697 \tabularnewline
-50170611.9562072 \tabularnewline
-90565242.3431427 \tabularnewline
2653177045.91264 \tabularnewline
-2240570914.00404 \tabularnewline
-1232077483.96963 \tabularnewline
1434769069.68265 \tabularnewline
-503925110.791992 \tabularnewline
-441606639.171465 \tabularnewline
-806580533.67542 \tabularnewline
328047613.778977 \tabularnewline
777660397.812968 \tabularnewline
657513330.759815 \tabularnewline
-1137852092.56682 \tabularnewline
-663863370.100012 \tabularnewline
-67293422.6658567 \tabularnewline
645011450.626913 \tabularnewline
-1040638954.92127 \tabularnewline
15793563.3341636 \tabularnewline
-886162268.658963 \tabularnewline
602962795.193745 \tabularnewline
-201086674.733709 \tabularnewline
-418148793.272082 \tabularnewline
-1675015562.27364 \tabularnewline
-745620116.626504 \tabularnewline
-690534638.565388 \tabularnewline
163320490.376713 \tabularnewline
1269520643.44274 \tabularnewline
-58110473.7662917 \tabularnewline
-861093950.997105 \tabularnewline
92664086.567032 \tabularnewline
-214211552.342320 \tabularnewline
317649949.333784 \tabularnewline
-451883945.697547 \tabularnewline
-248879651.292323 \tabularnewline
912651044.394715 \tabularnewline
63227286.3049204 \tabularnewline
-318165453.381839 \tabularnewline
260054904.379655 \tabularnewline
245357176.591509 \tabularnewline
117481657.674422 \tabularnewline
892451276.686886 \tabularnewline
-7398296.94498098 \tabularnewline
105818380.505839 \tabularnewline
297403504.764255 \tabularnewline
-488496011.354148 \tabularnewline
-224972474.820311 \tabularnewline
-1951065502.94437 \tabularnewline
-529099586.961479 \tabularnewline
228942286.280969 \tabularnewline
189889880.479415 \tabularnewline
-1319879704.97439 \tabularnewline
4752300427.61518 \tabularnewline
-610229360.088148 \tabularnewline
-379906262.719908 \tabularnewline
-1314423426.44209 \tabularnewline
-561597353.278516 \tabularnewline
882142389.544464 \tabularnewline
-1340545143.42955 \tabularnewline
-179957577.963141 \tabularnewline
211952544.212539 \tabularnewline
-45274107.0990954 \tabularnewline
693776841.059231 \tabularnewline
-13618584.4804789 \tabularnewline
404154241.684562 \tabularnewline
555486531.794982 \tabularnewline
809841819.862022 \tabularnewline
2536415337.41736 \tabularnewline
1813856891.86413 \tabularnewline
2626113622.68319 \tabularnewline
-1680366322.26436 \tabularnewline
25889643.0143246 \tabularnewline
\hline
\end{tabular}
%Source: https://freestatistics.org/blog/index.php?pk=110586&T=2

[TABLE]
[ROW][C]Estimated ARIMA Residuals[/C][/ROW]
[ROW][C]Value[/C][/ROW]
[ROW][C]-61398500.5306697[/C][/ROW]
[ROW][C]-50170611.9562072[/C][/ROW]
[ROW][C]-90565242.3431427[/C][/ROW]
[ROW][C]2653177045.91264[/C][/ROW]
[ROW][C]-2240570914.00404[/C][/ROW]
[ROW][C]-1232077483.96963[/C][/ROW]
[ROW][C]1434769069.68265[/C][/ROW]
[ROW][C]-503925110.791992[/C][/ROW]
[ROW][C]-441606639.171465[/C][/ROW]
[ROW][C]-806580533.67542[/C][/ROW]
[ROW][C]328047613.778977[/C][/ROW]
[ROW][C]777660397.812968[/C][/ROW]
[ROW][C]657513330.759815[/C][/ROW]
[ROW][C]-1137852092.56682[/C][/ROW]
[ROW][C]-663863370.100012[/C][/ROW]
[ROW][C]-67293422.6658567[/C][/ROW]
[ROW][C]645011450.626913[/C][/ROW]
[ROW][C]-1040638954.92127[/C][/ROW]
[ROW][C]15793563.3341636[/C][/ROW]
[ROW][C]-886162268.658963[/C][/ROW]
[ROW][C]602962795.193745[/C][/ROW]
[ROW][C]-201086674.733709[/C][/ROW]
[ROW][C]-418148793.272082[/C][/ROW]
[ROW][C]-1675015562.27364[/C][/ROW]
[ROW][C]-745620116.626504[/C][/ROW]
[ROW][C]-690534638.565388[/C][/ROW]
[ROW][C]163320490.376713[/C][/ROW]
[ROW][C]1269520643.44274[/C][/ROW]
[ROW][C]-58110473.7662917[/C][/ROW]
[ROW][C]-861093950.997105[/C][/ROW]
[ROW][C]92664086.567032[/C][/ROW]
[ROW][C]-214211552.342320[/C][/ROW]
[ROW][C]317649949.333784[/C][/ROW]
[ROW][C]-451883945.697547[/C][/ROW]
[ROW][C]-248879651.292323[/C][/ROW]
[ROW][C]912651044.394715[/C][/ROW]
[ROW][C]63227286.3049204[/C][/ROW]
[ROW][C]-318165453.381839[/C][/ROW]
[ROW][C]260054904.379655[/C][/ROW]
[ROW][C]245357176.591509[/C][/ROW]
[ROW][C]117481657.674422[/C][/ROW]
[ROW][C]892451276.686886[/C][/ROW]
[ROW][C]-7398296.94498098[/C][/ROW]
[ROW][C]105818380.505839[/C][/ROW]
[ROW][C]297403504.764255[/C][/ROW]
[ROW][C]-488496011.354148[/C][/ROW]
[ROW][C]-224972474.820311[/C][/ROW]
[ROW][C]-1951065502.94437[/C][/ROW]
[ROW][C]-529099586.961479[/C][/ROW]
[ROW][C]228942286.280969[/C][/ROW]
[ROW][C]189889880.479415[/C][/ROW]
[ROW][C]-1319879704.97439[/C][/ROW]
[ROW][C]4752300427.61518[/C][/ROW]
[ROW][C]-610229360.088148[/C][/ROW]
[ROW][C]-379906262.719908[/C][/ROW]
[ROW][C]-1314423426.44209[/C][/ROW]
[ROW][C]-561597353.278516[/C][/ROW]
[ROW][C]882142389.544464[/C][/ROW]
[ROW][C]-1340545143.42955[/C][/ROW]
[ROW][C]-179957577.963141[/C][/ROW]
[ROW][C]211952544.212539[/C][/ROW]
[ROW][C]-45274107.0990954[/C][/ROW]
[ROW][C]693776841.059231[/C][/ROW]
[ROW][C]-13618584.4804789[/C][/ROW]
[ROW][C]404154241.684562[/C][/ROW]
[ROW][C]555486531.794982[/C][/ROW]
[ROW][C]809841819.862022[/C][/ROW]
[ROW][C]2536415337.41736[/C][/ROW]
[ROW][C]1813856891.86413[/C][/ROW]
[ROW][C]2626113622.68319[/C][/ROW]
[ROW][C]-1680366322.26436[/C][/ROW]
[ROW][C]25889643.0143246[/C][/ROW]
[/TABLE]
Source: https://freestatistics.org/blog/index.php?pk=110586&T=2

Globally Unique Identifier (entire table): ba.freestatistics.org/blog/index.php?pk=110586&T=2

As an alternative you can also use a QR Code:  

The GUIDs for individual cells are displayed in the table below:

Estimated ARIMA Residuals
Value
-61398500.5306697
-50170611.9562072
-90565242.3431427
2653177045.91264
-2240570914.00404
-1232077483.96963
1434769069.68265
-503925110.791992
-441606639.171465
-806580533.67542
328047613.778977
777660397.812968
657513330.759815
-1137852092.56682
-663863370.100012
-67293422.6658567
645011450.626913
-1040638954.92127
15793563.3341636
-886162268.658963
602962795.193745
-201086674.733709
-418148793.272082
-1675015562.27364
-745620116.626504
-690534638.565388
163320490.376713
1269520643.44274
-58110473.7662917
-861093950.997105
92664086.567032
-214211552.342320
317649949.333784
-451883945.697547
-248879651.292323
912651044.394715
63227286.3049204
-318165453.381839
260054904.379655
245357176.591509
117481657.674422
892451276.686886
-7398296.94498098
105818380.505839
297403504.764255
-488496011.354148
-224972474.820311
-1951065502.94437
-529099586.961479
228942286.280969
189889880.479415
-1319879704.97439
4752300427.61518
-610229360.088148
-379906262.719908
-1314423426.44209
-561597353.278516
882142389.544464
-1340545143.42955
-179957577.963141
211952544.212539
-45274107.0990954
693776841.059231
-13618584.4804789
404154241.684562
555486531.794982
809841819.862022
2536415337.41736
1813856891.86413
2626113622.68319
-1680366322.26436
25889643.0143246


Parameters (Session):
par1 = FALSE ; par2 = 2.0 ; par3 = 1 ; par4 = 1 ; par5 = 4 ; par6 = 3 ; par7 = 1 ; par8 = 2 ; par9 = 1 ;
Parameters (R input):
par1 = FALSE ; par2 = 2.0 ; par3 = 1 ; par4 = 1 ; par5 = 4 ; par6 = 3 ; par7 = 1 ; par8 = 2 ; par9 = 1 ;
R code (references can be found in the software module):
library(lattice)
if (par1 == 'TRUE') par1 <- TRUE
if (par1 == 'FALSE') par1 <- FALSE
par2 <- as.numeric(par2) #Box-Cox lambda transformation parameter
par3 <- as.numeric(par3) #degree of non-seasonal differencing
par4 <- as.numeric(par4) #degree of seasonal differencing
par5 <- as.numeric(par5) #seasonal period
par6 <- as.numeric(par6) #degree (p) of the non-seasonal AR(p) polynomial
par7 <- as.numeric(par7) #degree (q) of the non-seasonal MA(q) polynomial
par8 <- as.numeric(par8) #degree (P) of the seasonal AR(P) polynomial
par9 <- as.numeric(par9) #degree (Q) of the seasonal MA(Q) polynomial
armaGR <- function(arima.out, names, n){
try1 <- arima.out$coef
try2 <- sqrt(diag(arima.out$var.coef))
try.data.frame <- data.frame(matrix(NA,ncol=4,nrow=length(names)))
dimnames(try.data.frame) <- list(names,c('coef','std','tstat','pv'))
try.data.frame[,1] <- try1
for(i in 1:length(try2)) try.data.frame[which(rownames(try.data.frame)==names(try2)[i]),2] <- try2[i]
try.data.frame[,3] <- try.data.frame[,1] / try.data.frame[,2]
try.data.frame[,4] <- round((1-pt(abs(try.data.frame[,3]),df=n-(length(try2)+1)))*2,5)
vector <- rep(NA,length(names))
vector[is.na(try.data.frame[,4])] <- 0
maxi <- which.max(try.data.frame[,4])
continue <- max(try.data.frame[,4],na.rm=TRUE) > .05
vector[maxi] <- 0
list(summary=try.data.frame,next.vector=vector,continue=continue)
}
arimaSelect <- function(series, order=c(13,0,0), seasonal=list(order=c(2,0,0),period=12), include.mean=F){
nrc <- order[1]+order[3]+seasonal$order[1]+seasonal$order[3]
coeff <- matrix(NA, nrow=nrc*2, ncol=nrc)
pval <- matrix(NA, nrow=nrc*2, ncol=nrc)
mylist <- rep(list(NULL), nrc)
names <- NULL
if(order[1] > 0) names <- paste('ar',1:order[1],sep='')
if(order[3] > 0) names <- c( names , paste('ma',1:order[3],sep='') )
if(seasonal$order[1] > 0) names <- c(names, paste('sar',1:seasonal$order[1],sep=''))
if(seasonal$order[3] > 0) names <- c(names, paste('sma',1:seasonal$order[3],sep=''))
arima.out <- arima(series, order=order, seasonal=seasonal, include.mean=include.mean, method='ML')
mylist[[1]] <- arima.out
last.arma <- armaGR(arima.out, names, length(series))
mystop <- FALSE
i <- 1
coeff[i,] <- last.arma[[1]][,1]
pval [i,] <- last.arma[[1]][,4]
i <- 2
aic <- arima.out$aic
while(!mystop){
mylist[[i]] <- arima.out
arima.out <- arima(series, order=order, seasonal=seasonal, include.mean=include.mean, method='ML', fixed=last.arma$next.vector)
aic <- c(aic, arima.out$aic)
last.arma <- armaGR(arima.out, names, length(series))
mystop <- !last.arma$continue
coeff[i,] <- last.arma[[1]][,1]
pval [i,] <- last.arma[[1]][,4]
i <- i+1
}
list(coeff, pval, mylist, aic=aic)
}
arimaSelectplot <- function(arimaSelect.out,noms,choix){
noms <- names(arimaSelect.out[[3]][[1]]$coef)
coeff <- arimaSelect.out[[1]]
k <- min(which(is.na(coeff[,1])))-1
coeff <- coeff[1:k,]
pval <- arimaSelect.out[[2]][1:k,]
aic <- arimaSelect.out$aic[1:k]
coeff[coeff==0] <- NA
n <- ncol(coeff)
if(missing(choix)) choix <- k
layout(matrix(c(1,1,1,2,
3,3,3,2,
3,3,3,4,
5,6,7,7),nr=4),
widths=c(10,35,45,15),
heights=c(30,30,15,15))
couleurs <- rainbow(75)[1:50]#(50)
ticks <- pretty(coeff)
par(mar=c(1,1,3,1))
plot(aic,k:1-.5,type='o',pch=21,bg='blue',cex=2,axes=F,lty=2,xpd=NA)
points(aic[choix],k-choix+.5,pch=21,cex=4,bg=2,xpd=NA)
title('aic',line=2)
par(mar=c(3,0,0,0))
plot(0,axes=F,xlab='',ylab='',xlim=range(ticks),ylim=c(.1,1))
rect(xleft = min(ticks) + (0:49)/50*(max(ticks)-min(ticks)),
xright = min(ticks) + (1:50)/50*(max(ticks)-min(ticks)),
ytop = rep(1,50),
ybottom= rep(0,50),col=couleurs,border=NA)
axis(1,ticks)
rect(xleft=min(ticks),xright=max(ticks),ytop=1,ybottom=0)
text(mean(coeff,na.rm=T),.5,'coefficients',cex=2,font=2)
par(mar=c(1,1,3,1))
image(1:n,1:k,t(coeff[k:1,]),axes=F,col=couleurs,zlim=range(ticks))
for(i in 1:n) for(j in 1:k) if(!is.na(coeff[j,i])) {
if(pval[j,i]<.01) symb = 'green'
else if( (pval[j,i]<.05) & (pval[j,i]>=.01)) symb = 'orange'
else if( (pval[j,i]<.1) & (pval[j,i]>=.05)) symb = 'red'
else symb = 'black'
polygon(c(i+.5 ,i+.2 ,i+.5 ,i+.5),
c(k-j+0.5,k-j+0.5,k-j+0.8,k-j+0.5),
col=symb)
if(j==choix) {
rect(xleft=i-.5,
xright=i+.5,
ybottom=k-j+1.5,
ytop=k-j+.5,
lwd=4)
text(i,
k-j+1,
round(coeff[j,i],2),
cex=1.2,
font=2)
}
else{
rect(xleft=i-.5,xright=i+.5,ybottom=k-j+1.5,ytop=k-j+.5)
text(i,k-j+1,round(coeff[j,i],2),cex=1.2,font=1)
}
}
axis(3,1:n,noms)
par(mar=c(0.5,0,0,0.5))
plot(0,axes=F,xlab='',ylab='',type='n',xlim=c(0,8),ylim=c(-.2,.8))
cols <- c('green','orange','red','black')
niv <- c('0','0.01','0.05','0.1')
for(i in 0:3){
polygon(c(1+2*i ,1+2*i ,1+2*i-.5 ,1+2*i),
c(.4 ,.7 , .4 , .4),
col=cols[i+1])
text(2*i,0.5,niv[i+1],cex=1.5)
}
text(8,.5,1,cex=1.5)
text(4,0,'p-value',cex=2)
box()
residus <- arimaSelect.out[[3]][[choix]]$res
par(mar=c(1,2,4,1))
acf(residus,main='')
title('acf',line=.5)
par(mar=c(1,2,4,1))
pacf(residus,main='')
title('pacf',line=.5)
par(mar=c(2,2,4,1))
qqnorm(residus,main='')
title('qq-norm',line=.5)
qqline(residus)
residus
}
if (par2 == 0) x <- log(x)
if (par2 != 0) x <- x^par2
(selection <- arimaSelect(x, order=c(par6,par3,par7), seasonal=list(order=c(par8,par4,par9), period=par5)))
bitmap(file='test1.png')
resid <- arimaSelectplot(selection)
dev.off()
resid
bitmap(file='test2.png')
acf(resid,length(resid)/2, main='Residual Autocorrelation Function')
dev.off()
bitmap(file='test3.png')
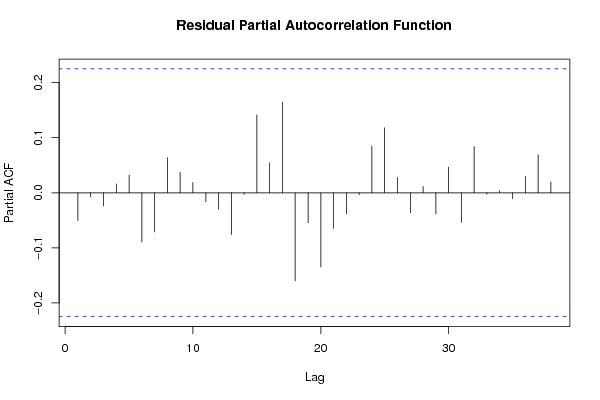
pacf(resid,length(resid)/2, main='Residual Partial Autocorrelation Function')
dev.off()
bitmap(file='test4.png')
cpgram(resid, main='Residual Cumulative Periodogram')
dev.off()
bitmap(file='test5.png')
hist(resid, main='Residual Histogram', xlab='values of Residuals')
dev.off()
bitmap(file='test6.png')
densityplot(~resid,col='black',main='Residual Density Plot', xlab='values of Residuals')
dev.off()
bitmap(file='test7.png')
qqnorm(resid, main='Residual Normal Q-Q Plot')
qqline(resid)
dev.off()
ncols <- length(selection[[1]][1,])
nrows <- length(selection[[2]][,1])-1
load(file='createtable')
a<-table.start()
a<-table.row.start(a)
a<-table.element(a,'ARIMA Parameter Estimation and Backward Selection', ncols+1,TRUE)
a<-table.row.end(a)
a<-table.row.start(a)
a<-table.element(a,'Iteration', header=TRUE)
for (i in 1:ncols) {
a<-table.element(a,names(selection[[3]][[1]]$coef)[i],header=TRUE)
}
a<-table.row.end(a)
for (j in 1:nrows) {
a<-table.row.start(a)
mydum <- 'Estimates ('
mydum <- paste(mydum,j)
mydum <- paste(mydum,')')
a<-table.element(a,mydum, header=TRUE)
for (i in 1:ncols) {
a<-table.element(a,round(selection[[1]][j,i],4))
}
a<-table.row.end(a)
a<-table.row.start(a)
a<-table.element(a,'(p-val)', header=TRUE)
for (i in 1:ncols) {
mydum <- '('
mydum <- paste(mydum,round(selection[[2]][j,i],4),sep='')
mydum <- paste(mydum,')')
a<-table.element(a,mydum)
}
a<-table.row.end(a)
}
a<-table.end(a)
table.save(a,file='mytable.tab')
a<-table.start()
a<-table.row.start(a)
a<-table.element(a,'Estimated ARIMA Residuals', 1,TRUE)
a<-table.row.end(a)
a<-table.row.start(a)
a<-table.element(a,'Value', 1,TRUE)
a<-table.row.end(a)
for (i in (par4*par5+par3):length(resid)) {
a<-table.row.start(a)
a<-table.element(a,resid[i])
a<-table.row.end(a)
}
a<-table.end(a)
table.save(a,file='mytable1.tab')