Free Statistics

of Irreproducible Research!

Author's title

Author*The author of this computation has been verified*
R Software Modulerwasp_smp.wasp
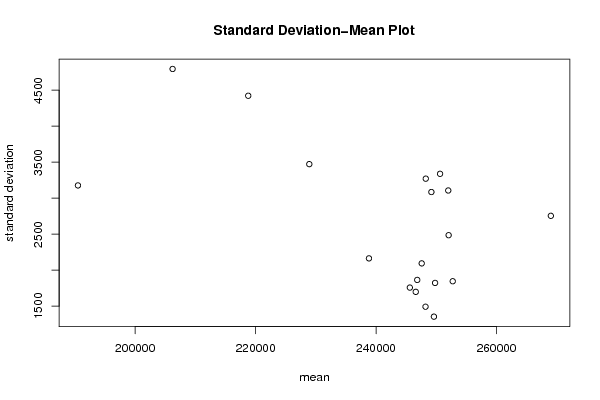
Title produced by softwareStandard Deviation-Mean Plot
Date of computationWed, 15 Dec 2010 16:51:46 +0000
Cite this page as followsStatistical Computations at FreeStatistics.org, Office for Research Development and Education, URL https://freestatistics.org/blog/index.php?v=date/2010/Dec/15/t1292431843wbdteqyys1m37hj.htm/, Retrieved Fri, 03 May 2024 08:32:52 +0000
Statistical Computations at FreeStatistics.org, Office for Research Development and Education, URL https://freestatistics.org/blog/index.php?pk=110567, Retrieved Fri, 03 May 2024 08:32:52 +0000
QR Codes:

Original text written by user:
IsPrivate?No (this computation is public)
User-defined keywords
Estimated Impact135
Family? (F = Feedback message, R = changed R code, M = changed R Module, P = changed Parameters, D = changed Data)
-       [Standard Deviation-Mean Plot] [] [2010-12-15 16:51:46] [b7dd4adfab743bef2d672ff51f950617] [Current]
Feedback Forum

Post a new message
Dataseries X:
186448
190530
194207
190855
200779
204428
207617
212071
214239
215883
223484
221529
225247
226699
231406
232324
237192
236727
240698
240688
245283
243556
247826
245798
250479
249216
251896
247616
249994
246552
248771
247551
249745
245742
249019
245841
248771
244723
246878
246014
248496
244351
248016
246509
249426
247840
251035
250161
254278
250801
253985
249174
251287
247947
249992
243805
255812
250417
253033
248705
253950
251484
251093
245996
252721
248019
250464
245571
252690
250183
253639
254436
265280
268705
270643
271480


Summary of computational transaction
Raw Inputview raw input (R code)
Raw Outputview raw output of R engine
Computing time1 seconds
R Server'George Udny Yule' @ 72.249.76.132

\begin{tabular}{lllllllll}
\hline
Summary of computational transaction \tabularnewline
Raw Input & view raw input (R code)  \tabularnewline
Raw Output & view raw output of R engine  \tabularnewline
Computing time & 1 seconds \tabularnewline
R Server & 'George Udny Yule' @ 72.249.76.132 \tabularnewline
\hline
\end{tabular}
%Source: https://freestatistics.org/blog/index.php?pk=110567&T=0

[TABLE]
[ROW][C]Summary of computational transaction[/C][/ROW]
[ROW][C]Raw Input[/C][C]view raw input (R code) [/C][/ROW]
[ROW][C]Raw Output[/C][C]view raw output of R engine [/C][/ROW]
[ROW][C]Computing time[/C][C]1 seconds[/C][/ROW]
[ROW][C]R Server[/C][C]'George Udny Yule' @ 72.249.76.132[/C][/ROW]
[/TABLE]
Source: https://freestatistics.org/blog/index.php?pk=110567&T=0

Globally Unique Identifier (entire table): ba.freestatistics.org/blog/index.php?pk=110567&T=0

As an alternative you can also use a QR Code:  

The GUIDs for individual cells are displayed in the table below:

Summary of computational transaction
Raw Inputview raw input (R code)
Raw Outputview raw output of R engine
Computing time1 seconds
R Server'George Udny Yule' @ 72.249.76.132


Standard Deviation-Mean Plot
SectionMeanStandard DeviationRange
11905103177.371974866447759
2206223.754795.883608192911292
3218783.754423.341525362929245
42289193473.287491700057077
5238826.252163.884219792423971
6245615.751758.001967196474270
7249801.751822.558343830634280
82482171492.249532305733442
9247586.752094.447321689744003
10246596.51698.725110192944048
112468431864.578415263534145
12249615.51354.112378398983195
13252059.52485.908619934915104
14248257.753271.468923383917482
15251991.753107.039037948087107
16250630.753338.66434121997954
17249193.753085.416381949127150
182527371846.196992017194253
192690272755.138109060966200

\begin{tabular}{lllllllll}
\hline
Standard Deviation-Mean Plot \tabularnewline
Section & Mean & Standard Deviation & Range \tabularnewline
1 & 190510 & 3177.37197486644 & 7759 \tabularnewline
2 & 206223.75 & 4795.8836081929 & 11292 \tabularnewline
3 & 218783.75 & 4423.34152536292 & 9245 \tabularnewline
4 & 228919 & 3473.28749170005 & 7077 \tabularnewline
5 & 238826.25 & 2163.88421979242 & 3971 \tabularnewline
6 & 245615.75 & 1758.00196719647 & 4270 \tabularnewline
7 & 249801.75 & 1822.55834383063 & 4280 \tabularnewline
8 & 248217 & 1492.24953230573 & 3442 \tabularnewline
9 & 247586.75 & 2094.44732168974 & 4003 \tabularnewline
10 & 246596.5 & 1698.72511019294 & 4048 \tabularnewline
11 & 246843 & 1864.57841526353 & 4145 \tabularnewline
12 & 249615.5 & 1354.11237839898 & 3195 \tabularnewline
13 & 252059.5 & 2485.90861993491 & 5104 \tabularnewline
14 & 248257.75 & 3271.46892338391 & 7482 \tabularnewline
15 & 251991.75 & 3107.03903794808 & 7107 \tabularnewline
16 & 250630.75 & 3338.6643412199 & 7954 \tabularnewline
17 & 249193.75 & 3085.41638194912 & 7150 \tabularnewline
18 & 252737 & 1846.19699201719 & 4253 \tabularnewline
19 & 269027 & 2755.13810906096 & 6200 \tabularnewline
\hline
\end{tabular}
%Source: https://freestatistics.org/blog/index.php?pk=110567&T=1

[TABLE]
[ROW][C]Standard Deviation-Mean Plot[/C][/ROW]
[ROW][C]Section[/C][C]Mean[/C][C]Standard Deviation[/C][C]Range[/C][/ROW]
[ROW][C]1[/C][C]190510[/C][C]3177.37197486644[/C][C]7759[/C][/ROW]
[ROW][C]2[/C][C]206223.75[/C][C]4795.8836081929[/C][C]11292[/C][/ROW]
[ROW][C]3[/C][C]218783.75[/C][C]4423.34152536292[/C][C]9245[/C][/ROW]
[ROW][C]4[/C][C]228919[/C][C]3473.28749170005[/C][C]7077[/C][/ROW]
[ROW][C]5[/C][C]238826.25[/C][C]2163.88421979242[/C][C]3971[/C][/ROW]
[ROW][C]6[/C][C]245615.75[/C][C]1758.00196719647[/C][C]4270[/C][/ROW]
[ROW][C]7[/C][C]249801.75[/C][C]1822.55834383063[/C][C]4280[/C][/ROW]
[ROW][C]8[/C][C]248217[/C][C]1492.24953230573[/C][C]3442[/C][/ROW]
[ROW][C]9[/C][C]247586.75[/C][C]2094.44732168974[/C][C]4003[/C][/ROW]
[ROW][C]10[/C][C]246596.5[/C][C]1698.72511019294[/C][C]4048[/C][/ROW]
[ROW][C]11[/C][C]246843[/C][C]1864.57841526353[/C][C]4145[/C][/ROW]
[ROW][C]12[/C][C]249615.5[/C][C]1354.11237839898[/C][C]3195[/C][/ROW]
[ROW][C]13[/C][C]252059.5[/C][C]2485.90861993491[/C][C]5104[/C][/ROW]
[ROW][C]14[/C][C]248257.75[/C][C]3271.46892338391[/C][C]7482[/C][/ROW]
[ROW][C]15[/C][C]251991.75[/C][C]3107.03903794808[/C][C]7107[/C][/ROW]
[ROW][C]16[/C][C]250630.75[/C][C]3338.6643412199[/C][C]7954[/C][/ROW]
[ROW][C]17[/C][C]249193.75[/C][C]3085.41638194912[/C][C]7150[/C][/ROW]
[ROW][C]18[/C][C]252737[/C][C]1846.19699201719[/C][C]4253[/C][/ROW]
[ROW][C]19[/C][C]269027[/C][C]2755.13810906096[/C][C]6200[/C][/ROW]
[/TABLE]
Source: https://freestatistics.org/blog/index.php?pk=110567&T=1

Globally Unique Identifier (entire table): ba.freestatistics.org/blog/index.php?pk=110567&T=1

As an alternative you can also use a QR Code:  

The GUIDs for individual cells are displayed in the table below:

Standard Deviation-Mean Plot
SectionMeanStandard DeviationRange
11905103177.371974866447759
2206223.754795.883608192911292
3218783.754423.341525362929245
42289193473.287491700057077
5238826.252163.884219792423971
6245615.751758.001967196474270
7249801.751822.558343830634280
82482171492.249532305733442
9247586.752094.447321689744003
10246596.51698.725110192944048
112468431864.578415263534145
12249615.51354.112378398983195
13252059.52485.908619934915104
14248257.753271.468923383917482
15251991.753107.039037948087107
16250630.753338.66434121997954
17249193.753085.416381949127150
182527371846.196992017194253
192690272755.138109060966200


Regression: S.E.(k) = alpha + beta * Mean(k)
alpha9847.92696404756
beta-0.0298604452054595
S.D.0.0106439857388115
T-STAT-2.80538192536077
p-value0.0121667862023333

\begin{tabular}{lllllllll}
\hline
Regression: S.E.(k) = alpha + beta * Mean(k) \tabularnewline
alpha & 9847.92696404756 \tabularnewline
beta & -0.0298604452054595 \tabularnewline
S.D. & 0.0106439857388115 \tabularnewline
T-STAT & -2.80538192536077 \tabularnewline
p-value & 0.0121667862023333 \tabularnewline
\hline
\end{tabular}
%Source: https://freestatistics.org/blog/index.php?pk=110567&T=2

[TABLE]
[ROW][C]Regression: S.E.(k) = alpha + beta * Mean(k)[/C][/ROW]
[ROW][C]alpha[/C][C]9847.92696404756[/C][/ROW]
[ROW][C]beta[/C][C]-0.0298604452054595[/C][/ROW]
[ROW][C]S.D.[/C][C]0.0106439857388115[/C][/ROW]
[ROW][C]T-STAT[/C][C]-2.80538192536077[/C][/ROW]
[ROW][C]p-value[/C][C]0.0121667862023333[/C][/ROW]
[/TABLE]
Source: https://freestatistics.org/blog/index.php?pk=110567&T=2

Globally Unique Identifier (entire table): ba.freestatistics.org/blog/index.php?pk=110567&T=2

As an alternative you can also use a QR Code:  

The GUIDs for individual cells are displayed in the table below:

Regression: S.E.(k) = alpha + beta * Mean(k)
alpha9847.92696404756
beta-0.0298604452054595
S.D.0.0106439857388115
T-STAT-2.80538192536077
p-value0.0121667862023333


Regression: ln S.E.(k) = alpha + beta * ln Mean(k)
alpha36.123460017829
beta-2.28462641581909
S.D.0.941137250997704
T-STAT-2.42751672340793
p-value0.0266012727595411
Lambda3.28462641581909

\begin{tabular}{lllllllll}
\hline
Regression: ln S.E.(k) = alpha + beta * ln Mean(k) \tabularnewline
alpha & 36.123460017829 \tabularnewline
beta & -2.28462641581909 \tabularnewline
S.D. & 0.941137250997704 \tabularnewline
T-STAT & -2.42751672340793 \tabularnewline
p-value & 0.0266012727595411 \tabularnewline
Lambda & 3.28462641581909 \tabularnewline
\hline
\end{tabular}
%Source: https://freestatistics.org/blog/index.php?pk=110567&T=3

[TABLE]
[ROW][C]Regression: ln S.E.(k) = alpha + beta * ln Mean(k)[/C][/ROW]
[ROW][C]alpha[/C][C]36.123460017829[/C][/ROW]
[ROW][C]beta[/C][C]-2.28462641581909[/C][/ROW]
[ROW][C]S.D.[/C][C]0.941137250997704[/C][/ROW]
[ROW][C]T-STAT[/C][C]-2.42751672340793[/C][/ROW]
[ROW][C]p-value[/C][C]0.0266012727595411[/C][/ROW]
[ROW][C]Lambda[/C][C]3.28462641581909[/C][/ROW]
[/TABLE]
Source: https://freestatistics.org/blog/index.php?pk=110567&T=3

Globally Unique Identifier (entire table): ba.freestatistics.org/blog/index.php?pk=110567&T=3

As an alternative you can also use a QR Code:  

The GUIDs for individual cells are displayed in the table below:

Regression: ln S.E.(k) = alpha + beta * ln Mean(k)
alpha36.123460017829
beta-2.28462641581909
S.D.0.941137250997704
T-STAT-2.42751672340793
p-value0.0266012727595411
Lambda3.28462641581909


Parameters (Session):
par1 = 4 ;
Parameters (R input):
par1 = 4 ;
R code (references can be found in the software module):
par1 <- as.numeric(par1)
(n <- length(x))
(np <- floor(n / par1))
arr <- array(NA,dim=c(par1,np))
j <- 0
k <- 1
for (i in 1:(np*par1))
{
j = j + 1
arr[j,k] <- x[i]
if (j == par1) {
j = 0
k=k+1
}
}
arr
arr.mean <- array(NA,dim=np)
arr.sd <- array(NA,dim=np)
arr.range <- array(NA,dim=np)
for (j in 1:np)
{
arr.mean[j] <- mean(arr[,j],na.rm=TRUE)
arr.sd[j] <- sd(arr[,j],na.rm=TRUE)
arr.range[j] <- max(arr[,j],na.rm=TRUE) - min(arr[,j],na.rm=TRUE)
}
arr.mean
arr.sd
arr.range
(lm1 <- lm(arr.sd~arr.mean))
(lnlm1 <- lm(log(arr.sd)~log(arr.mean)))
(lm2 <- lm(arr.range~arr.mean))
bitmap(file='test1.png')
plot(arr.mean,arr.sd,main='Standard Deviation-Mean Plot',xlab='mean',ylab='standard deviation')
dev.off()
bitmap(file='test2.png')
plot(arr.mean,arr.range,main='Range-Mean Plot',xlab='mean',ylab='range')
dev.off()
load(file='createtable')
a<-table.start()
a<-table.row.start(a)
a<-table.element(a,'Standard Deviation-Mean Plot',4,TRUE)
a<-table.row.end(a)
a<-table.row.start(a)
a<-table.element(a,'Section',header=TRUE)
a<-table.element(a,'Mean',header=TRUE)
a<-table.element(a,'Standard Deviation',header=TRUE)
a<-table.element(a,'Range',header=TRUE)
a<-table.row.end(a)
for (j in 1:np) {
a<-table.row.start(a)
a<-table.element(a,j,header=TRUE)
a<-table.element(a,arr.mean[j])
a<-table.element(a,arr.sd[j] )
a<-table.element(a,arr.range[j] )
a<-table.row.end(a)
}
a<-table.end(a)
table.save(a,file='mytable.tab')
a<-table.start()
a<-table.row.start(a)
a<-table.element(a,'Regression: S.E.(k) = alpha + beta * Mean(k)',2,TRUE)
a<-table.row.end(a)
a<-table.row.start(a)
a<-table.element(a,'alpha',header=TRUE)
a<-table.element(a,lm1$coefficients[[1]])
a<-table.row.end(a)
a<-table.row.start(a)
a<-table.element(a,'beta',header=TRUE)
a<-table.element(a,lm1$coefficients[[2]])
a<-table.row.end(a)
a<-table.row.start(a)
a<-table.element(a,'S.D.',header=TRUE)
a<-table.element(a,summary(lm1)$coefficients[2,2])
a<-table.row.end(a)
a<-table.row.start(a)
a<-table.element(a,'T-STAT',header=TRUE)
a<-table.element(a,summary(lm1)$coefficients[2,3])
a<-table.row.end(a)
a<-table.row.start(a)
a<-table.element(a,'p-value',header=TRUE)
a<-table.element(a,summary(lm1)$coefficients[2,4])
a<-table.row.end(a)
a<-table.end(a)
table.save(a,file='mytable1.tab')
a<-table.start()
a<-table.row.start(a)
a<-table.element(a,'Regression: ln S.E.(k) = alpha + beta * ln Mean(k)',2,TRUE)
a<-table.row.end(a)
a<-table.row.start(a)
a<-table.element(a,'alpha',header=TRUE)
a<-table.element(a,lnlm1$coefficients[[1]])
a<-table.row.end(a)
a<-table.row.start(a)
a<-table.element(a,'beta',header=TRUE)
a<-table.element(a,lnlm1$coefficients[[2]])
a<-table.row.end(a)
a<-table.row.start(a)
a<-table.element(a,'S.D.',header=TRUE)
a<-table.element(a,summary(lnlm1)$coefficients[2,2])
a<-table.row.end(a)
a<-table.row.start(a)
a<-table.element(a,'T-STAT',header=TRUE)
a<-table.element(a,summary(lnlm1)$coefficients[2,3])
a<-table.row.end(a)
a<-table.row.start(a)
a<-table.element(a,'p-value',header=TRUE)
a<-table.element(a,summary(lnlm1)$coefficients[2,4])
a<-table.row.end(a)
a<-table.row.start(a)
a<-table.element(a,'Lambda',header=TRUE)
a<-table.element(a,1-lnlm1$coefficients[[2]])
a<-table.row.end(a)
a<-table.end(a)
table.save(a,file='mytable2.tab')