Free Statistics

of Irreproducible Research!

Author's title

Author*The author of this computation has been verified*
R Software Modulerwasp_autocorrelation.wasp
Title produced by software(Partial) Autocorrelation Function
Date of computationWed, 15 Dec 2010 16:44:23 +0000
Cite this page as followsStatistical Computations at FreeStatistics.org, Office for Research Development and Education, URL https://freestatistics.org/blog/index.php?v=date/2010/Dec/15/t1292431498blftys5pkardki6.htm/, Retrieved Fri, 03 May 2024 06:02:36 +0000
Statistical Computations at FreeStatistics.org, Office for Research Development and Education, URL https://freestatistics.org/blog/index.php?pk=110556, Retrieved Fri, 03 May 2024 06:02:36 +0000
QR Codes:

Original text written by user:
IsPrivate?No (this computation is public)
User-defined keywords
Estimated Impact158
Family? (F = Feedback message, R = changed R code, M = changed R Module, P = changed Parameters, D = changed Data)
-     [Univariate Data Series] [data set] [2008-12-01 19:54:57] [b98453cac15ba1066b407e146608df68]
- RMP   [Spectral Analysis] [Unemployment] [2010-11-29 09:21:38] [b98453cac15ba1066b407e146608df68]
- RMPD    [(Partial) Autocorrelation Function] [tutorial] [2010-12-13 19:38:16] [2db53827eae1799a3d605fb62e1e92dc]
- R PD        [(Partial) Autocorrelation Function] [tutorial 9d1] [2010-12-15 16:44:23] [6e19356a8195a048e2417405f21c29e8] [Current]
-   PD          [(Partial) Autocorrelation Function] [ACF stationair] [2010-12-17 20:36:18] [46df8573ee32a55e1a6edcfb6691f406]
Feedback Forum

Post a new message
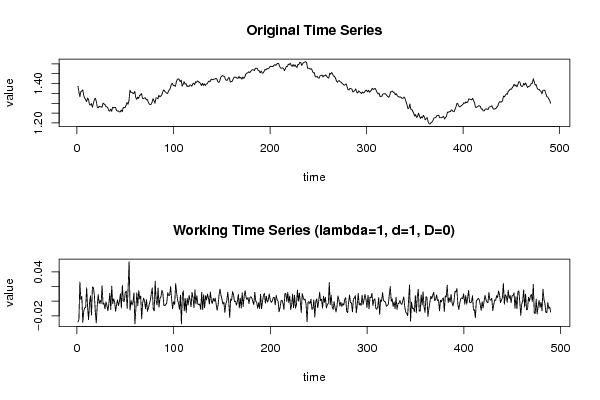
Dataseries X:
1.3866
1.3582
1.3332
1.3595
1.3617
1.3684
1.3394
1.3262
1.3173
1.3085
1.327
1.3182
1.293
1.291
1.2984
1.2795
1.299
1.3174
1.326
1.3111
1.2816
1.276
1.2849
1.2818
1.2829
1.2796
1.3008
1.2967
1.2938
1.2833
1.2823
1.2765
1.2634
1.2596
1.2705
1.2591
1.2798
1.2763
1.2795
1.2782
1.2644
1.2596
1.2615
1.2555
1.2555
1.2658
1.2565
1.2783
1.2786
1.2782
1.2905
1.3042
1.2942
1.313
1.3671
1.3549
1.3558
1.3507
1.3494
1.3607
1.3295
1.3193
1.3308
1.3246
1.3392
1.3425
1.3496
1.3255
1.3231
1.3273
1.3276
1.3173
1.3196
1.3058
1.2966
1.2932
1.2947
1.305
1.3232
1.3125
1.2992
1.3266
1.3275
1.3223
1.3403
1.3322
1.3363
1.3425
1.3574
1.3683
1.3623
1.3563
1.3518
1.3494
1.3612
1.369
1.3771
1.3972
1.401
1.3908
1.3901
1.3856
1.4098
1.422
1.4238
1.4207
1.4095
1.4177
1.3866
1.3959
1.4102
1.3969
1.4004
1.385
1.389
1.384
1.392
1.3932
1.3858
1.3978
1.4029
1.394
1.4096
1.4058
1.4134
1.4096
1.4049
1.4009
1.3897
1.4019
1.3901
1.399
1.3901
1.3975
1.3991
1.4089
1.413
1.409
1.4217
1.4223
1.4191
1.4229
1.4227
1.4269
1.4229
1.4104
1.4053
1.4138
1.4303
1.4384
1.441
1.437
1.4357
1.4202
1.4166
1.417
1.4293
1.4294
1.4072
1.4101
1.4112
1.4243
1.433
1.4323
1.4324
1.427
1.4268
1.4364
1.4272
1.4314
1.422
1.4335
1.4262
1.433
1.4473
1.4522
1.4545
1.4594
1.4561
1.4611
1.4671
1.4712
1.4705
1.4658
1.478
1.4783
1.4768
1.467
1.465
1.4549
1.4643
1.4539
1.4537
1.4616
1.4722
1.4694
1.4763
1.475
1.4765
1.4864
1.4881
1.4864
1.4869
1.4918
1.4971
1.4921
1.5
1.502
1.5019
1.4874
1.4785
1.4788
1.48
1.4772
1.4658
1.4761
1.4867
1.4862
1.4984
1.4966
1.5037
1.4922
1.4868
1.4965
1.4875
1.4957
1.4863
1.4815
1.4968
1.4969
1.5083
1.5071
1.4918
1.5023
1.5074
1.509
1.512
1.5068
1.4787
1.4774
1.4768
1.473
1.4757
1.4647
1.4541
1.456
1.4343
1.4337
1.4368
1.4279
1.4276
1.4398
1.4405
1.4433
1.4338
1.4406
1.4389
1.4442
1.435
1.4304
1.4273
1.4528
1.4481
1.4563
1.4486
1.4374
1.4369
1.4279
1.4132
1.4064
1.4135
1.4151
1.4085
1.4072
1.3999
1.3966
1.3913
1.3937
1.3984
1.3847
1.3691
1.3675
1.376
1.374
1.3718
1.3572
1.3607
1.3649
1.3726
1.3567
1.3519
1.3626
1.3577
1.3547
1.3489
1.357
1.3525
1.3548
1.3641
1.3668
1.3582
1.3662
1.3557
1.361
1.3657
1.3765
1.3705
1.3723
1.3756
1.366
1.3548
1.3471
1.3519
1.3338
1.3356
1.3353
1.3471
1.3482
1.3479
1.3468
1.3396
1.334
1.3296
1.3384
1.3585
1.3583
1.3615
1.3544
1.3535
1.3432
1.3486
1.3373
1.3339
1.3311
1.3321
1.329
1.3245
1.3256
1.3315
1.3238
1.3089
1.2924
1.2727
1.2746
1.2969
1.2698
1.2686
1.2587
1.2492
1.2349
1.2428
1.227
1.2334
1.2497
1.236
1.2223
1.2309
1.2255
1.2384
1.2307
1.2155
1.2218
1.2268
1.206
1.1959
1.1942
1.201
1.2045
1.2127
1.2249
1.2258
1.2277
1.2363
1.2372
1.2391
1.2258
1.2271
1.2262
1.2294
1.2339
1.2198
1.2271
1.2328
1.2548
1.2531
1.2579
1.2567
1.266
1.2637
1.2572
1.2569
1.2703
1.2828
1.3
1.2957
1.2844
1.2817
1.285
1.2897
1.2931
1.3033
1.2992
1.3069
1.3028
1.3073
1.3221
1.3206
1.3184
1.3176
1.3253
1.3133
1.3016
1.279
1.2799
1.282
1.286
1.288
1.2836
1.2711
1.2704
1.2611
1.2613
1.2693
1.2713
1.27
1.268
1.28
1.2818
1.2834
1.2874
1.2744
1.2697
1.2715
1.2725
1.2801
1.285
1.2989
1.3078
1.306
1.3074
1.312
1.3364
1.3323
1.3412
1.3477
1.346
1.3611
1.3648
1.3726
1.3705
1.378
1.3856
1.397
1.3874
1.3936
1.3833
1.3958
1.4101
1.4089
1.3896
1.3859
1.3861
1.4016
1.3934
1.4031
1.3912
1.3803
1.3857
1.3857
1.3926
1.4018
1.4014
1.4244
1.4084
1.3917
1.3945
1.377
1.37
1.3711
1.3626
1.3612
1.3481
1.3647
1.3674
1.3647
1.3496
1.3339
1.3321
1.3225
1.3146
1.2998


Summary of computational transaction
Raw Inputview raw input (R code)
Raw Outputview raw output of R engine
Computing time4 seconds
R Server'George Udny Yule' @ 72.249.76.132

\begin{tabular}{lllllllll}
\hline
Summary of computational transaction \tabularnewline
Raw Input & view raw input (R code)  \tabularnewline
Raw Output & view raw output of R engine  \tabularnewline
Computing time & 4 seconds \tabularnewline
R Server & 'George Udny Yule' @ 72.249.76.132 \tabularnewline
\hline
\end{tabular}
%Source: https://freestatistics.org/blog/index.php?pk=110556&T=0

[TABLE]
[ROW][C]Summary of computational transaction[/C][/ROW]
[ROW][C]Raw Input[/C][C]view raw input (R code) [/C][/ROW]
[ROW][C]Raw Output[/C][C]view raw output of R engine [/C][/ROW]
[ROW][C]Computing time[/C][C]4 seconds[/C][/ROW]
[ROW][C]R Server[/C][C]'George Udny Yule' @ 72.249.76.132[/C][/ROW]
[/TABLE]
Source: https://freestatistics.org/blog/index.php?pk=110556&T=0

Globally Unique Identifier (entire table): ba.freestatistics.org/blog/index.php?pk=110556&T=0

As an alternative you can also use a QR Code:  

The GUIDs for individual cells are displayed in the table below:

Summary of computational transaction
Raw Inputview raw input (R code)
Raw Outputview raw output of R engine
Computing time4 seconds
R Server'George Udny Yule' @ 72.249.76.132


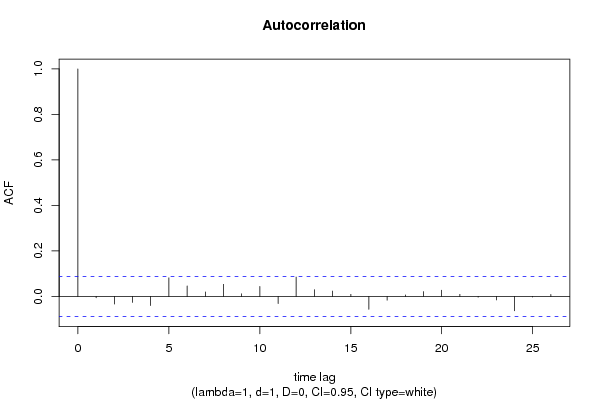
Autocorrelation Function
Time lag kACF(k)T-STATP-value
1-0.005539-0.12260.451233
2-0.033079-0.73220.23219
3-0.026009-0.57570.28253
4-0.040053-0.88660.18786
50.0819631.81430.035119
60.0466371.03240.151205
70.0201730.44650.327703
80.0535231.18480.118339
90.0116160.25710.398591
100.0441070.97630.164689
11-0.031172-0.690.245252
120.0854041.89050.029641
130.0298470.66070.254558
140.0237180.5250.299902
150.0095160.21060.416629
16-0.056075-1.24130.107548
17-0.016373-0.36240.358596
180.007020.15540.438286
190.02160.47810.31638
200.0276020.6110.27074
210.0095130.21060.416649
22-0.002756-0.0610.475686
23-0.014851-0.32870.371247
24-0.062808-1.39030.082534
25-0.00261-0.05780.476976
260.0088790.19650.422132

\begin{tabular}{lllllllll}
\hline
Autocorrelation Function \tabularnewline
Time lag k & ACF(k) & T-STAT & P-value \tabularnewline
1 & -0.005539 & -0.1226 & 0.451233 \tabularnewline
2 & -0.033079 & -0.7322 & 0.23219 \tabularnewline
3 & -0.026009 & -0.5757 & 0.28253 \tabularnewline
4 & -0.040053 & -0.8866 & 0.18786 \tabularnewline
5 & 0.081963 & 1.8143 & 0.035119 \tabularnewline
6 & 0.046637 & 1.0324 & 0.151205 \tabularnewline
7 & 0.020173 & 0.4465 & 0.327703 \tabularnewline
8 & 0.053523 & 1.1848 & 0.118339 \tabularnewline
9 & 0.011616 & 0.2571 & 0.398591 \tabularnewline
10 & 0.044107 & 0.9763 & 0.164689 \tabularnewline
11 & -0.031172 & -0.69 & 0.245252 \tabularnewline
12 & 0.085404 & 1.8905 & 0.029641 \tabularnewline
13 & 0.029847 & 0.6607 & 0.254558 \tabularnewline
14 & 0.023718 & 0.525 & 0.299902 \tabularnewline
15 & 0.009516 & 0.2106 & 0.416629 \tabularnewline
16 & -0.056075 & -1.2413 & 0.107548 \tabularnewline
17 & -0.016373 & -0.3624 & 0.358596 \tabularnewline
18 & 0.00702 & 0.1554 & 0.438286 \tabularnewline
19 & 0.0216 & 0.4781 & 0.31638 \tabularnewline
20 & 0.027602 & 0.611 & 0.27074 \tabularnewline
21 & 0.009513 & 0.2106 & 0.416649 \tabularnewline
22 & -0.002756 & -0.061 & 0.475686 \tabularnewline
23 & -0.014851 & -0.3287 & 0.371247 \tabularnewline
24 & -0.062808 & -1.3903 & 0.082534 \tabularnewline
25 & -0.00261 & -0.0578 & 0.476976 \tabularnewline
26 & 0.008879 & 0.1965 & 0.422132 \tabularnewline
\hline
\end{tabular}
%Source: https://freestatistics.org/blog/index.php?pk=110556&T=1

[TABLE]
[ROW][C]Autocorrelation Function[/C][/ROW]
[ROW][C]Time lag k[/C][C]ACF(k)[/C][C]T-STAT[/C][C]P-value[/C][/ROW]
[ROW][C]1[/C][C]-0.005539[/C][C]-0.1226[/C][C]0.451233[/C][/ROW]
[ROW][C]2[/C][C]-0.033079[/C][C]-0.7322[/C][C]0.23219[/C][/ROW]
[ROW][C]3[/C][C]-0.026009[/C][C]-0.5757[/C][C]0.28253[/C][/ROW]
[ROW][C]4[/C][C]-0.040053[/C][C]-0.8866[/C][C]0.18786[/C][/ROW]
[ROW][C]5[/C][C]0.081963[/C][C]1.8143[/C][C]0.035119[/C][/ROW]
[ROW][C]6[/C][C]0.046637[/C][C]1.0324[/C][C]0.151205[/C][/ROW]
[ROW][C]7[/C][C]0.020173[/C][C]0.4465[/C][C]0.327703[/C][/ROW]
[ROW][C]8[/C][C]0.053523[/C][C]1.1848[/C][C]0.118339[/C][/ROW]
[ROW][C]9[/C][C]0.011616[/C][C]0.2571[/C][C]0.398591[/C][/ROW]
[ROW][C]10[/C][C]0.044107[/C][C]0.9763[/C][C]0.164689[/C][/ROW]
[ROW][C]11[/C][C]-0.031172[/C][C]-0.69[/C][C]0.245252[/C][/ROW]
[ROW][C]12[/C][C]0.085404[/C][C]1.8905[/C][C]0.029641[/C][/ROW]
[ROW][C]13[/C][C]0.029847[/C][C]0.6607[/C][C]0.254558[/C][/ROW]
[ROW][C]14[/C][C]0.023718[/C][C]0.525[/C][C]0.299902[/C][/ROW]
[ROW][C]15[/C][C]0.009516[/C][C]0.2106[/C][C]0.416629[/C][/ROW]
[ROW][C]16[/C][C]-0.056075[/C][C]-1.2413[/C][C]0.107548[/C][/ROW]
[ROW][C]17[/C][C]-0.016373[/C][C]-0.3624[/C][C]0.358596[/C][/ROW]
[ROW][C]18[/C][C]0.00702[/C][C]0.1554[/C][C]0.438286[/C][/ROW]
[ROW][C]19[/C][C]0.0216[/C][C]0.4781[/C][C]0.31638[/C][/ROW]
[ROW][C]20[/C][C]0.027602[/C][C]0.611[/C][C]0.27074[/C][/ROW]
[ROW][C]21[/C][C]0.009513[/C][C]0.2106[/C][C]0.416649[/C][/ROW]
[ROW][C]22[/C][C]-0.002756[/C][C]-0.061[/C][C]0.475686[/C][/ROW]
[ROW][C]23[/C][C]-0.014851[/C][C]-0.3287[/C][C]0.371247[/C][/ROW]
[ROW][C]24[/C][C]-0.062808[/C][C]-1.3903[/C][C]0.082534[/C][/ROW]
[ROW][C]25[/C][C]-0.00261[/C][C]-0.0578[/C][C]0.476976[/C][/ROW]
[ROW][C]26[/C][C]0.008879[/C][C]0.1965[/C][C]0.422132[/C][/ROW]
[/TABLE]
Source: https://freestatistics.org/blog/index.php?pk=110556&T=1

Globally Unique Identifier (entire table): ba.freestatistics.org/blog/index.php?pk=110556&T=1

As an alternative you can also use a QR Code:  

The GUIDs for individual cells are displayed in the table below:

Autocorrelation Function
Time lag kACF(k)T-STATP-value
1-0.005539-0.12260.451233
2-0.033079-0.73220.23219
3-0.026009-0.57570.28253
4-0.040053-0.88660.18786
50.0819631.81430.035119
60.0466371.03240.151205
70.0201730.44650.327703
80.0535231.18480.118339
90.0116160.25710.398591
100.0441070.97630.164689
11-0.031172-0.690.245252
120.0854041.89050.029641
130.0298470.66070.254558
140.0237180.5250.299902
150.0095160.21060.416629
16-0.056075-1.24130.107548
17-0.016373-0.36240.358596
180.007020.15540.438286
190.02160.47810.31638
200.0276020.6110.27074
210.0095130.21060.416649
22-0.002756-0.0610.475686
23-0.014851-0.32870.371247
24-0.062808-1.39030.082534
25-0.00261-0.05780.476976
260.0088790.19650.422132


Partial Autocorrelation Function
Time lag kPACF(k)T-STATP-value
1-0.005539-0.12260.451233
2-0.03311-0.73290.231977
3-0.026411-0.58460.279529
4-0.041547-0.91970.179095
50.0799241.76920.038741
60.0446030.98730.161987
70.0243020.53790.295431
80.0599291.32660.092634
90.0231680.51280.304147
100.0471811.04440.148409
11-0.032367-0.71650.237022
120.0891791.97410.024467
130.0221450.49020.312103
140.0248790.55070.29104
150.0028290.06260.47505
16-0.049988-1.10650.134519
17-0.029188-0.64610.259258
18-0.01279-0.28310.388603
190.0098420.21790.413811
200.0067570.14960.44058
210.0132060.29230.385084
22-0.005238-0.11590.453871
23-0.006467-0.14320.443115
24-0.067375-1.49140.068248
25-0.007912-0.17510.430522
260.000440.00970.496117

\begin{tabular}{lllllllll}
\hline
Partial Autocorrelation Function \tabularnewline
Time lag k & PACF(k) & T-STAT & P-value \tabularnewline
1 & -0.005539 & -0.1226 & 0.451233 \tabularnewline
2 & -0.03311 & -0.7329 & 0.231977 \tabularnewline
3 & -0.026411 & -0.5846 & 0.279529 \tabularnewline
4 & -0.041547 & -0.9197 & 0.179095 \tabularnewline
5 & 0.079924 & 1.7692 & 0.038741 \tabularnewline
6 & 0.044603 & 0.9873 & 0.161987 \tabularnewline
7 & 0.024302 & 0.5379 & 0.295431 \tabularnewline
8 & 0.059929 & 1.3266 & 0.092634 \tabularnewline
9 & 0.023168 & 0.5128 & 0.304147 \tabularnewline
10 & 0.047181 & 1.0444 & 0.148409 \tabularnewline
11 & -0.032367 & -0.7165 & 0.237022 \tabularnewline
12 & 0.089179 & 1.9741 & 0.024467 \tabularnewline
13 & 0.022145 & 0.4902 & 0.312103 \tabularnewline
14 & 0.024879 & 0.5507 & 0.29104 \tabularnewline
15 & 0.002829 & 0.0626 & 0.47505 \tabularnewline
16 & -0.049988 & -1.1065 & 0.134519 \tabularnewline
17 & -0.029188 & -0.6461 & 0.259258 \tabularnewline
18 & -0.01279 & -0.2831 & 0.388603 \tabularnewline
19 & 0.009842 & 0.2179 & 0.413811 \tabularnewline
20 & 0.006757 & 0.1496 & 0.44058 \tabularnewline
21 & 0.013206 & 0.2923 & 0.385084 \tabularnewline
22 & -0.005238 & -0.1159 & 0.453871 \tabularnewline
23 & -0.006467 & -0.1432 & 0.443115 \tabularnewline
24 & -0.067375 & -1.4914 & 0.068248 \tabularnewline
25 & -0.007912 & -0.1751 & 0.430522 \tabularnewline
26 & 0.00044 & 0.0097 & 0.496117 \tabularnewline
\hline
\end{tabular}
%Source: https://freestatistics.org/blog/index.php?pk=110556&T=2

[TABLE]
[ROW][C]Partial Autocorrelation Function[/C][/ROW]
[ROW][C]Time lag k[/C][C]PACF(k)[/C][C]T-STAT[/C][C]P-value[/C][/ROW]
[ROW][C]1[/C][C]-0.005539[/C][C]-0.1226[/C][C]0.451233[/C][/ROW]
[ROW][C]2[/C][C]-0.03311[/C][C]-0.7329[/C][C]0.231977[/C][/ROW]
[ROW][C]3[/C][C]-0.026411[/C][C]-0.5846[/C][C]0.279529[/C][/ROW]
[ROW][C]4[/C][C]-0.041547[/C][C]-0.9197[/C][C]0.179095[/C][/ROW]
[ROW][C]5[/C][C]0.079924[/C][C]1.7692[/C][C]0.038741[/C][/ROW]
[ROW][C]6[/C][C]0.044603[/C][C]0.9873[/C][C]0.161987[/C][/ROW]
[ROW][C]7[/C][C]0.024302[/C][C]0.5379[/C][C]0.295431[/C][/ROW]
[ROW][C]8[/C][C]0.059929[/C][C]1.3266[/C][C]0.092634[/C][/ROW]
[ROW][C]9[/C][C]0.023168[/C][C]0.5128[/C][C]0.304147[/C][/ROW]
[ROW][C]10[/C][C]0.047181[/C][C]1.0444[/C][C]0.148409[/C][/ROW]
[ROW][C]11[/C][C]-0.032367[/C][C]-0.7165[/C][C]0.237022[/C][/ROW]
[ROW][C]12[/C][C]0.089179[/C][C]1.9741[/C][C]0.024467[/C][/ROW]
[ROW][C]13[/C][C]0.022145[/C][C]0.4902[/C][C]0.312103[/C][/ROW]
[ROW][C]14[/C][C]0.024879[/C][C]0.5507[/C][C]0.29104[/C][/ROW]
[ROW][C]15[/C][C]0.002829[/C][C]0.0626[/C][C]0.47505[/C][/ROW]
[ROW][C]16[/C][C]-0.049988[/C][C]-1.1065[/C][C]0.134519[/C][/ROW]
[ROW][C]17[/C][C]-0.029188[/C][C]-0.6461[/C][C]0.259258[/C][/ROW]
[ROW][C]18[/C][C]-0.01279[/C][C]-0.2831[/C][C]0.388603[/C][/ROW]
[ROW][C]19[/C][C]0.009842[/C][C]0.2179[/C][C]0.413811[/C][/ROW]
[ROW][C]20[/C][C]0.006757[/C][C]0.1496[/C][C]0.44058[/C][/ROW]
[ROW][C]21[/C][C]0.013206[/C][C]0.2923[/C][C]0.385084[/C][/ROW]
[ROW][C]22[/C][C]-0.005238[/C][C]-0.1159[/C][C]0.453871[/C][/ROW]
[ROW][C]23[/C][C]-0.006467[/C][C]-0.1432[/C][C]0.443115[/C][/ROW]
[ROW][C]24[/C][C]-0.067375[/C][C]-1.4914[/C][C]0.068248[/C][/ROW]
[ROW][C]25[/C][C]-0.007912[/C][C]-0.1751[/C][C]0.430522[/C][/ROW]
[ROW][C]26[/C][C]0.00044[/C][C]0.0097[/C][C]0.496117[/C][/ROW]
[/TABLE]
Source: https://freestatistics.org/blog/index.php?pk=110556&T=2

Globally Unique Identifier (entire table): ba.freestatistics.org/blog/index.php?pk=110556&T=2

As an alternative you can also use a QR Code:  

The GUIDs for individual cells are displayed in the table below:

Partial Autocorrelation Function
Time lag kPACF(k)T-STATP-value
1-0.005539-0.12260.451233
2-0.03311-0.73290.231977
3-0.026411-0.58460.279529
4-0.041547-0.91970.179095
50.0799241.76920.038741
60.0446030.98730.161987
70.0243020.53790.295431
80.0599291.32660.092634
90.0231680.51280.304147
100.0471811.04440.148409
11-0.032367-0.71650.237022
120.0891791.97410.024467
130.0221450.49020.312103
140.0248790.55070.29104
150.0028290.06260.47505
16-0.049988-1.10650.134519
17-0.029188-0.64610.259258
18-0.01279-0.28310.388603
190.0098420.21790.413811
200.0067570.14960.44058
210.0132060.29230.385084
22-0.005238-0.11590.453871
23-0.006467-0.14320.443115
24-0.067375-1.49140.068248
25-0.007912-0.17510.430522
260.000440.00970.496117


Parameters (Session):
par1 = Default ; par2 = 1 ; par3 = 1 ; par4 = 0 ; par5 = 12 ; par6 = White Noise ; par7 = 0.95 ;
Parameters (R input):
par1 = Default ; par2 = 1 ; par3 = 1 ; par4 = 0 ; par5 = 12 ; par6 = White Noise ; par7 = 0.95 ; par8 = ;
R code (references can be found in the software module):
if (par1 == 'Default') {
par1 = 10*log10(length(x))
} else {
par1 <- as.numeric(par1)
}
par2 <- as.numeric(par2)
par3 <- as.numeric(par3)
par4 <- as.numeric(par4)
par5 <- 5
if (par6 == 'White Noise') par6 <- 'white' else par6 <- 'ma'
par7 <- as.numeric(par7)
if (par8 != '') par8 <- as.numeric(par8)
ox <- x
if (par8 == '') {
if (par2 == 0) {
x <- log(x)
} else {
x <- (x ^ par2 - 1) / par2
}
} else {
x <- log(x,base=par8)
}
if (par3 > 0) x <- diff(x,lag=1,difference=par3)
if (par4 > 0) x <- diff(x,lag=par5,difference=par4)
bitmap(file='picts.png')
op <- par(mfrow=c(2,1))
plot(ox,type='l',main='Original Time Series',xlab='time',ylab='value')
if (par8=='') {
mytitle <- paste('Working Time Series (lambda=',par2,', d=',par3,', D=',par4,')',sep='')
mysub <- paste('(lambda=',par2,', d=',par3,', D=',par4,', CI=', par7, ', CI type=',par6,')',sep='')
} else {
mytitle <- paste('Working Time Series (base=',par8,', d=',par3,', D=',par4,')',sep='')
mysub <- paste('(base=',par8,', d=',par3,', D=',par4,', CI=', par7, ', CI type=',par6,')',sep='')
}
plot(x,type='l', main=mytitle,xlab='time',ylab='value')
par(op)
dev.off()
bitmap(file='pic1.png')
racf <- acf(x, par1, main='Autocorrelation', xlab='time lag', ylab='ACF', ci.type=par6, ci=par7, sub=mysub)
dev.off()
bitmap(file='pic2.png')
rpacf <- pacf(x,par1,main='Partial Autocorrelation',xlab='lags',ylab='PACF',sub=mysub)
dev.off()
(myacf <- c(racf$acf))
(mypacf <- c(rpacf$acf))
lengthx <- length(x)
sqrtn <- sqrt(lengthx)
load(file='createtable')
a<-table.start()
a<-table.row.start(a)
a<-table.element(a,'Autocorrelation Function',4,TRUE)
a<-table.row.end(a)
a<-table.row.start(a)
a<-table.element(a,'Time lag k',header=TRUE)
a<-table.element(a,hyperlink('basics.htm','ACF(k)','click here for more information about the Autocorrelation Function'),header=TRUE)
a<-table.element(a,'T-STAT',header=TRUE)
a<-table.element(a,'P-value',header=TRUE)
a<-table.row.end(a)
for (i in 2:(par1+1)) {
a<-table.row.start(a)
a<-table.element(a,i-1,header=TRUE)
a<-table.element(a,round(myacf[i],6))
mytstat <- myacf[i]*sqrtn
a<-table.element(a,round(mytstat,4))
a<-table.element(a,round(1-pt(abs(mytstat),lengthx),6))
a<-table.row.end(a)
}
a<-table.end(a)
table.save(a,file='mytable.tab')
a<-table.start()
a<-table.row.start(a)
a<-table.element(a,'Partial Autocorrelation Function',4,TRUE)
a<-table.row.end(a)
a<-table.row.start(a)
a<-table.element(a,'Time lag k',header=TRUE)
a<-table.element(a,hyperlink('basics.htm','PACF(k)','click here for more information about the Partial Autocorrelation Function'),header=TRUE)
a<-table.element(a,'T-STAT',header=TRUE)
a<-table.element(a,'P-value',header=TRUE)
a<-table.row.end(a)
for (i in 1:par1) {
a<-table.row.start(a)
a<-table.element(a,i,header=TRUE)
a<-table.element(a,round(mypacf[i],6))
mytstat <- mypacf[i]*sqrtn
a<-table.element(a,round(mytstat,4))
a<-table.element(a,round(1-pt(abs(mytstat),lengthx),6))
a<-table.row.end(a)
}
a<-table.end(a)
table.save(a,file='mytable1.tab')