Free Statistics

of Irreproducible Research!

Author's title

Author*The author of this computation has been verified*
R Software Modulerwasp_autocorrelation.wasp
Title produced by software(Partial) Autocorrelation Function
Date of computationWed, 15 Dec 2010 16:19:08 +0000
Cite this page as followsStatistical Computations at FreeStatistics.org, Office for Research Development and Education, URL https://freestatistics.org/blog/index.php?v=date/2010/Dec/15/t1292430082jj2j5jlbf152z88.htm/, Retrieved Fri, 03 May 2024 14:06:20 +0000
Statistical Computations at FreeStatistics.org, Office for Research Development and Education, URL https://freestatistics.org/blog/index.php?pk=110536, Retrieved Fri, 03 May 2024 14:06:20 +0000
QR Codes:

Original text written by user:
IsPrivate?No (this computation is public)
User-defined keywords
Estimated Impact173
Family? (F = Feedback message, R = changed R code, M = changed R Module, P = changed Parameters, D = changed Data)
-     [Pearson Correlation] [Paper Pearson Cor...] [2010-12-15 15:20:07] [d59201e34006b7e3f71c33fa566f42b3]
- RMPD    [(Partial) Autocorrelation Function] [Paper Auto Correl...] [2010-12-15 16:19:08] [f38914513f1f4d866974b642cdd0baea] [Current]
Feedback Forum

Post a new message
Dataseries X:
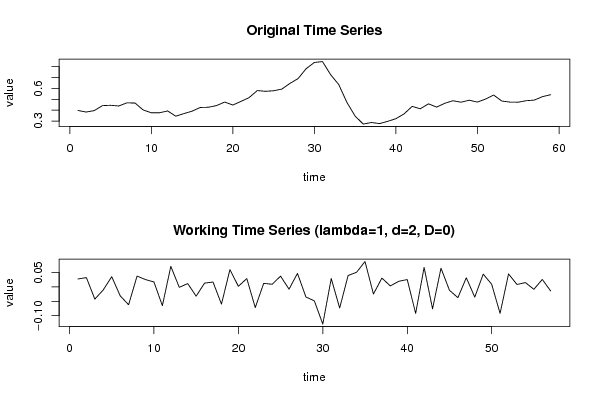
0.397232704
0.382767296
0.396037736
0.441761006
0.445220126
0.438490566
0.467484277
0.465786164
0.402075472
0.376163522
0.37591195
0.392955975
0.34490566
0.368553459
0.390880503
0.424842767
0.426855346
0.442327044
0.474842767
0.447610063
0.480754717
0.516037736
0.580628931
0.573522013
0.578867925
0.593584906
0.645974843
0.690503145
0.782201258
0.839056604
0.847484277
0.726855346
0.635534591
0.470943396
0.346163522
0.272327044
0.286792453
0.27672956
0.297421384
0.321698113
0.365597484
0.435220126
0.412893082
0.458679245
0.428427673
0.463522013
0.487169811
0.473584906
0.491886792
0.474842767
0.502327044
0.539371069
0.484402516
0.474654088
0.473522013
0.48754717
0.493333333
0.525157233
0.542704403


Summary of computational transaction
Raw Inputview raw input (R code)
Raw Outputview raw output of R engine
Computing time3 seconds
R Server'Gwilym Jenkins' @ 72.249.127.135

\begin{tabular}{lllllllll}
\hline
Summary of computational transaction \tabularnewline
Raw Input & view raw input (R code)  \tabularnewline
Raw Output & view raw output of R engine  \tabularnewline
Computing time & 3 seconds \tabularnewline
R Server & 'Gwilym Jenkins' @ 72.249.127.135 \tabularnewline
\hline
\end{tabular}
%Source: https://freestatistics.org/blog/index.php?pk=110536&T=0

[TABLE]
[ROW][C]Summary of computational transaction[/C][/ROW]
[ROW][C]Raw Input[/C][C]view raw input (R code) [/C][/ROW]
[ROW][C]Raw Output[/C][C]view raw output of R engine [/C][/ROW]
[ROW][C]Computing time[/C][C]3 seconds[/C][/ROW]
[ROW][C]R Server[/C][C]'Gwilym Jenkins' @ 72.249.127.135[/C][/ROW]
[/TABLE]
Source: https://freestatistics.org/blog/index.php?pk=110536&T=0

Globally Unique Identifier (entire table): ba.freestatistics.org/blog/index.php?pk=110536&T=0

As an alternative you can also use a QR Code:  

The GUIDs for individual cells are displayed in the table below:

Summary of computational transaction
Raw Inputview raw input (R code)
Raw Outputview raw output of R engine
Computing time3 seconds
R Server'Gwilym Jenkins' @ 72.249.127.135


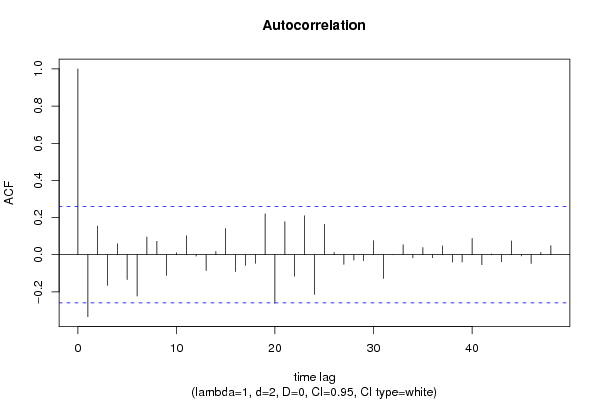
Autocorrelation Function
Time lag kACF(k)T-STATP-value
1-0.333234-2.51590.007358
20.154021.16280.124873
3-0.16519-1.24720.10872
40.059650.45040.327083
5-0.133428-1.00740.15901
6-0.222404-1.67910.049302
70.0954420.72060.237059
80.0723390.54610.293548
9-0.111054-0.83840.202644
100.0105670.07980.468347
110.1022570.7720.221644
12-0.007395-0.05580.477836
13-0.084649-0.63910.262663
140.0175080.13220.447653
150.1406121.06160.146448
16-0.090587-0.68390.248399
17-0.057256-0.43230.333587
18-0.045914-0.34660.365069
190.2206021.66550.050649
20-0.261165-1.97180.026749
210.1778311.34260.092363
22-0.115139-0.86930.19417
230.2093991.58090.059714
24-0.213816-1.61430.055995
250.1638711.23720.110544
260.0114890.08670.465592
27-0.051541-0.38910.349315
28-0.028914-0.21830.413989
29-0.032171-0.24290.404482
300.0759050.57310.284425
31-0.127474-0.96240.169954
32-0.000601-0.00450.498198
330.053310.40250.344417
34-0.01676-0.12650.449878
350.0389810.29430.384798
36-0.015813-0.11940.452694
370.0476410.35970.360206
38-0.039742-0.30.382617
39-0.038989-0.29440.384776
400.0877170.66230.255239
41-0.053256-0.40210.344567
420.0034970.02640.489516
43-0.037084-0.280.390254
440.0745010.56250.288001
45-0.006199-0.04680.481419
46-0.04672-0.35270.362798
470.0123230.0930.4631
480.048480.3660.357854

\begin{tabular}{lllllllll}
\hline
Autocorrelation Function \tabularnewline
Time lag k & ACF(k) & T-STAT & P-value \tabularnewline
1 & -0.333234 & -2.5159 & 0.007358 \tabularnewline
2 & 0.15402 & 1.1628 & 0.124873 \tabularnewline
3 & -0.16519 & -1.2472 & 0.10872 \tabularnewline
4 & 0.05965 & 0.4504 & 0.327083 \tabularnewline
5 & -0.133428 & -1.0074 & 0.15901 \tabularnewline
6 & -0.222404 & -1.6791 & 0.049302 \tabularnewline
7 & 0.095442 & 0.7206 & 0.237059 \tabularnewline
8 & 0.072339 & 0.5461 & 0.293548 \tabularnewline
9 & -0.111054 & -0.8384 & 0.202644 \tabularnewline
10 & 0.010567 & 0.0798 & 0.468347 \tabularnewline
11 & 0.102257 & 0.772 & 0.221644 \tabularnewline
12 & -0.007395 & -0.0558 & 0.477836 \tabularnewline
13 & -0.084649 & -0.6391 & 0.262663 \tabularnewline
14 & 0.017508 & 0.1322 & 0.447653 \tabularnewline
15 & 0.140612 & 1.0616 & 0.146448 \tabularnewline
16 & -0.090587 & -0.6839 & 0.248399 \tabularnewline
17 & -0.057256 & -0.4323 & 0.333587 \tabularnewline
18 & -0.045914 & -0.3466 & 0.365069 \tabularnewline
19 & 0.220602 & 1.6655 & 0.050649 \tabularnewline
20 & -0.261165 & -1.9718 & 0.026749 \tabularnewline
21 & 0.177831 & 1.3426 & 0.092363 \tabularnewline
22 & -0.115139 & -0.8693 & 0.19417 \tabularnewline
23 & 0.209399 & 1.5809 & 0.059714 \tabularnewline
24 & -0.213816 & -1.6143 & 0.055995 \tabularnewline
25 & 0.163871 & 1.2372 & 0.110544 \tabularnewline
26 & 0.011489 & 0.0867 & 0.465592 \tabularnewline
27 & -0.051541 & -0.3891 & 0.349315 \tabularnewline
28 & -0.028914 & -0.2183 & 0.413989 \tabularnewline
29 & -0.032171 & -0.2429 & 0.404482 \tabularnewline
30 & 0.075905 & 0.5731 & 0.284425 \tabularnewline
31 & -0.127474 & -0.9624 & 0.169954 \tabularnewline
32 & -0.000601 & -0.0045 & 0.498198 \tabularnewline
33 & 0.05331 & 0.4025 & 0.344417 \tabularnewline
34 & -0.01676 & -0.1265 & 0.449878 \tabularnewline
35 & 0.038981 & 0.2943 & 0.384798 \tabularnewline
36 & -0.015813 & -0.1194 & 0.452694 \tabularnewline
37 & 0.047641 & 0.3597 & 0.360206 \tabularnewline
38 & -0.039742 & -0.3 & 0.382617 \tabularnewline
39 & -0.038989 & -0.2944 & 0.384776 \tabularnewline
40 & 0.087717 & 0.6623 & 0.255239 \tabularnewline
41 & -0.053256 & -0.4021 & 0.344567 \tabularnewline
42 & 0.003497 & 0.0264 & 0.489516 \tabularnewline
43 & -0.037084 & -0.28 & 0.390254 \tabularnewline
44 & 0.074501 & 0.5625 & 0.288001 \tabularnewline
45 & -0.006199 & -0.0468 & 0.481419 \tabularnewline
46 & -0.04672 & -0.3527 & 0.362798 \tabularnewline
47 & 0.012323 & 0.093 & 0.4631 \tabularnewline
48 & 0.04848 & 0.366 & 0.357854 \tabularnewline
\hline
\end{tabular}
%Source: https://freestatistics.org/blog/index.php?pk=110536&T=1

[TABLE]
[ROW][C]Autocorrelation Function[/C][/ROW]
[ROW][C]Time lag k[/C][C]ACF(k)[/C][C]T-STAT[/C][C]P-value[/C][/ROW]
[ROW][C]1[/C][C]-0.333234[/C][C]-2.5159[/C][C]0.007358[/C][/ROW]
[ROW][C]2[/C][C]0.15402[/C][C]1.1628[/C][C]0.124873[/C][/ROW]
[ROW][C]3[/C][C]-0.16519[/C][C]-1.2472[/C][C]0.10872[/C][/ROW]
[ROW][C]4[/C][C]0.05965[/C][C]0.4504[/C][C]0.327083[/C][/ROW]
[ROW][C]5[/C][C]-0.133428[/C][C]-1.0074[/C][C]0.15901[/C][/ROW]
[ROW][C]6[/C][C]-0.222404[/C][C]-1.6791[/C][C]0.049302[/C][/ROW]
[ROW][C]7[/C][C]0.095442[/C][C]0.7206[/C][C]0.237059[/C][/ROW]
[ROW][C]8[/C][C]0.072339[/C][C]0.5461[/C][C]0.293548[/C][/ROW]
[ROW][C]9[/C][C]-0.111054[/C][C]-0.8384[/C][C]0.202644[/C][/ROW]
[ROW][C]10[/C][C]0.010567[/C][C]0.0798[/C][C]0.468347[/C][/ROW]
[ROW][C]11[/C][C]0.102257[/C][C]0.772[/C][C]0.221644[/C][/ROW]
[ROW][C]12[/C][C]-0.007395[/C][C]-0.0558[/C][C]0.477836[/C][/ROW]
[ROW][C]13[/C][C]-0.084649[/C][C]-0.6391[/C][C]0.262663[/C][/ROW]
[ROW][C]14[/C][C]0.017508[/C][C]0.1322[/C][C]0.447653[/C][/ROW]
[ROW][C]15[/C][C]0.140612[/C][C]1.0616[/C][C]0.146448[/C][/ROW]
[ROW][C]16[/C][C]-0.090587[/C][C]-0.6839[/C][C]0.248399[/C][/ROW]
[ROW][C]17[/C][C]-0.057256[/C][C]-0.4323[/C][C]0.333587[/C][/ROW]
[ROW][C]18[/C][C]-0.045914[/C][C]-0.3466[/C][C]0.365069[/C][/ROW]
[ROW][C]19[/C][C]0.220602[/C][C]1.6655[/C][C]0.050649[/C][/ROW]
[ROW][C]20[/C][C]-0.261165[/C][C]-1.9718[/C][C]0.026749[/C][/ROW]
[ROW][C]21[/C][C]0.177831[/C][C]1.3426[/C][C]0.092363[/C][/ROW]
[ROW][C]22[/C][C]-0.115139[/C][C]-0.8693[/C][C]0.19417[/C][/ROW]
[ROW][C]23[/C][C]0.209399[/C][C]1.5809[/C][C]0.059714[/C][/ROW]
[ROW][C]24[/C][C]-0.213816[/C][C]-1.6143[/C][C]0.055995[/C][/ROW]
[ROW][C]25[/C][C]0.163871[/C][C]1.2372[/C][C]0.110544[/C][/ROW]
[ROW][C]26[/C][C]0.011489[/C][C]0.0867[/C][C]0.465592[/C][/ROW]
[ROW][C]27[/C][C]-0.051541[/C][C]-0.3891[/C][C]0.349315[/C][/ROW]
[ROW][C]28[/C][C]-0.028914[/C][C]-0.2183[/C][C]0.413989[/C][/ROW]
[ROW][C]29[/C][C]-0.032171[/C][C]-0.2429[/C][C]0.404482[/C][/ROW]
[ROW][C]30[/C][C]0.075905[/C][C]0.5731[/C][C]0.284425[/C][/ROW]
[ROW][C]31[/C][C]-0.127474[/C][C]-0.9624[/C][C]0.169954[/C][/ROW]
[ROW][C]32[/C][C]-0.000601[/C][C]-0.0045[/C][C]0.498198[/C][/ROW]
[ROW][C]33[/C][C]0.05331[/C][C]0.4025[/C][C]0.344417[/C][/ROW]
[ROW][C]34[/C][C]-0.01676[/C][C]-0.1265[/C][C]0.449878[/C][/ROW]
[ROW][C]35[/C][C]0.038981[/C][C]0.2943[/C][C]0.384798[/C][/ROW]
[ROW][C]36[/C][C]-0.015813[/C][C]-0.1194[/C][C]0.452694[/C][/ROW]
[ROW][C]37[/C][C]0.047641[/C][C]0.3597[/C][C]0.360206[/C][/ROW]
[ROW][C]38[/C][C]-0.039742[/C][C]-0.3[/C][C]0.382617[/C][/ROW]
[ROW][C]39[/C][C]-0.038989[/C][C]-0.2944[/C][C]0.384776[/C][/ROW]
[ROW][C]40[/C][C]0.087717[/C][C]0.6623[/C][C]0.255239[/C][/ROW]
[ROW][C]41[/C][C]-0.053256[/C][C]-0.4021[/C][C]0.344567[/C][/ROW]
[ROW][C]42[/C][C]0.003497[/C][C]0.0264[/C][C]0.489516[/C][/ROW]
[ROW][C]43[/C][C]-0.037084[/C][C]-0.28[/C][C]0.390254[/C][/ROW]
[ROW][C]44[/C][C]0.074501[/C][C]0.5625[/C][C]0.288001[/C][/ROW]
[ROW][C]45[/C][C]-0.006199[/C][C]-0.0468[/C][C]0.481419[/C][/ROW]
[ROW][C]46[/C][C]-0.04672[/C][C]-0.3527[/C][C]0.362798[/C][/ROW]
[ROW][C]47[/C][C]0.012323[/C][C]0.093[/C][C]0.4631[/C][/ROW]
[ROW][C]48[/C][C]0.04848[/C][C]0.366[/C][C]0.357854[/C][/ROW]
[/TABLE]
Source: https://freestatistics.org/blog/index.php?pk=110536&T=1

Globally Unique Identifier (entire table): ba.freestatistics.org/blog/index.php?pk=110536&T=1

As an alternative you can also use a QR Code:  

The GUIDs for individual cells are displayed in the table below:

Autocorrelation Function
Time lag kACF(k)T-STATP-value
1-0.333234-2.51590.007358
20.154021.16280.124873
3-0.16519-1.24720.10872
40.059650.45040.327083
5-0.133428-1.00740.15901
6-0.222404-1.67910.049302
70.0954420.72060.237059
80.0723390.54610.293548
9-0.111054-0.83840.202644
100.0105670.07980.468347
110.1022570.7720.221644
12-0.007395-0.05580.477836
13-0.084649-0.63910.262663
140.0175080.13220.447653
150.1406121.06160.146448
16-0.090587-0.68390.248399
17-0.057256-0.43230.333587
18-0.045914-0.34660.365069
190.2206021.66550.050649
20-0.261165-1.97180.026749
210.1778311.34260.092363
22-0.115139-0.86930.19417
230.2093991.58090.059714
24-0.213816-1.61430.055995
250.1638711.23720.110544
260.0114890.08670.465592
27-0.051541-0.38910.349315
28-0.028914-0.21830.413989
29-0.032171-0.24290.404482
300.0759050.57310.284425
31-0.127474-0.96240.169954
32-0.000601-0.00450.498198
330.053310.40250.344417
34-0.01676-0.12650.449878
350.0389810.29430.384798
36-0.015813-0.11940.452694
370.0476410.35970.360206
38-0.039742-0.30.382617
39-0.038989-0.29440.384776
400.0877170.66230.255239
41-0.053256-0.40210.344567
420.0034970.02640.489516
43-0.037084-0.280.390254
440.0745010.56250.288001
45-0.006199-0.04680.481419
46-0.04672-0.35270.362798
470.0123230.0930.4631
480.048480.3660.357854


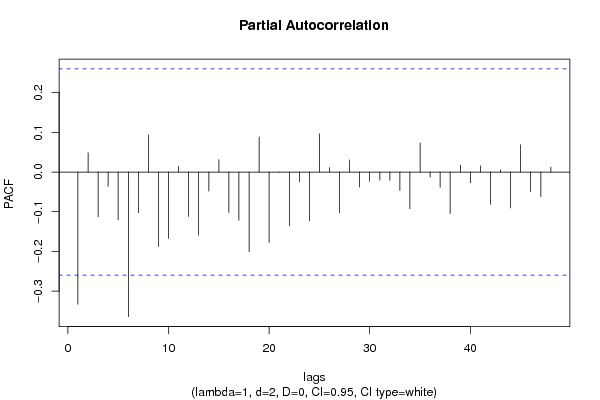
Partial Autocorrelation Function
Time lag kPACF(k)T-STATP-value
1-0.333234-2.51590.007358
20.0483430.3650.358238
3-0.113023-0.85330.198532
4-0.035887-0.27090.393706
5-0.120405-0.9090.183578
6-0.364363-2.75090.003976
7-0.102515-0.7740.221074
80.0932890.70430.242053
9-0.18735-1.41450.081333
10-0.167435-1.26410.105669
110.0140760.10630.457869
12-0.112279-0.84770.20008
13-0.15928-1.20250.117063
14-0.048027-0.36260.359124
150.0310310.23430.407804
16-0.101991-0.770.222236
17-0.121214-0.91510.181986
18-0.201057-1.5180.067277
190.0882240.66610.254025
20-0.177531-1.34030.092729
21-4.3e-05-3e-040.499871
22-0.135422-1.02240.155453
23-0.024653-0.18610.426502
24-0.123276-0.93070.177964
250.0961330.72580.235469
260.0110930.08380.466773
27-0.102895-0.77680.220232
280.0305570.23070.409186
29-0.037792-0.28530.388217
30-0.023548-0.17780.42976
31-0.020389-0.15390.439102
32-0.020924-0.1580.43752
33-0.046584-0.35170.36318
34-0.092263-0.69660.244452
350.0731120.5520.291558
36-0.012772-0.09640.461759
37-0.038521-0.29080.386118
38-0.104222-0.78690.217312
390.0168740.12740.449536
40-0.026933-0.20330.419798
410.0154520.11670.453769
42-0.081352-0.61420.270767
430.00570.0430.482912
44-0.090372-0.68230.248907
450.0686280.51810.303186
46-0.049835-0.37620.354067
47-0.061949-0.46770.32089
480.0125450.09470.462437

\begin{tabular}{lllllllll}
\hline
Partial Autocorrelation Function \tabularnewline
Time lag k & PACF(k) & T-STAT & P-value \tabularnewline
1 & -0.333234 & -2.5159 & 0.007358 \tabularnewline
2 & 0.048343 & 0.365 & 0.358238 \tabularnewline
3 & -0.113023 & -0.8533 & 0.198532 \tabularnewline
4 & -0.035887 & -0.2709 & 0.393706 \tabularnewline
5 & -0.120405 & -0.909 & 0.183578 \tabularnewline
6 & -0.364363 & -2.7509 & 0.003976 \tabularnewline
7 & -0.102515 & -0.774 & 0.221074 \tabularnewline
8 & 0.093289 & 0.7043 & 0.242053 \tabularnewline
9 & -0.18735 & -1.4145 & 0.081333 \tabularnewline
10 & -0.167435 & -1.2641 & 0.105669 \tabularnewline
11 & 0.014076 & 0.1063 & 0.457869 \tabularnewline
12 & -0.112279 & -0.8477 & 0.20008 \tabularnewline
13 & -0.15928 & -1.2025 & 0.117063 \tabularnewline
14 & -0.048027 & -0.3626 & 0.359124 \tabularnewline
15 & 0.031031 & 0.2343 & 0.407804 \tabularnewline
16 & -0.101991 & -0.77 & 0.222236 \tabularnewline
17 & -0.121214 & -0.9151 & 0.181986 \tabularnewline
18 & -0.201057 & -1.518 & 0.067277 \tabularnewline
19 & 0.088224 & 0.6661 & 0.254025 \tabularnewline
20 & -0.177531 & -1.3403 & 0.092729 \tabularnewline
21 & -4.3e-05 & -3e-04 & 0.499871 \tabularnewline
22 & -0.135422 & -1.0224 & 0.155453 \tabularnewline
23 & -0.024653 & -0.1861 & 0.426502 \tabularnewline
24 & -0.123276 & -0.9307 & 0.177964 \tabularnewline
25 & 0.096133 & 0.7258 & 0.235469 \tabularnewline
26 & 0.011093 & 0.0838 & 0.466773 \tabularnewline
27 & -0.102895 & -0.7768 & 0.220232 \tabularnewline
28 & 0.030557 & 0.2307 & 0.409186 \tabularnewline
29 & -0.037792 & -0.2853 & 0.388217 \tabularnewline
30 & -0.023548 & -0.1778 & 0.42976 \tabularnewline
31 & -0.020389 & -0.1539 & 0.439102 \tabularnewline
32 & -0.020924 & -0.158 & 0.43752 \tabularnewline
33 & -0.046584 & -0.3517 & 0.36318 \tabularnewline
34 & -0.092263 & -0.6966 & 0.244452 \tabularnewline
35 & 0.073112 & 0.552 & 0.291558 \tabularnewline
36 & -0.012772 & -0.0964 & 0.461759 \tabularnewline
37 & -0.038521 & -0.2908 & 0.386118 \tabularnewline
38 & -0.104222 & -0.7869 & 0.217312 \tabularnewline
39 & 0.016874 & 0.1274 & 0.449536 \tabularnewline
40 & -0.026933 & -0.2033 & 0.419798 \tabularnewline
41 & 0.015452 & 0.1167 & 0.453769 \tabularnewline
42 & -0.081352 & -0.6142 & 0.270767 \tabularnewline
43 & 0.0057 & 0.043 & 0.482912 \tabularnewline
44 & -0.090372 & -0.6823 & 0.248907 \tabularnewline
45 & 0.068628 & 0.5181 & 0.303186 \tabularnewline
46 & -0.049835 & -0.3762 & 0.354067 \tabularnewline
47 & -0.061949 & -0.4677 & 0.32089 \tabularnewline
48 & 0.012545 & 0.0947 & 0.462437 \tabularnewline
\hline
\end{tabular}
%Source: https://freestatistics.org/blog/index.php?pk=110536&T=2

[TABLE]
[ROW][C]Partial Autocorrelation Function[/C][/ROW]
[ROW][C]Time lag k[/C][C]PACF(k)[/C][C]T-STAT[/C][C]P-value[/C][/ROW]
[ROW][C]1[/C][C]-0.333234[/C][C]-2.5159[/C][C]0.007358[/C][/ROW]
[ROW][C]2[/C][C]0.048343[/C][C]0.365[/C][C]0.358238[/C][/ROW]
[ROW][C]3[/C][C]-0.113023[/C][C]-0.8533[/C][C]0.198532[/C][/ROW]
[ROW][C]4[/C][C]-0.035887[/C][C]-0.2709[/C][C]0.393706[/C][/ROW]
[ROW][C]5[/C][C]-0.120405[/C][C]-0.909[/C][C]0.183578[/C][/ROW]
[ROW][C]6[/C][C]-0.364363[/C][C]-2.7509[/C][C]0.003976[/C][/ROW]
[ROW][C]7[/C][C]-0.102515[/C][C]-0.774[/C][C]0.221074[/C][/ROW]
[ROW][C]8[/C][C]0.093289[/C][C]0.7043[/C][C]0.242053[/C][/ROW]
[ROW][C]9[/C][C]-0.18735[/C][C]-1.4145[/C][C]0.081333[/C][/ROW]
[ROW][C]10[/C][C]-0.167435[/C][C]-1.2641[/C][C]0.105669[/C][/ROW]
[ROW][C]11[/C][C]0.014076[/C][C]0.1063[/C][C]0.457869[/C][/ROW]
[ROW][C]12[/C][C]-0.112279[/C][C]-0.8477[/C][C]0.20008[/C][/ROW]
[ROW][C]13[/C][C]-0.15928[/C][C]-1.2025[/C][C]0.117063[/C][/ROW]
[ROW][C]14[/C][C]-0.048027[/C][C]-0.3626[/C][C]0.359124[/C][/ROW]
[ROW][C]15[/C][C]0.031031[/C][C]0.2343[/C][C]0.407804[/C][/ROW]
[ROW][C]16[/C][C]-0.101991[/C][C]-0.77[/C][C]0.222236[/C][/ROW]
[ROW][C]17[/C][C]-0.121214[/C][C]-0.9151[/C][C]0.181986[/C][/ROW]
[ROW][C]18[/C][C]-0.201057[/C][C]-1.518[/C][C]0.067277[/C][/ROW]
[ROW][C]19[/C][C]0.088224[/C][C]0.6661[/C][C]0.254025[/C][/ROW]
[ROW][C]20[/C][C]-0.177531[/C][C]-1.3403[/C][C]0.092729[/C][/ROW]
[ROW][C]21[/C][C]-4.3e-05[/C][C]-3e-04[/C][C]0.499871[/C][/ROW]
[ROW][C]22[/C][C]-0.135422[/C][C]-1.0224[/C][C]0.155453[/C][/ROW]
[ROW][C]23[/C][C]-0.024653[/C][C]-0.1861[/C][C]0.426502[/C][/ROW]
[ROW][C]24[/C][C]-0.123276[/C][C]-0.9307[/C][C]0.177964[/C][/ROW]
[ROW][C]25[/C][C]0.096133[/C][C]0.7258[/C][C]0.235469[/C][/ROW]
[ROW][C]26[/C][C]0.011093[/C][C]0.0838[/C][C]0.466773[/C][/ROW]
[ROW][C]27[/C][C]-0.102895[/C][C]-0.7768[/C][C]0.220232[/C][/ROW]
[ROW][C]28[/C][C]0.030557[/C][C]0.2307[/C][C]0.409186[/C][/ROW]
[ROW][C]29[/C][C]-0.037792[/C][C]-0.2853[/C][C]0.388217[/C][/ROW]
[ROW][C]30[/C][C]-0.023548[/C][C]-0.1778[/C][C]0.42976[/C][/ROW]
[ROW][C]31[/C][C]-0.020389[/C][C]-0.1539[/C][C]0.439102[/C][/ROW]
[ROW][C]32[/C][C]-0.020924[/C][C]-0.158[/C][C]0.43752[/C][/ROW]
[ROW][C]33[/C][C]-0.046584[/C][C]-0.3517[/C][C]0.36318[/C][/ROW]
[ROW][C]34[/C][C]-0.092263[/C][C]-0.6966[/C][C]0.244452[/C][/ROW]
[ROW][C]35[/C][C]0.073112[/C][C]0.552[/C][C]0.291558[/C][/ROW]
[ROW][C]36[/C][C]-0.012772[/C][C]-0.0964[/C][C]0.461759[/C][/ROW]
[ROW][C]37[/C][C]-0.038521[/C][C]-0.2908[/C][C]0.386118[/C][/ROW]
[ROW][C]38[/C][C]-0.104222[/C][C]-0.7869[/C][C]0.217312[/C][/ROW]
[ROW][C]39[/C][C]0.016874[/C][C]0.1274[/C][C]0.449536[/C][/ROW]
[ROW][C]40[/C][C]-0.026933[/C][C]-0.2033[/C][C]0.419798[/C][/ROW]
[ROW][C]41[/C][C]0.015452[/C][C]0.1167[/C][C]0.453769[/C][/ROW]
[ROW][C]42[/C][C]-0.081352[/C][C]-0.6142[/C][C]0.270767[/C][/ROW]
[ROW][C]43[/C][C]0.0057[/C][C]0.043[/C][C]0.482912[/C][/ROW]
[ROW][C]44[/C][C]-0.090372[/C][C]-0.6823[/C][C]0.248907[/C][/ROW]
[ROW][C]45[/C][C]0.068628[/C][C]0.5181[/C][C]0.303186[/C][/ROW]
[ROW][C]46[/C][C]-0.049835[/C][C]-0.3762[/C][C]0.354067[/C][/ROW]
[ROW][C]47[/C][C]-0.061949[/C][C]-0.4677[/C][C]0.32089[/C][/ROW]
[ROW][C]48[/C][C]0.012545[/C][C]0.0947[/C][C]0.462437[/C][/ROW]
[/TABLE]
Source: https://freestatistics.org/blog/index.php?pk=110536&T=2

Globally Unique Identifier (entire table): ba.freestatistics.org/blog/index.php?pk=110536&T=2

As an alternative you can also use a QR Code:  

The GUIDs for individual cells are displayed in the table below:

Partial Autocorrelation Function
Time lag kPACF(k)T-STATP-value
1-0.333234-2.51590.007358
20.0483430.3650.358238
3-0.113023-0.85330.198532
4-0.035887-0.27090.393706
5-0.120405-0.9090.183578
6-0.364363-2.75090.003976
7-0.102515-0.7740.221074
80.0932890.70430.242053
9-0.18735-1.41450.081333
10-0.167435-1.26410.105669
110.0140760.10630.457869
12-0.112279-0.84770.20008
13-0.15928-1.20250.117063
14-0.048027-0.36260.359124
150.0310310.23430.407804
16-0.101991-0.770.222236
17-0.121214-0.91510.181986
18-0.201057-1.5180.067277
190.0882240.66610.254025
20-0.177531-1.34030.092729
21-4.3e-05-3e-040.499871
22-0.135422-1.02240.155453
23-0.024653-0.18610.426502
24-0.123276-0.93070.177964
250.0961330.72580.235469
260.0110930.08380.466773
27-0.102895-0.77680.220232
280.0305570.23070.409186
29-0.037792-0.28530.388217
30-0.023548-0.17780.42976
31-0.020389-0.15390.439102
32-0.020924-0.1580.43752
33-0.046584-0.35170.36318
34-0.092263-0.69660.244452
350.0731120.5520.291558
36-0.012772-0.09640.461759
37-0.038521-0.29080.386118
38-0.104222-0.78690.217312
390.0168740.12740.449536
40-0.026933-0.20330.419798
410.0154520.11670.453769
42-0.081352-0.61420.270767
430.00570.0430.482912
44-0.090372-0.68230.248907
450.0686280.51810.303186
46-0.049835-0.37620.354067
47-0.061949-0.46770.32089
480.0125450.09470.462437


Parameters (Session):
par1 = 48 ; par2 = 1 ; par3 = 2 ; par4 = 0 ; par5 = 12 ; par6 = White Noise ; par7 = 0.95 ;
Parameters (R input):
par1 = 48 ; par2 = 1 ; par3 = 2 ; par4 = 0 ; par5 = 12 ; par6 = White Noise ; par7 = 0.95 ; par8 = ;
R code (references can be found in the software module):
if (par1 == 'Default') {
par1 = 10*log10(length(x))
} else {
par1 <- as.numeric(par1)
}
par2 <- as.numeric(par2)
par3 <- as.numeric(par3)
par4 <- as.numeric(par4)
par5 <- as.numeric(par5)
if (par6 == 'White Noise') par6 <- 'white' else par6 <- 'ma'
par7 <- as.numeric(par7)
if (par8 != '') par8 <- as.numeric(par8)
ox <- x
if (par8 == '') {
if (par2 == 0) {
x <- log(x)
} else {
x <- (x ^ par2 - 1) / par2
}
} else {
x <- log(x,base=par8)
}
if (par3 > 0) x <- diff(x,lag=1,difference=par3)
if (par4 > 0) x <- diff(x,lag=par5,difference=par4)
bitmap(file='picts.png')
op <- par(mfrow=c(2,1))
plot(ox,type='l',main='Original Time Series',xlab='time',ylab='value')
if (par8=='') {
mytitle <- paste('Working Time Series (lambda=',par2,', d=',par3,', D=',par4,')',sep='')
mysub <- paste('(lambda=',par2,', d=',par3,', D=',par4,', CI=', par7, ', CI type=',par6,')',sep='')
} else {
mytitle <- paste('Working Time Series (base=',par8,', d=',par3,', D=',par4,')',sep='')
mysub <- paste('(base=',par8,', d=',par3,', D=',par4,', CI=', par7, ', CI type=',par6,')',sep='')
}
plot(x,type='l', main=mytitle,xlab='time',ylab='value')
par(op)
dev.off()
bitmap(file='pic1.png')
racf <- acf(x, par1, main='Autocorrelation', xlab='time lag', ylab='ACF', ci.type=par6, ci=par7, sub=mysub)
dev.off()
bitmap(file='pic2.png')
rpacf <- pacf(x,par1,main='Partial Autocorrelation',xlab='lags',ylab='PACF',sub=mysub)
dev.off()
(myacf <- c(racf$acf))
(mypacf <- c(rpacf$acf))
lengthx <- length(x)
sqrtn <- sqrt(lengthx)
load(file='createtable')
a<-table.start()
a<-table.row.start(a)
a<-table.element(a,'Autocorrelation Function',4,TRUE)
a<-table.row.end(a)
a<-table.row.start(a)
a<-table.element(a,'Time lag k',header=TRUE)
a<-table.element(a,hyperlink('basics.htm','ACF(k)','click here for more information about the Autocorrelation Function'),header=TRUE)
a<-table.element(a,'T-STAT',header=TRUE)
a<-table.element(a,'P-value',header=TRUE)
a<-table.row.end(a)
for (i in 2:(par1+1)) {
a<-table.row.start(a)
a<-table.element(a,i-1,header=TRUE)
a<-table.element(a,round(myacf[i],6))
mytstat <- myacf[i]*sqrtn
a<-table.element(a,round(mytstat,4))
a<-table.element(a,round(1-pt(abs(mytstat),lengthx),6))
a<-table.row.end(a)
}
a<-table.end(a)
table.save(a,file='mytable.tab')
a<-table.start()
a<-table.row.start(a)
a<-table.element(a,'Partial Autocorrelation Function',4,TRUE)
a<-table.row.end(a)
a<-table.row.start(a)
a<-table.element(a,'Time lag k',header=TRUE)
a<-table.element(a,hyperlink('basics.htm','PACF(k)','click here for more information about the Partial Autocorrelation Function'),header=TRUE)
a<-table.element(a,'T-STAT',header=TRUE)
a<-table.element(a,'P-value',header=TRUE)
a<-table.row.end(a)
for (i in 1:par1) {
a<-table.row.start(a)
a<-table.element(a,i,header=TRUE)
a<-table.element(a,round(mypacf[i],6))
mytstat <- mypacf[i]*sqrtn
a<-table.element(a,round(mytstat,4))
a<-table.element(a,round(1-pt(abs(mytstat),lengthx),6))
a<-table.row.end(a)
}
a<-table.end(a)
table.save(a,file='mytable1.tab')