Free Statistics
of Irreproducible Research!
Description of Statistical Computation | |||||||||||||||||||||||||||||||||||||||||
|---|---|---|---|---|---|---|---|---|---|---|---|---|---|---|---|---|---|---|---|---|---|---|---|---|---|---|---|---|---|---|---|---|---|---|---|---|---|---|---|---|---|
| Author's title | |||||||||||||||||||||||||||||||||||||||||
| Author | *The author of this computation has been verified* | ||||||||||||||||||||||||||||||||||||||||
| R Software Module | rwasp_univariatedataseries.wasp | ||||||||||||||||||||||||||||||||||||||||
| Title produced by software | Univariate Data Series | ||||||||||||||||||||||||||||||||||||||||
| Date of computation | Wed, 15 Dec 2010 15:55:43 +0000 | ||||||||||||||||||||||||||||||||||||||||
| Cite this page as follows | Statistical Computations at FreeStatistics.org, Office for Research Development and Education, URL https://freestatistics.org/blog/index.php?v=date/2010/Dec/15/t12924284351lkyb3q9rxr4i62.htm/, Retrieved Fri, 03 May 2024 10:18:43 +0000 | ||||||||||||||||||||||||||||||||||||||||
| Statistical Computations at FreeStatistics.org, Office for Research Development and Education, URL https://freestatistics.org/blog/index.php?pk=110501, Retrieved Fri, 03 May 2024 10:18:43 +0000 | |||||||||||||||||||||||||||||||||||||||||
| QR Codes: | |||||||||||||||||||||||||||||||||||||||||
|
| |||||||||||||||||||||||||||||||||||||||||
| Original text written by user: | |||||||||||||||||||||||||||||||||||||||||
| IsPrivate? | No (this computation is public) | ||||||||||||||||||||||||||||||||||||||||
| User-defined keywords | |||||||||||||||||||||||||||||||||||||||||
| Estimated Impact | 114 | ||||||||||||||||||||||||||||||||||||||||
Tree of Dependent Computations | |||||||||||||||||||||||||||||||||||||||||
| Family? (F = Feedback message, R = changed R code, M = changed R Module, P = changed Parameters, D = changed Data) | |||||||||||||||||||||||||||||||||||||||||
| - [Univariate Data Series] [beschrijving] [2009-12-11 09:25:25] [517ac0676608e46c618c738721d88e41] - R PD [Univariate Data Series] [] [2010-12-10 14:31:22] [22937c5b58c14f6c22964f32d64ff823] - P [Univariate Data Series] [] [2010-12-10 14:35:53] [22937c5b58c14f6c22964f32d64ff823] - P [Univariate Data Series] [] [2010-12-10 14:41:14] [22937c5b58c14f6c22964f32d64ff823] - R PD [Univariate Data Series] [Paper Data Serie ...] [2010-12-15 14:34:53] [945bcebba5e7ac34a41d6888338a1ba9] - PD [Univariate Data Series] [Paper Data Serie ...] [2010-12-15 15:55:43] [514029464b0621595fe21c9fa38c7009] [Current] | |||||||||||||||||||||||||||||||||||||||||
| Feedback Forum | |||||||||||||||||||||||||||||||||||||||||
Post a new message | |||||||||||||||||||||||||||||||||||||||||
Dataset | |||||||||||||||||||||||||||||||||||||||||
| Dataseries X: | |||||||||||||||||||||||||||||||||||||||||
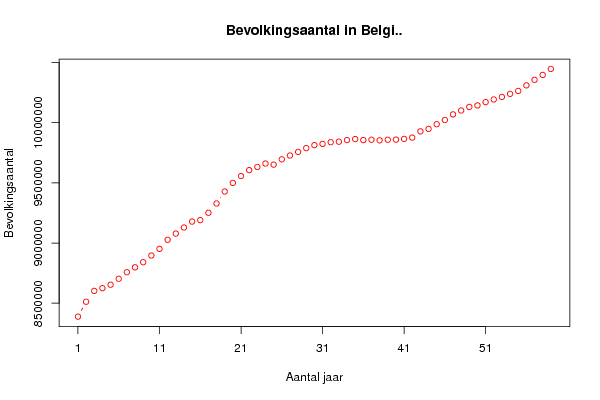
8388526 8512195 8602611 8625084 8653653 8703119 8757691 8798055 8840704 8896246 8951443 9026778 9078635 9128824 9178154 9189741 9251414 9328126 9428100 9499234 9556380 9605601 9631910 9660154 9650944 9695379 9726850 9756590 9788248 9813152 9823302 9837413 9841654 9855110 9863374 9854589 9858017 9853023 9857721 9858895 9864751 9875716 9927612 9947782 9986975 10021997 10068319 10100631 10130574 10143047 10170226 10192264 10213752 10239085 10263414 10309725 10355844 10396421 10445852 | |||||||||||||||||||||||||||||||||||||||||
Tables (Output of Computation) | |||||||||||||||||||||||||||||||||||||||||
| |||||||||||||||||||||||||||||||||||||||||
Figures (Output of Computation) | |||||||||||||||||||||||||||||||||||||||||
Input Parameters & R Code | |||||||||||||||||||||||||||||||||||||||||
| Parameters (Session): | |||||||||||||||||||||||||||||||||||||||||
| par1 = Bevolkingsaantal in België ; par2 = Algemene Directie Statistiek en Economische Informatie van de FOD Economie, K.M.O., Middenstand en Energie ; par4 = No season ; | |||||||||||||||||||||||||||||||||||||||||
| Parameters (R input): | |||||||||||||||||||||||||||||||||||||||||
| par1 = Bevolkingsaantal in België ; par2 = Algemene Directie Statistiek en Economische Informatie van de FOD Economie, K.M.O., Middenstand en Energie ; par3 = ; par4 = No season ; | |||||||||||||||||||||||||||||||||||||||||
| R code (references can be found in the software module): | |||||||||||||||||||||||||||||||||||||||||
if (par4 != 'No season') { | |||||||||||||||||||||||||||||||||||||||||