Free Statistics

of Irreproducible Research!

Author's title

Author*The author of this computation has been verified*
R Software Modulerwasp_autocorrelation.wasp
Title produced by software(Partial) Autocorrelation Function
Date of computationWed, 15 Dec 2010 15:03:36 +0000
Cite this page as followsStatistical Computations at FreeStatistics.org, Office for Research Development and Education, URL https://freestatistics.org/blog/index.php?v=date/2010/Dec/15/t1292427072cdr7af0nlu36ynx.htm/, Retrieved Fri, 03 May 2024 14:42:25 +0000
Statistical Computations at FreeStatistics.org, Office for Research Development and Education, URL https://freestatistics.org/blog/index.php?pk=110477, Retrieved Fri, 03 May 2024 14:42:25 +0000
QR Codes:

Original text written by user:
IsPrivate?No (this computation is public)
User-defined keywords
Estimated Impact126
Family? (F = Feedback message, R = changed R code, M = changed R Module, P = changed Parameters, D = changed Data)
-       [(Partial) Autocorrelation Function] [] [2010-12-15 15:03:36] [8668fee09b9e9c55b617e4f337cee061] [Current]
-         [(Partial) Autocorrelation Function] [partial autocorre...] [2010-12-19 15:22:22] [ca50229b6b451ac8f5a30a9e3154d674]
Feedback Forum

Post a new message
Dataseries X:
10570
10297
10635
10872
10296
10383
10431
10574
10653
10805
10872
10625
10407
10463
10556
10646
10702
11353
11346
11451
11964
12574
13031
13812
14544
14931
14886
16005
17064
15168
16050
15839
15137
14954
15648
15305
15579
16348
15928
16171
15937
15713
15594
15683
16438
17032
17696
17745
19394
20148
20108
18584
18441
18391
19178
18079
18483
19644
19195
19650
20830
23595
22937
21814
21928
21777
21383
21467
22052
22680
24320
24977
25204


Summary of computational transaction
Raw Inputview raw input (R code)
Raw Outputview raw output of R engine
Computing time3 seconds
R Server'George Udny Yule' @ 72.249.76.132

\begin{tabular}{lllllllll}
\hline
Summary of computational transaction \tabularnewline
Raw Input & view raw input (R code)  \tabularnewline
Raw Output & view raw output of R engine  \tabularnewline
Computing time & 3 seconds \tabularnewline
R Server & 'George Udny Yule' @ 72.249.76.132 \tabularnewline
\hline
\end{tabular}
%Source: https://freestatistics.org/blog/index.php?pk=110477&T=0

[TABLE]
[ROW][C]Summary of computational transaction[/C][/ROW]
[ROW][C]Raw Input[/C][C]view raw input (R code) [/C][/ROW]
[ROW][C]Raw Output[/C][C]view raw output of R engine [/C][/ROW]
[ROW][C]Computing time[/C][C]3 seconds[/C][/ROW]
[ROW][C]R Server[/C][C]'George Udny Yule' @ 72.249.76.132[/C][/ROW]
[/TABLE]
Source: https://freestatistics.org/blog/index.php?pk=110477&T=0

Globally Unique Identifier (entire table): ba.freestatistics.org/blog/index.php?pk=110477&T=0

As an alternative you can also use a QR Code:  

The GUIDs for individual cells are displayed in the table below:

Summary of computational transaction
Raw Inputview raw input (R code)
Raw Outputview raw output of R engine
Computing time3 seconds
R Server'George Udny Yule' @ 72.249.76.132


Autocorrelation Function
Time lag kACF(k)T-STATP-value
10.0518560.440.330624
2-0.135933-1.15340.126274
30.0516630.43840.331214
40.0871210.73920.23108
5-0.225065-1.90970.030075
6-0.233492-1.98120.025692
7-0.025023-0.21230.416225
8-0.081988-0.69570.24443
90.0566410.48060.316124
10-0.065456-0.55540.290166
110.135021.14570.127859
120.1093420.92780.178306
130.1227321.04140.150583
14-0.048889-0.41480.339749
15-0.082075-0.69640.2442
16-0.046621-0.39560.346787
17-0.072058-0.61140.271419
18-0.07553-0.64090.261812
19-0.211239-1.79240.038633
200.0313020.26560.39565
210.029710.25210.400841
220.1786881.51620.066921
230.0264130.22410.411647
240.0826990.70170.242557
250.0501420.42550.335881
260.0647460.54940.292219
270.0256020.21720.414317
28-0.128363-1.08920.13985
29-0.047466-0.40280.344157
30-0.049879-0.42320.336692
310.0281650.2390.405898
32-0.144379-1.22510.112265
330.1190861.01050.157826
340.1347671.14350.128302
35-0.094883-0.80510.211704
360.0047890.04060.48385
370.0748140.63480.263779
38-0.052366-0.44430.329064
39-0.035482-0.30110.382112
400.0425930.36140.359425
41-0.074108-0.62880.265726
42-0.03993-0.33880.367866
430.0228620.1940.423365
440.0138670.11770.45333
45-0.025794-0.21890.413686
460.0187420.1590.437045
470.0640760.54370.294162
480.0061250.0520.479347
49-0.015685-0.13310.447245
500.0089630.07610.469792
510.0508970.43190.33356
520.0114380.09710.461477
53-0.016567-0.14060.444299
540.0390980.33180.370518
55-0.012297-0.10430.458592
56-0.047359-0.40190.34449
57-0.052469-0.44520.328751
580.0034690.02940.4883
590.0023390.01980.492112
60-0.047253-0.4010.34482

\begin{tabular}{lllllllll}
\hline
Autocorrelation Function \tabularnewline
Time lag k & ACF(k) & T-STAT & P-value \tabularnewline
1 & 0.051856 & 0.44 & 0.330624 \tabularnewline
2 & -0.135933 & -1.1534 & 0.126274 \tabularnewline
3 & 0.051663 & 0.4384 & 0.331214 \tabularnewline
4 & 0.087121 & 0.7392 & 0.23108 \tabularnewline
5 & -0.225065 & -1.9097 & 0.030075 \tabularnewline
6 & -0.233492 & -1.9812 & 0.025692 \tabularnewline
7 & -0.025023 & -0.2123 & 0.416225 \tabularnewline
8 & -0.081988 & -0.6957 & 0.24443 \tabularnewline
9 & 0.056641 & 0.4806 & 0.316124 \tabularnewline
10 & -0.065456 & -0.5554 & 0.290166 \tabularnewline
11 & 0.13502 & 1.1457 & 0.127859 \tabularnewline
12 & 0.109342 & 0.9278 & 0.178306 \tabularnewline
13 & 0.122732 & 1.0414 & 0.150583 \tabularnewline
14 & -0.048889 & -0.4148 & 0.339749 \tabularnewline
15 & -0.082075 & -0.6964 & 0.2442 \tabularnewline
16 & -0.046621 & -0.3956 & 0.346787 \tabularnewline
17 & -0.072058 & -0.6114 & 0.271419 \tabularnewline
18 & -0.07553 & -0.6409 & 0.261812 \tabularnewline
19 & -0.211239 & -1.7924 & 0.038633 \tabularnewline
20 & 0.031302 & 0.2656 & 0.39565 \tabularnewline
21 & 0.02971 & 0.2521 & 0.400841 \tabularnewline
22 & 0.178688 & 1.5162 & 0.066921 \tabularnewline
23 & 0.026413 & 0.2241 & 0.411647 \tabularnewline
24 & 0.082699 & 0.7017 & 0.242557 \tabularnewline
25 & 0.050142 & 0.4255 & 0.335881 \tabularnewline
26 & 0.064746 & 0.5494 & 0.292219 \tabularnewline
27 & 0.025602 & 0.2172 & 0.414317 \tabularnewline
28 & -0.128363 & -1.0892 & 0.13985 \tabularnewline
29 & -0.047466 & -0.4028 & 0.344157 \tabularnewline
30 & -0.049879 & -0.4232 & 0.336692 \tabularnewline
31 & 0.028165 & 0.239 & 0.405898 \tabularnewline
32 & -0.144379 & -1.2251 & 0.112265 \tabularnewline
33 & 0.119086 & 1.0105 & 0.157826 \tabularnewline
34 & 0.134767 & 1.1435 & 0.128302 \tabularnewline
35 & -0.094883 & -0.8051 & 0.211704 \tabularnewline
36 & 0.004789 & 0.0406 & 0.48385 \tabularnewline
37 & 0.074814 & 0.6348 & 0.263779 \tabularnewline
38 & -0.052366 & -0.4443 & 0.329064 \tabularnewline
39 & -0.035482 & -0.3011 & 0.382112 \tabularnewline
40 & 0.042593 & 0.3614 & 0.359425 \tabularnewline
41 & -0.074108 & -0.6288 & 0.265726 \tabularnewline
42 & -0.03993 & -0.3388 & 0.367866 \tabularnewline
43 & 0.022862 & 0.194 & 0.423365 \tabularnewline
44 & 0.013867 & 0.1177 & 0.45333 \tabularnewline
45 & -0.025794 & -0.2189 & 0.413686 \tabularnewline
46 & 0.018742 & 0.159 & 0.437045 \tabularnewline
47 & 0.064076 & 0.5437 & 0.294162 \tabularnewline
48 & 0.006125 & 0.052 & 0.479347 \tabularnewline
49 & -0.015685 & -0.1331 & 0.447245 \tabularnewline
50 & 0.008963 & 0.0761 & 0.469792 \tabularnewline
51 & 0.050897 & 0.4319 & 0.33356 \tabularnewline
52 & 0.011438 & 0.0971 & 0.461477 \tabularnewline
53 & -0.016567 & -0.1406 & 0.444299 \tabularnewline
54 & 0.039098 & 0.3318 & 0.370518 \tabularnewline
55 & -0.012297 & -0.1043 & 0.458592 \tabularnewline
56 & -0.047359 & -0.4019 & 0.34449 \tabularnewline
57 & -0.052469 & -0.4452 & 0.328751 \tabularnewline
58 & 0.003469 & 0.0294 & 0.4883 \tabularnewline
59 & 0.002339 & 0.0198 & 0.492112 \tabularnewline
60 & -0.047253 & -0.401 & 0.34482 \tabularnewline
\hline
\end{tabular}
%Source: https://freestatistics.org/blog/index.php?pk=110477&T=1

[TABLE]
[ROW][C]Autocorrelation Function[/C][/ROW]
[ROW][C]Time lag k[/C][C]ACF(k)[/C][C]T-STAT[/C][C]P-value[/C][/ROW]
[ROW][C]1[/C][C]0.051856[/C][C]0.44[/C][C]0.330624[/C][/ROW]
[ROW][C]2[/C][C]-0.135933[/C][C]-1.1534[/C][C]0.126274[/C][/ROW]
[ROW][C]3[/C][C]0.051663[/C][C]0.4384[/C][C]0.331214[/C][/ROW]
[ROW][C]4[/C][C]0.087121[/C][C]0.7392[/C][C]0.23108[/C][/ROW]
[ROW][C]5[/C][C]-0.225065[/C][C]-1.9097[/C][C]0.030075[/C][/ROW]
[ROW][C]6[/C][C]-0.233492[/C][C]-1.9812[/C][C]0.025692[/C][/ROW]
[ROW][C]7[/C][C]-0.025023[/C][C]-0.2123[/C][C]0.416225[/C][/ROW]
[ROW][C]8[/C][C]-0.081988[/C][C]-0.6957[/C][C]0.24443[/C][/ROW]
[ROW][C]9[/C][C]0.056641[/C][C]0.4806[/C][C]0.316124[/C][/ROW]
[ROW][C]10[/C][C]-0.065456[/C][C]-0.5554[/C][C]0.290166[/C][/ROW]
[ROW][C]11[/C][C]0.13502[/C][C]1.1457[/C][C]0.127859[/C][/ROW]
[ROW][C]12[/C][C]0.109342[/C][C]0.9278[/C][C]0.178306[/C][/ROW]
[ROW][C]13[/C][C]0.122732[/C][C]1.0414[/C][C]0.150583[/C][/ROW]
[ROW][C]14[/C][C]-0.048889[/C][C]-0.4148[/C][C]0.339749[/C][/ROW]
[ROW][C]15[/C][C]-0.082075[/C][C]-0.6964[/C][C]0.2442[/C][/ROW]
[ROW][C]16[/C][C]-0.046621[/C][C]-0.3956[/C][C]0.346787[/C][/ROW]
[ROW][C]17[/C][C]-0.072058[/C][C]-0.6114[/C][C]0.271419[/C][/ROW]
[ROW][C]18[/C][C]-0.07553[/C][C]-0.6409[/C][C]0.261812[/C][/ROW]
[ROW][C]19[/C][C]-0.211239[/C][C]-1.7924[/C][C]0.038633[/C][/ROW]
[ROW][C]20[/C][C]0.031302[/C][C]0.2656[/C][C]0.39565[/C][/ROW]
[ROW][C]21[/C][C]0.02971[/C][C]0.2521[/C][C]0.400841[/C][/ROW]
[ROW][C]22[/C][C]0.178688[/C][C]1.5162[/C][C]0.066921[/C][/ROW]
[ROW][C]23[/C][C]0.026413[/C][C]0.2241[/C][C]0.411647[/C][/ROW]
[ROW][C]24[/C][C]0.082699[/C][C]0.7017[/C][C]0.242557[/C][/ROW]
[ROW][C]25[/C][C]0.050142[/C][C]0.4255[/C][C]0.335881[/C][/ROW]
[ROW][C]26[/C][C]0.064746[/C][C]0.5494[/C][C]0.292219[/C][/ROW]
[ROW][C]27[/C][C]0.025602[/C][C]0.2172[/C][C]0.414317[/C][/ROW]
[ROW][C]28[/C][C]-0.128363[/C][C]-1.0892[/C][C]0.13985[/C][/ROW]
[ROW][C]29[/C][C]-0.047466[/C][C]-0.4028[/C][C]0.344157[/C][/ROW]
[ROW][C]30[/C][C]-0.049879[/C][C]-0.4232[/C][C]0.336692[/C][/ROW]
[ROW][C]31[/C][C]0.028165[/C][C]0.239[/C][C]0.405898[/C][/ROW]
[ROW][C]32[/C][C]-0.144379[/C][C]-1.2251[/C][C]0.112265[/C][/ROW]
[ROW][C]33[/C][C]0.119086[/C][C]1.0105[/C][C]0.157826[/C][/ROW]
[ROW][C]34[/C][C]0.134767[/C][C]1.1435[/C][C]0.128302[/C][/ROW]
[ROW][C]35[/C][C]-0.094883[/C][C]-0.8051[/C][C]0.211704[/C][/ROW]
[ROW][C]36[/C][C]0.004789[/C][C]0.0406[/C][C]0.48385[/C][/ROW]
[ROW][C]37[/C][C]0.074814[/C][C]0.6348[/C][C]0.263779[/C][/ROW]
[ROW][C]38[/C][C]-0.052366[/C][C]-0.4443[/C][C]0.329064[/C][/ROW]
[ROW][C]39[/C][C]-0.035482[/C][C]-0.3011[/C][C]0.382112[/C][/ROW]
[ROW][C]40[/C][C]0.042593[/C][C]0.3614[/C][C]0.359425[/C][/ROW]
[ROW][C]41[/C][C]-0.074108[/C][C]-0.6288[/C][C]0.265726[/C][/ROW]
[ROW][C]42[/C][C]-0.03993[/C][C]-0.3388[/C][C]0.367866[/C][/ROW]
[ROW][C]43[/C][C]0.022862[/C][C]0.194[/C][C]0.423365[/C][/ROW]
[ROW][C]44[/C][C]0.013867[/C][C]0.1177[/C][C]0.45333[/C][/ROW]
[ROW][C]45[/C][C]-0.025794[/C][C]-0.2189[/C][C]0.413686[/C][/ROW]
[ROW][C]46[/C][C]0.018742[/C][C]0.159[/C][C]0.437045[/C][/ROW]
[ROW][C]47[/C][C]0.064076[/C][C]0.5437[/C][C]0.294162[/C][/ROW]
[ROW][C]48[/C][C]0.006125[/C][C]0.052[/C][C]0.479347[/C][/ROW]
[ROW][C]49[/C][C]-0.015685[/C][C]-0.1331[/C][C]0.447245[/C][/ROW]
[ROW][C]50[/C][C]0.008963[/C][C]0.0761[/C][C]0.469792[/C][/ROW]
[ROW][C]51[/C][C]0.050897[/C][C]0.4319[/C][C]0.33356[/C][/ROW]
[ROW][C]52[/C][C]0.011438[/C][C]0.0971[/C][C]0.461477[/C][/ROW]
[ROW][C]53[/C][C]-0.016567[/C][C]-0.1406[/C][C]0.444299[/C][/ROW]
[ROW][C]54[/C][C]0.039098[/C][C]0.3318[/C][C]0.370518[/C][/ROW]
[ROW][C]55[/C][C]-0.012297[/C][C]-0.1043[/C][C]0.458592[/C][/ROW]
[ROW][C]56[/C][C]-0.047359[/C][C]-0.4019[/C][C]0.34449[/C][/ROW]
[ROW][C]57[/C][C]-0.052469[/C][C]-0.4452[/C][C]0.328751[/C][/ROW]
[ROW][C]58[/C][C]0.003469[/C][C]0.0294[/C][C]0.4883[/C][/ROW]
[ROW][C]59[/C][C]0.002339[/C][C]0.0198[/C][C]0.492112[/C][/ROW]
[ROW][C]60[/C][C]-0.047253[/C][C]-0.401[/C][C]0.34482[/C][/ROW]
[/TABLE]
Source: https://freestatistics.org/blog/index.php?pk=110477&T=1

Globally Unique Identifier (entire table): ba.freestatistics.org/blog/index.php?pk=110477&T=1

As an alternative you can also use a QR Code:  

The GUIDs for individual cells are displayed in the table below:

Autocorrelation Function
Time lag kACF(k)T-STATP-value
10.0518560.440.330624
2-0.135933-1.15340.126274
30.0516630.43840.331214
40.0871210.73920.23108
5-0.225065-1.90970.030075
6-0.233492-1.98120.025692
7-0.025023-0.21230.416225
8-0.081988-0.69570.24443
90.0566410.48060.316124
10-0.065456-0.55540.290166
110.135021.14570.127859
120.1093420.92780.178306
130.1227321.04140.150583
14-0.048889-0.41480.339749
15-0.082075-0.69640.2442
16-0.046621-0.39560.346787
17-0.072058-0.61140.271419
18-0.07553-0.64090.261812
19-0.211239-1.79240.038633
200.0313020.26560.39565
210.029710.25210.400841
220.1786881.51620.066921
230.0264130.22410.411647
240.0826990.70170.242557
250.0501420.42550.335881
260.0647460.54940.292219
270.0256020.21720.414317
28-0.128363-1.08920.13985
29-0.047466-0.40280.344157
30-0.049879-0.42320.336692
310.0281650.2390.405898
32-0.144379-1.22510.112265
330.1190861.01050.157826
340.1347671.14350.128302
35-0.094883-0.80510.211704
360.0047890.04060.48385
370.0748140.63480.263779
38-0.052366-0.44430.329064
39-0.035482-0.30110.382112
400.0425930.36140.359425
41-0.074108-0.62880.265726
42-0.03993-0.33880.367866
430.0228620.1940.423365
440.0138670.11770.45333
45-0.025794-0.21890.413686
460.0187420.1590.437045
470.0640760.54370.294162
480.0061250.0520.479347
49-0.015685-0.13310.447245
500.0089630.07610.469792
510.0508970.43190.33356
520.0114380.09710.461477
53-0.016567-0.14060.444299
540.0390980.33180.370518
55-0.012297-0.10430.458592
56-0.047359-0.40190.34449
57-0.052469-0.44520.328751
580.0034690.02940.4883
590.0023390.01980.492112
60-0.047253-0.4010.34482


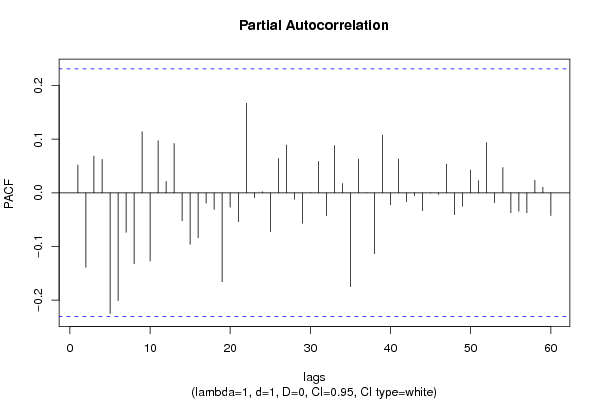
Partial Autocorrelation Function
Time lag kPACF(k)T-STATP-value
10.0518560.440.330624
2-0.138996-1.17940.121056
30.0684010.58040.281728
40.062240.52810.299519
5-0.225068-1.90980.030073
6-0.20106-1.7060.046155
7-0.073662-0.6250.26696
8-0.132315-1.12270.132641
90.1138060.96570.168718
10-0.127043-1.0780.142318
110.0971670.82450.206193
120.0211760.17970.428953
130.0917280.77830.21946
14-0.052359-0.44430.329086
15-0.096165-0.8160.2086
16-0.083983-0.71260.239191
17-0.019399-0.16460.434857
18-0.031153-0.26430.396136
19-0.165672-1.40580.082047
20-0.026822-0.22760.410303
21-0.053803-0.45650.32469
220.1671931.41870.080154
23-0.009203-0.07810.468986
240.0017860.01520.493976
25-0.072856-0.61820.269195
260.0641990.54470.293806
270.0889530.75480.226418
28-0.011809-0.10020.46023
29-0.056684-0.4810.315995
300.0005590.00470.498113
310.0583860.49540.310905
32-0.042816-0.36330.358722
330.0881470.74790.228463
340.0171950.14590.442203
35-0.175137-1.48610.070811
360.0629970.53450.297306
37-7.5e-05-6e-040.499746
38-0.113447-0.96260.169478
390.1077920.91460.181714
40-0.022184-0.18820.425612
410.0631460.53580.296869
42-0.016533-0.14030.444411
43-0.005536-0.0470.481332
44-0.033326-0.28280.389079
45-0.000293-0.00250.499012
46-0.002811-0.02390.490517
470.0535140.45410.325567
48-0.040757-0.34580.365237
49-0.024854-0.21090.416784
500.0424380.36010.359914
510.0226650.19230.424016
520.0934590.7930.215184
53-0.018567-0.15750.437628
540.0469680.39850.345707
55-0.037293-0.31640.376292
56-0.03419-0.29010.386282
57-0.037353-0.3170.376098
580.0231910.19680.422277
590.0105420.08940.464487
60-0.042396-0.35970.360045

\begin{tabular}{lllllllll}
\hline
Partial Autocorrelation Function \tabularnewline
Time lag k & PACF(k) & T-STAT & P-value \tabularnewline
1 & 0.051856 & 0.44 & 0.330624 \tabularnewline
2 & -0.138996 & -1.1794 & 0.121056 \tabularnewline
3 & 0.068401 & 0.5804 & 0.281728 \tabularnewline
4 & 0.06224 & 0.5281 & 0.299519 \tabularnewline
5 & -0.225068 & -1.9098 & 0.030073 \tabularnewline
6 & -0.20106 & -1.706 & 0.046155 \tabularnewline
7 & -0.073662 & -0.625 & 0.26696 \tabularnewline
8 & -0.132315 & -1.1227 & 0.132641 \tabularnewline
9 & 0.113806 & 0.9657 & 0.168718 \tabularnewline
10 & -0.127043 & -1.078 & 0.142318 \tabularnewline
11 & 0.097167 & 0.8245 & 0.206193 \tabularnewline
12 & 0.021176 & 0.1797 & 0.428953 \tabularnewline
13 & 0.091728 & 0.7783 & 0.21946 \tabularnewline
14 & -0.052359 & -0.4443 & 0.329086 \tabularnewline
15 & -0.096165 & -0.816 & 0.2086 \tabularnewline
16 & -0.083983 & -0.7126 & 0.239191 \tabularnewline
17 & -0.019399 & -0.1646 & 0.434857 \tabularnewline
18 & -0.031153 & -0.2643 & 0.396136 \tabularnewline
19 & -0.165672 & -1.4058 & 0.082047 \tabularnewline
20 & -0.026822 & -0.2276 & 0.410303 \tabularnewline
21 & -0.053803 & -0.4565 & 0.32469 \tabularnewline
22 & 0.167193 & 1.4187 & 0.080154 \tabularnewline
23 & -0.009203 & -0.0781 & 0.468986 \tabularnewline
24 & 0.001786 & 0.0152 & 0.493976 \tabularnewline
25 & -0.072856 & -0.6182 & 0.269195 \tabularnewline
26 & 0.064199 & 0.5447 & 0.293806 \tabularnewline
27 & 0.088953 & 0.7548 & 0.226418 \tabularnewline
28 & -0.011809 & -0.1002 & 0.46023 \tabularnewline
29 & -0.056684 & -0.481 & 0.315995 \tabularnewline
30 & 0.000559 & 0.0047 & 0.498113 \tabularnewline
31 & 0.058386 & 0.4954 & 0.310905 \tabularnewline
32 & -0.042816 & -0.3633 & 0.358722 \tabularnewline
33 & 0.088147 & 0.7479 & 0.228463 \tabularnewline
34 & 0.017195 & 0.1459 & 0.442203 \tabularnewline
35 & -0.175137 & -1.4861 & 0.070811 \tabularnewline
36 & 0.062997 & 0.5345 & 0.297306 \tabularnewline
37 & -7.5e-05 & -6e-04 & 0.499746 \tabularnewline
38 & -0.113447 & -0.9626 & 0.169478 \tabularnewline
39 & 0.107792 & 0.9146 & 0.181714 \tabularnewline
40 & -0.022184 & -0.1882 & 0.425612 \tabularnewline
41 & 0.063146 & 0.5358 & 0.296869 \tabularnewline
42 & -0.016533 & -0.1403 & 0.444411 \tabularnewline
43 & -0.005536 & -0.047 & 0.481332 \tabularnewline
44 & -0.033326 & -0.2828 & 0.389079 \tabularnewline
45 & -0.000293 & -0.0025 & 0.499012 \tabularnewline
46 & -0.002811 & -0.0239 & 0.490517 \tabularnewline
47 & 0.053514 & 0.4541 & 0.325567 \tabularnewline
48 & -0.040757 & -0.3458 & 0.365237 \tabularnewline
49 & -0.024854 & -0.2109 & 0.416784 \tabularnewline
50 & 0.042438 & 0.3601 & 0.359914 \tabularnewline
51 & 0.022665 & 0.1923 & 0.424016 \tabularnewline
52 & 0.093459 & 0.793 & 0.215184 \tabularnewline
53 & -0.018567 & -0.1575 & 0.437628 \tabularnewline
54 & 0.046968 & 0.3985 & 0.345707 \tabularnewline
55 & -0.037293 & -0.3164 & 0.376292 \tabularnewline
56 & -0.03419 & -0.2901 & 0.386282 \tabularnewline
57 & -0.037353 & -0.317 & 0.376098 \tabularnewline
58 & 0.023191 & 0.1968 & 0.422277 \tabularnewline
59 & 0.010542 & 0.0894 & 0.464487 \tabularnewline
60 & -0.042396 & -0.3597 & 0.360045 \tabularnewline
\hline
\end{tabular}
%Source: https://freestatistics.org/blog/index.php?pk=110477&T=2

[TABLE]
[ROW][C]Partial Autocorrelation Function[/C][/ROW]
[ROW][C]Time lag k[/C][C]PACF(k)[/C][C]T-STAT[/C][C]P-value[/C][/ROW]
[ROW][C]1[/C][C]0.051856[/C][C]0.44[/C][C]0.330624[/C][/ROW]
[ROW][C]2[/C][C]-0.138996[/C][C]-1.1794[/C][C]0.121056[/C][/ROW]
[ROW][C]3[/C][C]0.068401[/C][C]0.5804[/C][C]0.281728[/C][/ROW]
[ROW][C]4[/C][C]0.06224[/C][C]0.5281[/C][C]0.299519[/C][/ROW]
[ROW][C]5[/C][C]-0.225068[/C][C]-1.9098[/C][C]0.030073[/C][/ROW]
[ROW][C]6[/C][C]-0.20106[/C][C]-1.706[/C][C]0.046155[/C][/ROW]
[ROW][C]7[/C][C]-0.073662[/C][C]-0.625[/C][C]0.26696[/C][/ROW]
[ROW][C]8[/C][C]-0.132315[/C][C]-1.1227[/C][C]0.132641[/C][/ROW]
[ROW][C]9[/C][C]0.113806[/C][C]0.9657[/C][C]0.168718[/C][/ROW]
[ROW][C]10[/C][C]-0.127043[/C][C]-1.078[/C][C]0.142318[/C][/ROW]
[ROW][C]11[/C][C]0.097167[/C][C]0.8245[/C][C]0.206193[/C][/ROW]
[ROW][C]12[/C][C]0.021176[/C][C]0.1797[/C][C]0.428953[/C][/ROW]
[ROW][C]13[/C][C]0.091728[/C][C]0.7783[/C][C]0.21946[/C][/ROW]
[ROW][C]14[/C][C]-0.052359[/C][C]-0.4443[/C][C]0.329086[/C][/ROW]
[ROW][C]15[/C][C]-0.096165[/C][C]-0.816[/C][C]0.2086[/C][/ROW]
[ROW][C]16[/C][C]-0.083983[/C][C]-0.7126[/C][C]0.239191[/C][/ROW]
[ROW][C]17[/C][C]-0.019399[/C][C]-0.1646[/C][C]0.434857[/C][/ROW]
[ROW][C]18[/C][C]-0.031153[/C][C]-0.2643[/C][C]0.396136[/C][/ROW]
[ROW][C]19[/C][C]-0.165672[/C][C]-1.4058[/C][C]0.082047[/C][/ROW]
[ROW][C]20[/C][C]-0.026822[/C][C]-0.2276[/C][C]0.410303[/C][/ROW]
[ROW][C]21[/C][C]-0.053803[/C][C]-0.4565[/C][C]0.32469[/C][/ROW]
[ROW][C]22[/C][C]0.167193[/C][C]1.4187[/C][C]0.080154[/C][/ROW]
[ROW][C]23[/C][C]-0.009203[/C][C]-0.0781[/C][C]0.468986[/C][/ROW]
[ROW][C]24[/C][C]0.001786[/C][C]0.0152[/C][C]0.493976[/C][/ROW]
[ROW][C]25[/C][C]-0.072856[/C][C]-0.6182[/C][C]0.269195[/C][/ROW]
[ROW][C]26[/C][C]0.064199[/C][C]0.5447[/C][C]0.293806[/C][/ROW]
[ROW][C]27[/C][C]0.088953[/C][C]0.7548[/C][C]0.226418[/C][/ROW]
[ROW][C]28[/C][C]-0.011809[/C][C]-0.1002[/C][C]0.46023[/C][/ROW]
[ROW][C]29[/C][C]-0.056684[/C][C]-0.481[/C][C]0.315995[/C][/ROW]
[ROW][C]30[/C][C]0.000559[/C][C]0.0047[/C][C]0.498113[/C][/ROW]
[ROW][C]31[/C][C]0.058386[/C][C]0.4954[/C][C]0.310905[/C][/ROW]
[ROW][C]32[/C][C]-0.042816[/C][C]-0.3633[/C][C]0.358722[/C][/ROW]
[ROW][C]33[/C][C]0.088147[/C][C]0.7479[/C][C]0.228463[/C][/ROW]
[ROW][C]34[/C][C]0.017195[/C][C]0.1459[/C][C]0.442203[/C][/ROW]
[ROW][C]35[/C][C]-0.175137[/C][C]-1.4861[/C][C]0.070811[/C][/ROW]
[ROW][C]36[/C][C]0.062997[/C][C]0.5345[/C][C]0.297306[/C][/ROW]
[ROW][C]37[/C][C]-7.5e-05[/C][C]-6e-04[/C][C]0.499746[/C][/ROW]
[ROW][C]38[/C][C]-0.113447[/C][C]-0.9626[/C][C]0.169478[/C][/ROW]
[ROW][C]39[/C][C]0.107792[/C][C]0.9146[/C][C]0.181714[/C][/ROW]
[ROW][C]40[/C][C]-0.022184[/C][C]-0.1882[/C][C]0.425612[/C][/ROW]
[ROW][C]41[/C][C]0.063146[/C][C]0.5358[/C][C]0.296869[/C][/ROW]
[ROW][C]42[/C][C]-0.016533[/C][C]-0.1403[/C][C]0.444411[/C][/ROW]
[ROW][C]43[/C][C]-0.005536[/C][C]-0.047[/C][C]0.481332[/C][/ROW]
[ROW][C]44[/C][C]-0.033326[/C][C]-0.2828[/C][C]0.389079[/C][/ROW]
[ROW][C]45[/C][C]-0.000293[/C][C]-0.0025[/C][C]0.499012[/C][/ROW]
[ROW][C]46[/C][C]-0.002811[/C][C]-0.0239[/C][C]0.490517[/C][/ROW]
[ROW][C]47[/C][C]0.053514[/C][C]0.4541[/C][C]0.325567[/C][/ROW]
[ROW][C]48[/C][C]-0.040757[/C][C]-0.3458[/C][C]0.365237[/C][/ROW]
[ROW][C]49[/C][C]-0.024854[/C][C]-0.2109[/C][C]0.416784[/C][/ROW]
[ROW][C]50[/C][C]0.042438[/C][C]0.3601[/C][C]0.359914[/C][/ROW]
[ROW][C]51[/C][C]0.022665[/C][C]0.1923[/C][C]0.424016[/C][/ROW]
[ROW][C]52[/C][C]0.093459[/C][C]0.793[/C][C]0.215184[/C][/ROW]
[ROW][C]53[/C][C]-0.018567[/C][C]-0.1575[/C][C]0.437628[/C][/ROW]
[ROW][C]54[/C][C]0.046968[/C][C]0.3985[/C][C]0.345707[/C][/ROW]
[ROW][C]55[/C][C]-0.037293[/C][C]-0.3164[/C][C]0.376292[/C][/ROW]
[ROW][C]56[/C][C]-0.03419[/C][C]-0.2901[/C][C]0.386282[/C][/ROW]
[ROW][C]57[/C][C]-0.037353[/C][C]-0.317[/C][C]0.376098[/C][/ROW]
[ROW][C]58[/C][C]0.023191[/C][C]0.1968[/C][C]0.422277[/C][/ROW]
[ROW][C]59[/C][C]0.010542[/C][C]0.0894[/C][C]0.464487[/C][/ROW]
[ROW][C]60[/C][C]-0.042396[/C][C]-0.3597[/C][C]0.360045[/C][/ROW]
[/TABLE]
Source: https://freestatistics.org/blog/index.php?pk=110477&T=2

Globally Unique Identifier (entire table): ba.freestatistics.org/blog/index.php?pk=110477&T=2

As an alternative you can also use a QR Code:  

The GUIDs for individual cells are displayed in the table below:

Partial Autocorrelation Function
Time lag kPACF(k)T-STATP-value
10.0518560.440.330624
2-0.138996-1.17940.121056
30.0684010.58040.281728
40.062240.52810.299519
5-0.225068-1.90980.030073
6-0.20106-1.7060.046155
7-0.073662-0.6250.26696
8-0.132315-1.12270.132641
90.1138060.96570.168718
10-0.127043-1.0780.142318
110.0971670.82450.206193
120.0211760.17970.428953
130.0917280.77830.21946
14-0.052359-0.44430.329086
15-0.096165-0.8160.2086
16-0.083983-0.71260.239191
17-0.019399-0.16460.434857
18-0.031153-0.26430.396136
19-0.165672-1.40580.082047
20-0.026822-0.22760.410303
21-0.053803-0.45650.32469
220.1671931.41870.080154
23-0.009203-0.07810.468986
240.0017860.01520.493976
25-0.072856-0.61820.269195
260.0641990.54470.293806
270.0889530.75480.226418
28-0.011809-0.10020.46023
29-0.056684-0.4810.315995
300.0005590.00470.498113
310.0583860.49540.310905
32-0.042816-0.36330.358722
330.0881470.74790.228463
340.0171950.14590.442203
35-0.175137-1.48610.070811
360.0629970.53450.297306
37-7.5e-05-6e-040.499746
38-0.113447-0.96260.169478
390.1077920.91460.181714
40-0.022184-0.18820.425612
410.0631460.53580.296869
42-0.016533-0.14030.444411
43-0.005536-0.0470.481332
44-0.033326-0.28280.389079
45-0.000293-0.00250.499012
46-0.002811-0.02390.490517
470.0535140.45410.325567
48-0.040757-0.34580.365237
49-0.024854-0.21090.416784
500.0424380.36010.359914
510.0226650.19230.424016
520.0934590.7930.215184
53-0.018567-0.15750.437628
540.0469680.39850.345707
55-0.037293-0.31640.376292
56-0.03419-0.29010.386282
57-0.037353-0.3170.376098
580.0231910.19680.422277
590.0105420.08940.464487
60-0.042396-0.35970.360045


Parameters (Session):
par1 = 60 ; par2 = 1 ; par3 = 1 ; par4 = 0 ; par5 = 12 ; par6 = White Noise ; par7 = 0.95 ;
Parameters (R input):
par1 = 60 ; par2 = 1 ; par3 = 1 ; par4 = 0 ; par5 = 12 ; par6 = White Noise ; par7 = 0.95 ; par8 = ;
R code (references can be found in the software module):
if (par1 == 'Default') {
par1 = 10*log10(length(x))
} else {
par1 <- as.numeric(par1)
}
par2 <- as.numeric(par2)
par3 <- as.numeric(par3)
par4 <- as.numeric(par4)
par5 <- as.numeric(par5)
if (par6 == 'White Noise') par6 <- 'white' else par6 <- 'ma'
par7 <- as.numeric(par7)
if (par8 != '') par8 <- as.numeric(par8)
ox <- x
if (par8 == '') {
if (par2 == 0) {
x <- log(x)
} else {
x <- (x ^ par2 - 1) / par2
}
} else {
x <- log(x,base=par8)
}
if (par3 > 0) x <- diff(x,lag=1,difference=par3)
if (par4 > 0) x <- diff(x,lag=par5,difference=par4)
bitmap(file='picts.png')
op <- par(mfrow=c(2,1))
plot(ox,type='l',main='Original Time Series',xlab='time',ylab='value')
if (par8=='') {
mytitle <- paste('Working Time Series (lambda=',par2,', d=',par3,', D=',par4,')',sep='')
mysub <- paste('(lambda=',par2,', d=',par3,', D=',par4,', CI=', par7, ', CI type=',par6,')',sep='')
} else {
mytitle <- paste('Working Time Series (base=',par8,', d=',par3,', D=',par4,')',sep='')
mysub <- paste('(base=',par8,', d=',par3,', D=',par4,', CI=', par7, ', CI type=',par6,')',sep='')
}
plot(x,type='l', main=mytitle,xlab='time',ylab='value')
par(op)
dev.off()
bitmap(file='pic1.png')
racf <- acf(x, par1, main='Autocorrelation', xlab='time lag', ylab='ACF', ci.type=par6, ci=par7, sub=mysub)
dev.off()
bitmap(file='pic2.png')
rpacf <- pacf(x,par1,main='Partial Autocorrelation',xlab='lags',ylab='PACF',sub=mysub)
dev.off()
(myacf <- c(racf$acf))
(mypacf <- c(rpacf$acf))
lengthx <- length(x)
sqrtn <- sqrt(lengthx)
load(file='createtable')
a<-table.start()
a<-table.row.start(a)
a<-table.element(a,'Autocorrelation Function',4,TRUE)
a<-table.row.end(a)
a<-table.row.start(a)
a<-table.element(a,'Time lag k',header=TRUE)
a<-table.element(a,hyperlink('basics.htm','ACF(k)','click here for more information about the Autocorrelation Function'),header=TRUE)
a<-table.element(a,'T-STAT',header=TRUE)
a<-table.element(a,'P-value',header=TRUE)
a<-table.row.end(a)
for (i in 2:(par1+1)) {
a<-table.row.start(a)
a<-table.element(a,i-1,header=TRUE)
a<-table.element(a,round(myacf[i],6))
mytstat <- myacf[i]*sqrtn
a<-table.element(a,round(mytstat,4))
a<-table.element(a,round(1-pt(abs(mytstat),lengthx),6))
a<-table.row.end(a)
}
a<-table.end(a)
table.save(a,file='mytable.tab')
a<-table.start()
a<-table.row.start(a)
a<-table.element(a,'Partial Autocorrelation Function',4,TRUE)
a<-table.row.end(a)
a<-table.row.start(a)
a<-table.element(a,'Time lag k',header=TRUE)
a<-table.element(a,hyperlink('basics.htm','PACF(k)','click here for more information about the Partial Autocorrelation Function'),header=TRUE)
a<-table.element(a,'T-STAT',header=TRUE)
a<-table.element(a,'P-value',header=TRUE)
a<-table.row.end(a)
for (i in 1:par1) {
a<-table.row.start(a)
a<-table.element(a,i,header=TRUE)
a<-table.element(a,round(mypacf[i],6))
mytstat <- mypacf[i]*sqrtn
a<-table.element(a,round(mytstat,4))
a<-table.element(a,round(1-pt(abs(mytstat),lengthx),6))
a<-table.row.end(a)
}
a<-table.end(a)
table.save(a,file='mytable1.tab')