| Multiple Linear Regression - Estimated Regression Equation |
| ParadoxicalSleep[t] = + 1.07450435018740 -0.110510307330023OverallDangerIndex[t] -0.30353818298999GestationTime[t] + e[t] |
| Multiple Linear Regression - Ordinary Least Squares | |||||
| Variable | Parameter | S.D. | T-STAT H0: parameter = 0 | 2-tail p-value | 1-tail p-value |
| (Intercept) | 1.07450435018740 | 0.128751 | 8.3456 | 0 | 0 |
| OverallDangerIndex | -0.110510307330023 | 0.022191 | -4.98 | 1.6e-05 | 8e-06 |
| GestationTime | -0.30353818298999 | 0.068904 | -4.4052 | 9.1e-05 | 4.5e-05 |
| Multiple Linear Regression - Regression Statistics | |
| Multiple R | 0.809091622594016 |
| R-squared | 0.654629253751817 |
| Adjusted R-squared | 0.635441990071363 |
| F-TEST (value) | 34.1179057448752 |
| F-TEST (DF numerator) | 2 |
| F-TEST (DF denominator) | 36 |
| p-value | 4.88809770438081e-09 |
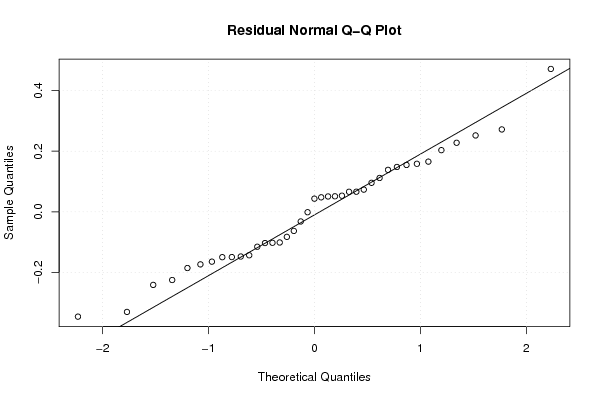
| Multiple Linear Regression - Residual Statistics | |
| Residual Standard Deviation | 0.181763723400882 |
| Sum Squared Residuals | 1.18936984120389 |
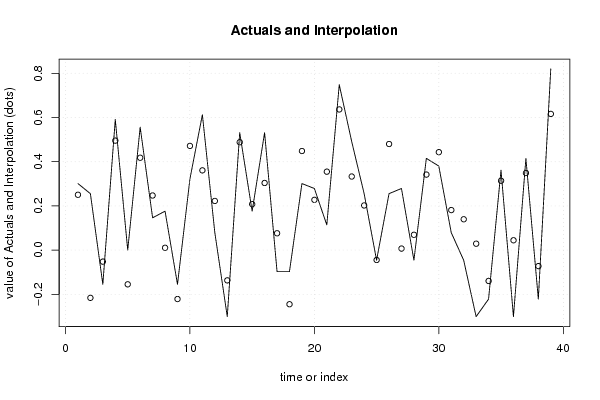
| Multiple Linear Regression - Actuals, Interpolation, and Residuals | |||
| Time or Index | Actuals | Interpolation Forecast | Residuals Prediction Error |
| 1 | 0.30103 | 0.250255072658832 | 0.0507749273411682 |
| 2 | 0.25527 | -0.215980737462651 | 0.471250737462651 |
| 3 | -0.1549 | -0.0520974370845254 | -0.102802562915475 |
| 4 | 0.59106 | 0.495309840648025 | 0.0957501593519752 |
| 5 | 0 | -0.154699413698802 | 0.154699413698802 |
| 6 | 0.5563 | 0.41782564867617 | 0.13847435132383 |
| 7 | 0.14613 | 0.247118809944429 | -0.100988809944429 |
| 8 | 0.17609 | 0.0104466055205620 | 0.165643394479438 |
| 9 | -0.1549 | -0.221324170532132 | 0.0664241705321322 |
| 10 | 0.32222 | 0.471275687318877 | -0.149055687318877 |
| 11 | 0.61278 | 0.360765379988854 | 0.252014620011146 |
| 12 | 0.07918 | 0.222373216218228 | -0.143193216218228 |
| 13 | -0.30103 | -0.136803963478569 | -0.164226036521431 |
| 14 | 0.53148 | 0.487987338625449 | 0.0434926613745511 |
| 15 | 0.17609 | 0.207771155283437 | -0.0316811552834371 |
| 16 | 0.53148 | 0.303705111301539 | 0.227774888698461 |
| 17 | -0.09691 | 0.0762263651563228 | -0.173136365156323 |
| 18 | -0.09691 | -0.244887839677645 | 0.147977839677645 |
| 19 | 0.30103 | 0.448291776102875 | -0.147261776102875 |
| 20 | 0.27875 | 0.227455606450338 | 0.0512943935496621 |
| 21 | 0.11394 | 0.354823976698883 | -0.240883976698883 |
| 22 | 0.74819 | 0.636421706538241 | 0.111768293461759 |
| 23 | 0.49136 | 0.332883523548251 | 0.158476476451749 |
| 24 | 0.25527 | 0.202051334867048 | 0.0532186651329517 |
| 25 | -0.04576 | -0.0445636193827138 | -0.00119638061728621 |
| 26 | 0.25527 | 0.479995178267322 | -0.224725178267322 |
| 27 | 0.27875 | 0.00696198717983693 | 0.271788012820163 |
| 28 | -0.04576 | 0.0692681089533349 | -0.115028108953335 |
| 29 | 0.41497 | 0.341629171884308 | 0.073340828115692 |
| 30 | 0.38021 | 0.443122520846556 | -0.0629125208465558 |
| 31 | 0.07918 | 0.181195226313806 | -0.102015226313806 |
| 32 | -0.04576 | 0.139507292261961 | -0.185267292261961 |
| 33 | -0.30103 | 0.0289969849319377 | -0.330026984931938 |
| 34 | -0.22185 | -0.139450816434242 | -0.0823991835657578 |
| 35 | 0.36173 | 0.313747315443705 | 0.0479826845562951 |
| 36 | -0.30103 | 0.0445229629918757 | -0.345552962991876 |
| 37 | 0.41497 | 0.34877258637892 | 0.0661974136210802 |
| 38 | -0.22185 | -0.0724193184357053 | -0.149430681564295 |
| 39 | 0.81954 | 0.616099825187061 | 0.203440174812939 |
| Goldfeld-Quandt test for Heteroskedasticity | |||
| p-values | Alternative Hypothesis | ||
| breakpoint index | greater | 2-sided | less |
| 6 | 0.597922213564454 | 0.804155572871092 | 0.402077786435546 |
| 7 | 0.805804416927485 | 0.38839116614503 | 0.194195583072515 |
| 8 | 0.7209684044599 | 0.558063191080201 | 0.279031595540101 |
| 9 | 0.649749713936246 | 0.700500572127507 | 0.350250286063754 |
| 10 | 0.612987655905292 | 0.774024688189416 | 0.387012344094708 |
| 11 | 0.690089468091665 | 0.619821063816671 | 0.309910531908335 |
| 12 | 0.691184206014896 | 0.617631587970208 | 0.308815793985104 |
| 13 | 0.737886685051194 | 0.524226629897611 | 0.262113314948806 |
| 14 | 0.651760497064667 | 0.696479005870666 | 0.348239502935333 |
| 15 | 0.566629831204791 | 0.866740337590417 | 0.433370168795209 |
| 16 | 0.59468000535459 | 0.81063998929082 | 0.40531999464541 |
| 17 | 0.610871636933861 | 0.778256726132277 | 0.389128363066139 |
| 18 | 0.613433781493006 | 0.773132437013988 | 0.386566218506994 |
| 19 | 0.589196961672997 | 0.821606076654007 | 0.410803038327003 |
| 20 | 0.503418139079496 | 0.99316372184101 | 0.496581860920504 |
| 21 | 0.591395981070864 | 0.817208037858271 | 0.408604018929136 |
| 22 | 0.526278491835464 | 0.947443016329072 | 0.473721508164536 |
| 23 | 0.534348855651302 | 0.931302288697396 | 0.465651144348698 |
| 24 | 0.482911047859623 | 0.965822095719245 | 0.517088952140377 |
| 25 | 0.414298504826928 | 0.828597009653856 | 0.585701495173072 |
| 26 | 0.602851554743701 | 0.794296890512598 | 0.397148445256299 |
| 27 | 0.9605562364507 | 0.078887527098599 | 0.0394437635492995 |
| 28 | 0.97055213919692 | 0.0588957216061583 | 0.0294478608030792 |
| 29 | 0.961722114256579 | 0.0765557714868426 | 0.0382778857434213 |
| 30 | 0.932746256496211 | 0.134507487007578 | 0.0672537435037889 |
| 31 | 0.913605559996808 | 0.172788880006383 | 0.0863944400031916 |
| 32 | 0.93635189406064 | 0.127296211878719 | 0.0636481059393594 |
| 33 | 0.880355301334992 | 0.239289397330017 | 0.119644698665008 |
| Meta Analysis of Goldfeld-Quandt test for Heteroskedasticity | |||
| Description | # significant tests | % significant tests | OK/NOK |
| 1% type I error level | 0 | 0 | OK |
| 5% type I error level | 0 | 0 | OK |
| 10% type I error level | 3 | 0.107142857142857 | NOK |