Free Statistics

of Irreproducible Research!

Author's title

Author*The author of this computation has been verified*
R Software Modulerwasp_autocorrelation.wasp
Title produced by software(Partial) Autocorrelation Function
Date of computationWed, 15 Dec 2010 15:10:29 +0000
Cite this page as followsStatistical Computations at FreeStatistics.org, Office for Research Development and Education, URL https://freestatistics.org/blog/index.php?v=date/2010/Dec/15/t1292425914uwtpbm4vubd558e.htm/, Retrieved Fri, 03 May 2024 05:08:52 +0000
Statistical Computations at FreeStatistics.org, Office for Research Development and Education, URL https://freestatistics.org/blog/index.php?pk=110452, Retrieved Fri, 03 May 2024 05:08:52 +0000
QR Codes:

Original text written by user:
IsPrivate?No (this computation is public)
User-defined keywords
Estimated Impact111
Family? (F = Feedback message, R = changed R code, M = changed R Module, P = changed Parameters, D = changed Data)
-       [(Partial) Autocorrelation Function] [] [2010-12-15 15:10:29] [b7dd4adfab743bef2d672ff51f950617] [Current]
Feedback Forum

Post a new message
Dataseries X:
186448
190530
194207
190855
200779
204428
207617
212071
214239
215883
223484
221529
225247
226699
231406
232324
237192
236727
240698
240688
245283
243556
247826
245798
250479
249216
251896
247616
249994
246552
248771
247551
249745
245742
249019
245841
248771
244723
246878
246014
248496
244351
248016
246509
249426
247840
251035
250161
254278
250801
253985
249174
251287
247947
249992
243805
255812
250417
253033
248705
253950
251484
251093
245996
252721
248019
250464
245571
252690
250183
253639
254436
265280
268705
270643
271480


Summary of computational transaction
Raw Inputview raw input (R code)
Raw Outputview raw output of R engine
Computing time2 seconds
R Server'RServer@AstonUniversity' @ vre.aston.ac.uk

\begin{tabular}{lllllllll}
\hline
Summary of computational transaction \tabularnewline
Raw Input & view raw input (R code)  \tabularnewline
Raw Output & view raw output of R engine  \tabularnewline
Computing time & 2 seconds \tabularnewline
R Server & 'RServer@AstonUniversity' @ vre.aston.ac.uk \tabularnewline
\hline
\end{tabular}
%Source: https://freestatistics.org/blog/index.php?pk=110452&T=0

[TABLE]
[ROW][C]Summary of computational transaction[/C][/ROW]
[ROW][C]Raw Input[/C][C]view raw input (R code) [/C][/ROW]
[ROW][C]Raw Output[/C][C]view raw output of R engine [/C][/ROW]
[ROW][C]Computing time[/C][C]2 seconds[/C][/ROW]
[ROW][C]R Server[/C][C]'RServer@AstonUniversity' @ vre.aston.ac.uk[/C][/ROW]
[/TABLE]
Source: https://freestatistics.org/blog/index.php?pk=110452&T=0

Globally Unique Identifier (entire table): ba.freestatistics.org/blog/index.php?pk=110452&T=0

As an alternative you can also use a QR Code:  

The GUIDs for individual cells are displayed in the table below:

Summary of computational transaction
Raw Inputview raw input (R code)
Raw Outputview raw output of R engine
Computing time2 seconds
R Server'RServer@AstonUniversity' @ vre.aston.ac.uk


Autocorrelation Function
Time lag kACF(k)T-STATP-value
1-0.524706-4.54411e-05
20.6224625.39070
3-0.436315-3.77860.000157
40.6643785.75370
5-0.480721-4.16324.1e-05
60.5719264.9532e-06
7-0.549241-4.75665e-06
80.6531795.65670
9-0.479708-4.15444.3e-05
100.4946764.2842.7e-05
11-0.472211-4.08955.4e-05
120.5551374.80764e-06
13-0.472924-4.09565.3e-05
140.481754.17214e-05
15-0.454978-3.94029.1e-05
160.4857254.20653.6e-05
17-0.420982-3.64580.000245
180.392723.40110.00054
19-0.44081-3.81750.000138
200.3565153.08750.001414
21-0.401091-3.47350.000428
220.3520113.04850.001588
23-0.419454-3.63260.000255
240.3508243.03820.001637
25-0.335649-2.90680.002399
260.328562.84540.002858
27-0.359417-3.11260.001312
280.2899662.51120.007093
29-0.335095-2.9020.002433
300.3170832.7460.003774
31-0.37401-3.2390.000894
320.2896132.50810.007149
33-0.323104-2.79820.003264
340.2667362.310.01182
35-0.317166-2.74670.003766
360.2301381.99310.024947
37-0.303758-2.63060.005169
380.2439682.11280.018972
39-0.303101-2.62490.005249
400.2107151.82480.036003
41-0.260376-2.25490.013528
420.1808611.56630.060744
43-0.252194-2.18410.016042
440.1600831.38640.084872
45-0.298535-2.58540.005834
460.1806471.56440.060961
47-0.235684-2.04110.022381
480.1243611.0770.142466
49-0.179877-1.55780.061747
500.1016080.880.190848
51-0.159522-1.38150.085614
520.1560941.35180.090248
53-0.205902-1.78320.039303
540.121731.05420.147585
55-0.108122-0.93640.176045
560.0858020.74310.22988
57-0.108066-0.93590.17617
580.0560260.48520.314476
59-0.05428-0.47010.319832
600.0683840.59220.277742

\begin{tabular}{lllllllll}
\hline
Autocorrelation Function \tabularnewline
Time lag k & ACF(k) & T-STAT & P-value \tabularnewline
1 & -0.524706 & -4.5441 & 1e-05 \tabularnewline
2 & 0.622462 & 5.3907 & 0 \tabularnewline
3 & -0.436315 & -3.7786 & 0.000157 \tabularnewline
4 & 0.664378 & 5.7537 & 0 \tabularnewline
5 & -0.480721 & -4.1632 & 4.1e-05 \tabularnewline
6 & 0.571926 & 4.953 & 2e-06 \tabularnewline
7 & -0.549241 & -4.7566 & 5e-06 \tabularnewline
8 & 0.653179 & 5.6567 & 0 \tabularnewline
9 & -0.479708 & -4.1544 & 4.3e-05 \tabularnewline
10 & 0.494676 & 4.284 & 2.7e-05 \tabularnewline
11 & -0.472211 & -4.0895 & 5.4e-05 \tabularnewline
12 & 0.555137 & 4.8076 & 4e-06 \tabularnewline
13 & -0.472924 & -4.0956 & 5.3e-05 \tabularnewline
14 & 0.48175 & 4.1721 & 4e-05 \tabularnewline
15 & -0.454978 & -3.9402 & 9.1e-05 \tabularnewline
16 & 0.485725 & 4.2065 & 3.6e-05 \tabularnewline
17 & -0.420982 & -3.6458 & 0.000245 \tabularnewline
18 & 0.39272 & 3.4011 & 0.00054 \tabularnewline
19 & -0.44081 & -3.8175 & 0.000138 \tabularnewline
20 & 0.356515 & 3.0875 & 0.001414 \tabularnewline
21 & -0.401091 & -3.4735 & 0.000428 \tabularnewline
22 & 0.352011 & 3.0485 & 0.001588 \tabularnewline
23 & -0.419454 & -3.6326 & 0.000255 \tabularnewline
24 & 0.350824 & 3.0382 & 0.001637 \tabularnewline
25 & -0.335649 & -2.9068 & 0.002399 \tabularnewline
26 & 0.32856 & 2.8454 & 0.002858 \tabularnewline
27 & -0.359417 & -3.1126 & 0.001312 \tabularnewline
28 & 0.289966 & 2.5112 & 0.007093 \tabularnewline
29 & -0.335095 & -2.902 & 0.002433 \tabularnewline
30 & 0.317083 & 2.746 & 0.003774 \tabularnewline
31 & -0.37401 & -3.239 & 0.000894 \tabularnewline
32 & 0.289613 & 2.5081 & 0.007149 \tabularnewline
33 & -0.323104 & -2.7982 & 0.003264 \tabularnewline
34 & 0.266736 & 2.31 & 0.01182 \tabularnewline
35 & -0.317166 & -2.7467 & 0.003766 \tabularnewline
36 & 0.230138 & 1.9931 & 0.024947 \tabularnewline
37 & -0.303758 & -2.6306 & 0.005169 \tabularnewline
38 & 0.243968 & 2.1128 & 0.018972 \tabularnewline
39 & -0.303101 & -2.6249 & 0.005249 \tabularnewline
40 & 0.210715 & 1.8248 & 0.036003 \tabularnewline
41 & -0.260376 & -2.2549 & 0.013528 \tabularnewline
42 & 0.180861 & 1.5663 & 0.060744 \tabularnewline
43 & -0.252194 & -2.1841 & 0.016042 \tabularnewline
44 & 0.160083 & 1.3864 & 0.084872 \tabularnewline
45 & -0.298535 & -2.5854 & 0.005834 \tabularnewline
46 & 0.180647 & 1.5644 & 0.060961 \tabularnewline
47 & -0.235684 & -2.0411 & 0.022381 \tabularnewline
48 & 0.124361 & 1.077 & 0.142466 \tabularnewline
49 & -0.179877 & -1.5578 & 0.061747 \tabularnewline
50 & 0.101608 & 0.88 & 0.190848 \tabularnewline
51 & -0.159522 & -1.3815 & 0.085614 \tabularnewline
52 & 0.156094 & 1.3518 & 0.090248 \tabularnewline
53 & -0.205902 & -1.7832 & 0.039303 \tabularnewline
54 & 0.12173 & 1.0542 & 0.147585 \tabularnewline
55 & -0.108122 & -0.9364 & 0.176045 \tabularnewline
56 & 0.085802 & 0.7431 & 0.22988 \tabularnewline
57 & -0.108066 & -0.9359 & 0.17617 \tabularnewline
58 & 0.056026 & 0.4852 & 0.314476 \tabularnewline
59 & -0.05428 & -0.4701 & 0.319832 \tabularnewline
60 & 0.068384 & 0.5922 & 0.277742 \tabularnewline
\hline
\end{tabular}
%Source: https://freestatistics.org/blog/index.php?pk=110452&T=1

[TABLE]
[ROW][C]Autocorrelation Function[/C][/ROW]
[ROW][C]Time lag k[/C][C]ACF(k)[/C][C]T-STAT[/C][C]P-value[/C][/ROW]
[ROW][C]1[/C][C]-0.524706[/C][C]-4.5441[/C][C]1e-05[/C][/ROW]
[ROW][C]2[/C][C]0.622462[/C][C]5.3907[/C][C]0[/C][/ROW]
[ROW][C]3[/C][C]-0.436315[/C][C]-3.7786[/C][C]0.000157[/C][/ROW]
[ROW][C]4[/C][C]0.664378[/C][C]5.7537[/C][C]0[/C][/ROW]
[ROW][C]5[/C][C]-0.480721[/C][C]-4.1632[/C][C]4.1e-05[/C][/ROW]
[ROW][C]6[/C][C]0.571926[/C][C]4.953[/C][C]2e-06[/C][/ROW]
[ROW][C]7[/C][C]-0.549241[/C][C]-4.7566[/C][C]5e-06[/C][/ROW]
[ROW][C]8[/C][C]0.653179[/C][C]5.6567[/C][C]0[/C][/ROW]
[ROW][C]9[/C][C]-0.479708[/C][C]-4.1544[/C][C]4.3e-05[/C][/ROW]
[ROW][C]10[/C][C]0.494676[/C][C]4.284[/C][C]2.7e-05[/C][/ROW]
[ROW][C]11[/C][C]-0.472211[/C][C]-4.0895[/C][C]5.4e-05[/C][/ROW]
[ROW][C]12[/C][C]0.555137[/C][C]4.8076[/C][C]4e-06[/C][/ROW]
[ROW][C]13[/C][C]-0.472924[/C][C]-4.0956[/C][C]5.3e-05[/C][/ROW]
[ROW][C]14[/C][C]0.48175[/C][C]4.1721[/C][C]4e-05[/C][/ROW]
[ROW][C]15[/C][C]-0.454978[/C][C]-3.9402[/C][C]9.1e-05[/C][/ROW]
[ROW][C]16[/C][C]0.485725[/C][C]4.2065[/C][C]3.6e-05[/C][/ROW]
[ROW][C]17[/C][C]-0.420982[/C][C]-3.6458[/C][C]0.000245[/C][/ROW]
[ROW][C]18[/C][C]0.39272[/C][C]3.4011[/C][C]0.00054[/C][/ROW]
[ROW][C]19[/C][C]-0.44081[/C][C]-3.8175[/C][C]0.000138[/C][/ROW]
[ROW][C]20[/C][C]0.356515[/C][C]3.0875[/C][C]0.001414[/C][/ROW]
[ROW][C]21[/C][C]-0.401091[/C][C]-3.4735[/C][C]0.000428[/C][/ROW]
[ROW][C]22[/C][C]0.352011[/C][C]3.0485[/C][C]0.001588[/C][/ROW]
[ROW][C]23[/C][C]-0.419454[/C][C]-3.6326[/C][C]0.000255[/C][/ROW]
[ROW][C]24[/C][C]0.350824[/C][C]3.0382[/C][C]0.001637[/C][/ROW]
[ROW][C]25[/C][C]-0.335649[/C][C]-2.9068[/C][C]0.002399[/C][/ROW]
[ROW][C]26[/C][C]0.32856[/C][C]2.8454[/C][C]0.002858[/C][/ROW]
[ROW][C]27[/C][C]-0.359417[/C][C]-3.1126[/C][C]0.001312[/C][/ROW]
[ROW][C]28[/C][C]0.289966[/C][C]2.5112[/C][C]0.007093[/C][/ROW]
[ROW][C]29[/C][C]-0.335095[/C][C]-2.902[/C][C]0.002433[/C][/ROW]
[ROW][C]30[/C][C]0.317083[/C][C]2.746[/C][C]0.003774[/C][/ROW]
[ROW][C]31[/C][C]-0.37401[/C][C]-3.239[/C][C]0.000894[/C][/ROW]
[ROW][C]32[/C][C]0.289613[/C][C]2.5081[/C][C]0.007149[/C][/ROW]
[ROW][C]33[/C][C]-0.323104[/C][C]-2.7982[/C][C]0.003264[/C][/ROW]
[ROW][C]34[/C][C]0.266736[/C][C]2.31[/C][C]0.01182[/C][/ROW]
[ROW][C]35[/C][C]-0.317166[/C][C]-2.7467[/C][C]0.003766[/C][/ROW]
[ROW][C]36[/C][C]0.230138[/C][C]1.9931[/C][C]0.024947[/C][/ROW]
[ROW][C]37[/C][C]-0.303758[/C][C]-2.6306[/C][C]0.005169[/C][/ROW]
[ROW][C]38[/C][C]0.243968[/C][C]2.1128[/C][C]0.018972[/C][/ROW]
[ROW][C]39[/C][C]-0.303101[/C][C]-2.6249[/C][C]0.005249[/C][/ROW]
[ROW][C]40[/C][C]0.210715[/C][C]1.8248[/C][C]0.036003[/C][/ROW]
[ROW][C]41[/C][C]-0.260376[/C][C]-2.2549[/C][C]0.013528[/C][/ROW]
[ROW][C]42[/C][C]0.180861[/C][C]1.5663[/C][C]0.060744[/C][/ROW]
[ROW][C]43[/C][C]-0.252194[/C][C]-2.1841[/C][C]0.016042[/C][/ROW]
[ROW][C]44[/C][C]0.160083[/C][C]1.3864[/C][C]0.084872[/C][/ROW]
[ROW][C]45[/C][C]-0.298535[/C][C]-2.5854[/C][C]0.005834[/C][/ROW]
[ROW][C]46[/C][C]0.180647[/C][C]1.5644[/C][C]0.060961[/C][/ROW]
[ROW][C]47[/C][C]-0.235684[/C][C]-2.0411[/C][C]0.022381[/C][/ROW]
[ROW][C]48[/C][C]0.124361[/C][C]1.077[/C][C]0.142466[/C][/ROW]
[ROW][C]49[/C][C]-0.179877[/C][C]-1.5578[/C][C]0.061747[/C][/ROW]
[ROW][C]50[/C][C]0.101608[/C][C]0.88[/C][C]0.190848[/C][/ROW]
[ROW][C]51[/C][C]-0.159522[/C][C]-1.3815[/C][C]0.085614[/C][/ROW]
[ROW][C]52[/C][C]0.156094[/C][C]1.3518[/C][C]0.090248[/C][/ROW]
[ROW][C]53[/C][C]-0.205902[/C][C]-1.7832[/C][C]0.039303[/C][/ROW]
[ROW][C]54[/C][C]0.12173[/C][C]1.0542[/C][C]0.147585[/C][/ROW]
[ROW][C]55[/C][C]-0.108122[/C][C]-0.9364[/C][C]0.176045[/C][/ROW]
[ROW][C]56[/C][C]0.085802[/C][C]0.7431[/C][C]0.22988[/C][/ROW]
[ROW][C]57[/C][C]-0.108066[/C][C]-0.9359[/C][C]0.17617[/C][/ROW]
[ROW][C]58[/C][C]0.056026[/C][C]0.4852[/C][C]0.314476[/C][/ROW]
[ROW][C]59[/C][C]-0.05428[/C][C]-0.4701[/C][C]0.319832[/C][/ROW]
[ROW][C]60[/C][C]0.068384[/C][C]0.5922[/C][C]0.277742[/C][/ROW]
[/TABLE]
Source: https://freestatistics.org/blog/index.php?pk=110452&T=1

Globally Unique Identifier (entire table): ba.freestatistics.org/blog/index.php?pk=110452&T=1

As an alternative you can also use a QR Code:  

The GUIDs for individual cells are displayed in the table below:

Autocorrelation Function
Time lag kACF(k)T-STATP-value
1-0.524706-4.54411e-05
20.6224625.39070
3-0.436315-3.77860.000157
40.6643785.75370
5-0.480721-4.16324.1e-05
60.5719264.9532e-06
7-0.549241-4.75665e-06
80.6531795.65670
9-0.479708-4.15444.3e-05
100.4946764.2842.7e-05
11-0.472211-4.08955.4e-05
120.5551374.80764e-06
13-0.472924-4.09565.3e-05
140.481754.17214e-05
15-0.454978-3.94029.1e-05
160.4857254.20653.6e-05
17-0.420982-3.64580.000245
180.392723.40110.00054
19-0.44081-3.81750.000138
200.3565153.08750.001414
21-0.401091-3.47350.000428
220.3520113.04850.001588
23-0.419454-3.63260.000255
240.3508243.03820.001637
25-0.335649-2.90680.002399
260.328562.84540.002858
27-0.359417-3.11260.001312
280.2899662.51120.007093
29-0.335095-2.9020.002433
300.3170832.7460.003774
31-0.37401-3.2390.000894
320.2896132.50810.007149
33-0.323104-2.79820.003264
340.2667362.310.01182
35-0.317166-2.74670.003766
360.2301381.99310.024947
37-0.303758-2.63060.005169
380.2439682.11280.018972
39-0.303101-2.62490.005249
400.2107151.82480.036003
41-0.260376-2.25490.013528
420.1808611.56630.060744
43-0.252194-2.18410.016042
440.1600831.38640.084872
45-0.298535-2.58540.005834
460.1806471.56440.060961
47-0.235684-2.04110.022381
480.1243611.0770.142466
49-0.179877-1.55780.061747
500.1016080.880.190848
51-0.159522-1.38150.085614
520.1560941.35180.090248
53-0.205902-1.78320.039303
540.121731.05420.147585
55-0.108122-0.93640.176045
560.0858020.74310.22988
57-0.108066-0.93590.17617
580.0560260.48520.314476
59-0.05428-0.47010.319832
600.0683840.59220.277742


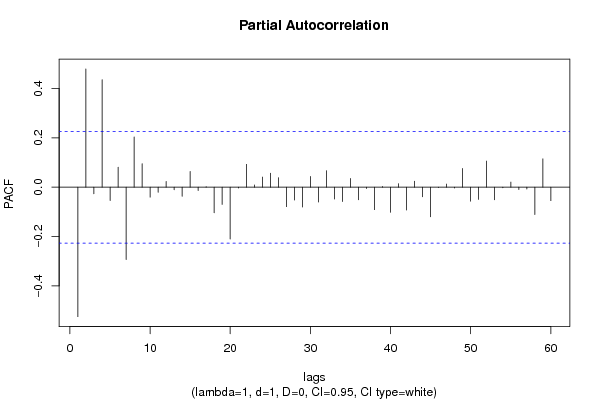
Partial Autocorrelation Function
Time lag kPACF(k)T-STATP-value
1-0.524706-4.54411e-05
20.4790314.14854.4e-05
3-0.026526-0.22970.409467
40.4356113.77250.00016
5-0.054518-0.47210.3191
60.0810610.7020.242422
7-0.293404-2.5410.006561
80.2035071.76240.041036
90.0952140.82460.206113
10-0.04041-0.350.363675
11-0.020888-0.18090.42847
120.0232350.20120.420534
13-0.010247-0.08870.464763
14-0.036933-0.31980.374987
150.0639030.55340.290813
16-0.013422-0.11620.453887
170.0019740.01710.493204
18-0.103448-0.89590.18659
19-0.069747-0.6040.273825
20-0.210045-1.8190.036448
21-0.003703-0.03210.487251
220.0924560.80070.212919
230.0087520.07580.469893
240.0407040.35250.362724
250.0565550.48980.312858
260.0384440.33290.370056
27-0.07896-0.68380.2481
28-0.052053-0.45080.326719
29-0.080465-0.69680.244027
300.0432810.37480.354426
31-0.060001-0.51960.302429
320.066250.57370.28393
33-0.048051-0.41610.339251
34-0.057886-0.50130.308813
350.0352980.30570.380343
36-0.051455-0.44560.32858
37-0.005709-0.04940.48035
38-0.091036-0.78840.216474
390.0029260.02530.489926
40-0.101801-0.88160.190399
410.0136110.11790.453242
42-0.092809-0.80370.212041
430.0238420.20650.418488
44-0.038859-0.33650.368706
45-0.11986-1.0380.151297
46-0.001734-0.0150.494028
470.0123370.10680.4576
48-0.003887-0.03370.486617
490.0755520.65430.257461
50-0.056617-0.49030.312671
51-0.049617-0.42970.334323
520.1056330.91480.181612
53-0.0508-0.43990.330621
54-0.002364-0.02050.491859
550.0205390.17790.42965
56-0.009745-0.08440.466485
57-0.007943-0.06880.472669
58-0.110675-0.95850.170452
590.1146610.9930.161953
60-0.054769-0.47430.318328

\begin{tabular}{lllllllll}
\hline
Partial Autocorrelation Function \tabularnewline
Time lag k & PACF(k) & T-STAT & P-value \tabularnewline
1 & -0.524706 & -4.5441 & 1e-05 \tabularnewline
2 & 0.479031 & 4.1485 & 4.4e-05 \tabularnewline
3 & -0.026526 & -0.2297 & 0.409467 \tabularnewline
4 & 0.435611 & 3.7725 & 0.00016 \tabularnewline
5 & -0.054518 & -0.4721 & 0.3191 \tabularnewline
6 & 0.081061 & 0.702 & 0.242422 \tabularnewline
7 & -0.293404 & -2.541 & 0.006561 \tabularnewline
8 & 0.203507 & 1.7624 & 0.041036 \tabularnewline
9 & 0.095214 & 0.8246 & 0.206113 \tabularnewline
10 & -0.04041 & -0.35 & 0.363675 \tabularnewline
11 & -0.020888 & -0.1809 & 0.42847 \tabularnewline
12 & 0.023235 & 0.2012 & 0.420534 \tabularnewline
13 & -0.010247 & -0.0887 & 0.464763 \tabularnewline
14 & -0.036933 & -0.3198 & 0.374987 \tabularnewline
15 & 0.063903 & 0.5534 & 0.290813 \tabularnewline
16 & -0.013422 & -0.1162 & 0.453887 \tabularnewline
17 & 0.001974 & 0.0171 & 0.493204 \tabularnewline
18 & -0.103448 & -0.8959 & 0.18659 \tabularnewline
19 & -0.069747 & -0.604 & 0.273825 \tabularnewline
20 & -0.210045 & -1.819 & 0.036448 \tabularnewline
21 & -0.003703 & -0.0321 & 0.487251 \tabularnewline
22 & 0.092456 & 0.8007 & 0.212919 \tabularnewline
23 & 0.008752 & 0.0758 & 0.469893 \tabularnewline
24 & 0.040704 & 0.3525 & 0.362724 \tabularnewline
25 & 0.056555 & 0.4898 & 0.312858 \tabularnewline
26 & 0.038444 & 0.3329 & 0.370056 \tabularnewline
27 & -0.07896 & -0.6838 & 0.2481 \tabularnewline
28 & -0.052053 & -0.4508 & 0.326719 \tabularnewline
29 & -0.080465 & -0.6968 & 0.244027 \tabularnewline
30 & 0.043281 & 0.3748 & 0.354426 \tabularnewline
31 & -0.060001 & -0.5196 & 0.302429 \tabularnewline
32 & 0.06625 & 0.5737 & 0.28393 \tabularnewline
33 & -0.048051 & -0.4161 & 0.339251 \tabularnewline
34 & -0.057886 & -0.5013 & 0.308813 \tabularnewline
35 & 0.035298 & 0.3057 & 0.380343 \tabularnewline
36 & -0.051455 & -0.4456 & 0.32858 \tabularnewline
37 & -0.005709 & -0.0494 & 0.48035 \tabularnewline
38 & -0.091036 & -0.7884 & 0.216474 \tabularnewline
39 & 0.002926 & 0.0253 & 0.489926 \tabularnewline
40 & -0.101801 & -0.8816 & 0.190399 \tabularnewline
41 & 0.013611 & 0.1179 & 0.453242 \tabularnewline
42 & -0.092809 & -0.8037 & 0.212041 \tabularnewline
43 & 0.023842 & 0.2065 & 0.418488 \tabularnewline
44 & -0.038859 & -0.3365 & 0.368706 \tabularnewline
45 & -0.11986 & -1.038 & 0.151297 \tabularnewline
46 & -0.001734 & -0.015 & 0.494028 \tabularnewline
47 & 0.012337 & 0.1068 & 0.4576 \tabularnewline
48 & -0.003887 & -0.0337 & 0.486617 \tabularnewline
49 & 0.075552 & 0.6543 & 0.257461 \tabularnewline
50 & -0.056617 & -0.4903 & 0.312671 \tabularnewline
51 & -0.049617 & -0.4297 & 0.334323 \tabularnewline
52 & 0.105633 & 0.9148 & 0.181612 \tabularnewline
53 & -0.0508 & -0.4399 & 0.330621 \tabularnewline
54 & -0.002364 & -0.0205 & 0.491859 \tabularnewline
55 & 0.020539 & 0.1779 & 0.42965 \tabularnewline
56 & -0.009745 & -0.0844 & 0.466485 \tabularnewline
57 & -0.007943 & -0.0688 & 0.472669 \tabularnewline
58 & -0.110675 & -0.9585 & 0.170452 \tabularnewline
59 & 0.114661 & 0.993 & 0.161953 \tabularnewline
60 & -0.054769 & -0.4743 & 0.318328 \tabularnewline
\hline
\end{tabular}
%Source: https://freestatistics.org/blog/index.php?pk=110452&T=2

[TABLE]
[ROW][C]Partial Autocorrelation Function[/C][/ROW]
[ROW][C]Time lag k[/C][C]PACF(k)[/C][C]T-STAT[/C][C]P-value[/C][/ROW]
[ROW][C]1[/C][C]-0.524706[/C][C]-4.5441[/C][C]1e-05[/C][/ROW]
[ROW][C]2[/C][C]0.479031[/C][C]4.1485[/C][C]4.4e-05[/C][/ROW]
[ROW][C]3[/C][C]-0.026526[/C][C]-0.2297[/C][C]0.409467[/C][/ROW]
[ROW][C]4[/C][C]0.435611[/C][C]3.7725[/C][C]0.00016[/C][/ROW]
[ROW][C]5[/C][C]-0.054518[/C][C]-0.4721[/C][C]0.3191[/C][/ROW]
[ROW][C]6[/C][C]0.081061[/C][C]0.702[/C][C]0.242422[/C][/ROW]
[ROW][C]7[/C][C]-0.293404[/C][C]-2.541[/C][C]0.006561[/C][/ROW]
[ROW][C]8[/C][C]0.203507[/C][C]1.7624[/C][C]0.041036[/C][/ROW]
[ROW][C]9[/C][C]0.095214[/C][C]0.8246[/C][C]0.206113[/C][/ROW]
[ROW][C]10[/C][C]-0.04041[/C][C]-0.35[/C][C]0.363675[/C][/ROW]
[ROW][C]11[/C][C]-0.020888[/C][C]-0.1809[/C][C]0.42847[/C][/ROW]
[ROW][C]12[/C][C]0.023235[/C][C]0.2012[/C][C]0.420534[/C][/ROW]
[ROW][C]13[/C][C]-0.010247[/C][C]-0.0887[/C][C]0.464763[/C][/ROW]
[ROW][C]14[/C][C]-0.036933[/C][C]-0.3198[/C][C]0.374987[/C][/ROW]
[ROW][C]15[/C][C]0.063903[/C][C]0.5534[/C][C]0.290813[/C][/ROW]
[ROW][C]16[/C][C]-0.013422[/C][C]-0.1162[/C][C]0.453887[/C][/ROW]
[ROW][C]17[/C][C]0.001974[/C][C]0.0171[/C][C]0.493204[/C][/ROW]
[ROW][C]18[/C][C]-0.103448[/C][C]-0.8959[/C][C]0.18659[/C][/ROW]
[ROW][C]19[/C][C]-0.069747[/C][C]-0.604[/C][C]0.273825[/C][/ROW]
[ROW][C]20[/C][C]-0.210045[/C][C]-1.819[/C][C]0.036448[/C][/ROW]
[ROW][C]21[/C][C]-0.003703[/C][C]-0.0321[/C][C]0.487251[/C][/ROW]
[ROW][C]22[/C][C]0.092456[/C][C]0.8007[/C][C]0.212919[/C][/ROW]
[ROW][C]23[/C][C]0.008752[/C][C]0.0758[/C][C]0.469893[/C][/ROW]
[ROW][C]24[/C][C]0.040704[/C][C]0.3525[/C][C]0.362724[/C][/ROW]
[ROW][C]25[/C][C]0.056555[/C][C]0.4898[/C][C]0.312858[/C][/ROW]
[ROW][C]26[/C][C]0.038444[/C][C]0.3329[/C][C]0.370056[/C][/ROW]
[ROW][C]27[/C][C]-0.07896[/C][C]-0.6838[/C][C]0.2481[/C][/ROW]
[ROW][C]28[/C][C]-0.052053[/C][C]-0.4508[/C][C]0.326719[/C][/ROW]
[ROW][C]29[/C][C]-0.080465[/C][C]-0.6968[/C][C]0.244027[/C][/ROW]
[ROW][C]30[/C][C]0.043281[/C][C]0.3748[/C][C]0.354426[/C][/ROW]
[ROW][C]31[/C][C]-0.060001[/C][C]-0.5196[/C][C]0.302429[/C][/ROW]
[ROW][C]32[/C][C]0.06625[/C][C]0.5737[/C][C]0.28393[/C][/ROW]
[ROW][C]33[/C][C]-0.048051[/C][C]-0.4161[/C][C]0.339251[/C][/ROW]
[ROW][C]34[/C][C]-0.057886[/C][C]-0.5013[/C][C]0.308813[/C][/ROW]
[ROW][C]35[/C][C]0.035298[/C][C]0.3057[/C][C]0.380343[/C][/ROW]
[ROW][C]36[/C][C]-0.051455[/C][C]-0.4456[/C][C]0.32858[/C][/ROW]
[ROW][C]37[/C][C]-0.005709[/C][C]-0.0494[/C][C]0.48035[/C][/ROW]
[ROW][C]38[/C][C]-0.091036[/C][C]-0.7884[/C][C]0.216474[/C][/ROW]
[ROW][C]39[/C][C]0.002926[/C][C]0.0253[/C][C]0.489926[/C][/ROW]
[ROW][C]40[/C][C]-0.101801[/C][C]-0.8816[/C][C]0.190399[/C][/ROW]
[ROW][C]41[/C][C]0.013611[/C][C]0.1179[/C][C]0.453242[/C][/ROW]
[ROW][C]42[/C][C]-0.092809[/C][C]-0.8037[/C][C]0.212041[/C][/ROW]
[ROW][C]43[/C][C]0.023842[/C][C]0.2065[/C][C]0.418488[/C][/ROW]
[ROW][C]44[/C][C]-0.038859[/C][C]-0.3365[/C][C]0.368706[/C][/ROW]
[ROW][C]45[/C][C]-0.11986[/C][C]-1.038[/C][C]0.151297[/C][/ROW]
[ROW][C]46[/C][C]-0.001734[/C][C]-0.015[/C][C]0.494028[/C][/ROW]
[ROW][C]47[/C][C]0.012337[/C][C]0.1068[/C][C]0.4576[/C][/ROW]
[ROW][C]48[/C][C]-0.003887[/C][C]-0.0337[/C][C]0.486617[/C][/ROW]
[ROW][C]49[/C][C]0.075552[/C][C]0.6543[/C][C]0.257461[/C][/ROW]
[ROW][C]50[/C][C]-0.056617[/C][C]-0.4903[/C][C]0.312671[/C][/ROW]
[ROW][C]51[/C][C]-0.049617[/C][C]-0.4297[/C][C]0.334323[/C][/ROW]
[ROW][C]52[/C][C]0.105633[/C][C]0.9148[/C][C]0.181612[/C][/ROW]
[ROW][C]53[/C][C]-0.0508[/C][C]-0.4399[/C][C]0.330621[/C][/ROW]
[ROW][C]54[/C][C]-0.002364[/C][C]-0.0205[/C][C]0.491859[/C][/ROW]
[ROW][C]55[/C][C]0.020539[/C][C]0.1779[/C][C]0.42965[/C][/ROW]
[ROW][C]56[/C][C]-0.009745[/C][C]-0.0844[/C][C]0.466485[/C][/ROW]
[ROW][C]57[/C][C]-0.007943[/C][C]-0.0688[/C][C]0.472669[/C][/ROW]
[ROW][C]58[/C][C]-0.110675[/C][C]-0.9585[/C][C]0.170452[/C][/ROW]
[ROW][C]59[/C][C]0.114661[/C][C]0.993[/C][C]0.161953[/C][/ROW]
[ROW][C]60[/C][C]-0.054769[/C][C]-0.4743[/C][C]0.318328[/C][/ROW]
[/TABLE]
Source: https://freestatistics.org/blog/index.php?pk=110452&T=2

Globally Unique Identifier (entire table): ba.freestatistics.org/blog/index.php?pk=110452&T=2

As an alternative you can also use a QR Code:  

The GUIDs for individual cells are displayed in the table below:

Partial Autocorrelation Function
Time lag kPACF(k)T-STATP-value
1-0.524706-4.54411e-05
20.4790314.14854.4e-05
3-0.026526-0.22970.409467
40.4356113.77250.00016
5-0.054518-0.47210.3191
60.0810610.7020.242422
7-0.293404-2.5410.006561
80.2035071.76240.041036
90.0952140.82460.206113
10-0.04041-0.350.363675
11-0.020888-0.18090.42847
120.0232350.20120.420534
13-0.010247-0.08870.464763
14-0.036933-0.31980.374987
150.0639030.55340.290813
16-0.013422-0.11620.453887
170.0019740.01710.493204
18-0.103448-0.89590.18659
19-0.069747-0.6040.273825
20-0.210045-1.8190.036448
21-0.003703-0.03210.487251
220.0924560.80070.212919
230.0087520.07580.469893
240.0407040.35250.362724
250.0565550.48980.312858
260.0384440.33290.370056
27-0.07896-0.68380.2481
28-0.052053-0.45080.326719
29-0.080465-0.69680.244027
300.0432810.37480.354426
31-0.060001-0.51960.302429
320.066250.57370.28393
33-0.048051-0.41610.339251
34-0.057886-0.50130.308813
350.0352980.30570.380343
36-0.051455-0.44560.32858
37-0.005709-0.04940.48035
38-0.091036-0.78840.216474
390.0029260.02530.489926
40-0.101801-0.88160.190399
410.0136110.11790.453242
42-0.092809-0.80370.212041
430.0238420.20650.418488
44-0.038859-0.33650.368706
45-0.11986-1.0380.151297
46-0.001734-0.0150.494028
470.0123370.10680.4576
48-0.003887-0.03370.486617
490.0755520.65430.257461
50-0.056617-0.49030.312671
51-0.049617-0.42970.334323
520.1056330.91480.181612
53-0.0508-0.43990.330621
54-0.002364-0.02050.491859
550.0205390.17790.42965
56-0.009745-0.08440.466485
57-0.007943-0.06880.472669
58-0.110675-0.95850.170452
590.1146610.9930.161953
60-0.054769-0.47430.318328


Parameters (Session):
par1 = 60 ; par2 = 1 ; par3 = 1 ; par4 = 0 ; par5 = 4 ; par6 = White Noise ; par7 = 0.95 ;
Parameters (R input):
par1 = 60 ; par2 = 1 ; par3 = 1 ; par4 = 0 ; par5 = 4 ; par6 = White Noise ; par7 = 0.95 ; par8 = ;
R code (references can be found in the software module):
if (par1 == 'Default') {
par1 = 10*log10(length(x))
} else {
par1 <- as.numeric(par1)
}
par2 <- as.numeric(par2)
par3 <- as.numeric(par3)
par4 <- as.numeric(par4)
par5 <- as.numeric(par5)
if (par6 == 'White Noise') par6 <- 'white' else par6 <- 'ma'
par7 <- as.numeric(par7)
if (par8 != '') par8 <- as.numeric(par8)
ox <- x
if (par8 == '') {
if (par2 == 0) {
x <- log(x)
} else {
x <- (x ^ par2 - 1) / par2
}
} else {
x <- log(x,base=par8)
}
if (par3 > 0) x <- diff(x,lag=1,difference=par3)
if (par4 > 0) x <- diff(x,lag=par5,difference=par4)
bitmap(file='picts.png')
op <- par(mfrow=c(2,1))
plot(ox,type='l',main='Original Time Series',xlab='time',ylab='value')
if (par8=='') {
mytitle <- paste('Working Time Series (lambda=',par2,', d=',par3,', D=',par4,')',sep='')
mysub <- paste('(lambda=',par2,', d=',par3,', D=',par4,', CI=', par7, ', CI type=',par6,')',sep='')
} else {
mytitle <- paste('Working Time Series (base=',par8,', d=',par3,', D=',par4,')',sep='')
mysub <- paste('(base=',par8,', d=',par3,', D=',par4,', CI=', par7, ', CI type=',par6,')',sep='')
}
plot(x,type='l', main=mytitle,xlab='time',ylab='value')
par(op)
dev.off()
bitmap(file='pic1.png')
racf <- acf(x, par1, main='Autocorrelation', xlab='time lag', ylab='ACF', ci.type=par6, ci=par7, sub=mysub)
dev.off()
bitmap(file='pic2.png')
rpacf <- pacf(x,par1,main='Partial Autocorrelation',xlab='lags',ylab='PACF',sub=mysub)
dev.off()
(myacf <- c(racf$acf))
(mypacf <- c(rpacf$acf))
lengthx <- length(x)
sqrtn <- sqrt(lengthx)
load(file='createtable')
a<-table.start()
a<-table.row.start(a)
a<-table.element(a,'Autocorrelation Function',4,TRUE)
a<-table.row.end(a)
a<-table.row.start(a)
a<-table.element(a,'Time lag k',header=TRUE)
a<-table.element(a,hyperlink('basics.htm','ACF(k)','click here for more information about the Autocorrelation Function'),header=TRUE)
a<-table.element(a,'T-STAT',header=TRUE)
a<-table.element(a,'P-value',header=TRUE)
a<-table.row.end(a)
for (i in 2:(par1+1)) {
a<-table.row.start(a)
a<-table.element(a,i-1,header=TRUE)
a<-table.element(a,round(myacf[i],6))
mytstat <- myacf[i]*sqrtn
a<-table.element(a,round(mytstat,4))
a<-table.element(a,round(1-pt(abs(mytstat),lengthx),6))
a<-table.row.end(a)
}
a<-table.end(a)
table.save(a,file='mytable.tab')
a<-table.start()
a<-table.row.start(a)
a<-table.element(a,'Partial Autocorrelation Function',4,TRUE)
a<-table.row.end(a)
a<-table.row.start(a)
a<-table.element(a,'Time lag k',header=TRUE)
a<-table.element(a,hyperlink('basics.htm','PACF(k)','click here for more information about the Partial Autocorrelation Function'),header=TRUE)
a<-table.element(a,'T-STAT',header=TRUE)
a<-table.element(a,'P-value',header=TRUE)
a<-table.row.end(a)
for (i in 1:par1) {
a<-table.row.start(a)
a<-table.element(a,i,header=TRUE)
a<-table.element(a,round(mypacf[i],6))
mytstat <- mypacf[i]*sqrtn
a<-table.element(a,round(mytstat,4))
a<-table.element(a,round(1-pt(abs(mytstat),lengthx),6))
a<-table.row.end(a)
}
a<-table.end(a)
table.save(a,file='mytable1.tab')