Free Statistics
of Irreproducible Research!
Description of Statistical Computation | |||||||||||||||||||||||||||||||||||||||||
|---|---|---|---|---|---|---|---|---|---|---|---|---|---|---|---|---|---|---|---|---|---|---|---|---|---|---|---|---|---|---|---|---|---|---|---|---|---|---|---|---|---|
| Author's title | |||||||||||||||||||||||||||||||||||||||||
| Author | *The author of this computation has been verified* | ||||||||||||||||||||||||||||||||||||||||
| R Software Module | rwasp_univariatedataseries.wasp | ||||||||||||||||||||||||||||||||||||||||
| Title produced by software | Univariate Data Series | ||||||||||||||||||||||||||||||||||||||||
| Date of computation | Wed, 15 Dec 2010 14:40:01 +0000 | ||||||||||||||||||||||||||||||||||||||||
| Cite this page as follows | Statistical Computations at FreeStatistics.org, Office for Research Development and Education, URL https://freestatistics.org/blog/index.php?v=date/2010/Dec/15/t12924238901j3l19n28d4iwn9.htm/, Retrieved Fri, 03 May 2024 04:13:57 +0000 | ||||||||||||||||||||||||||||||||||||||||
| Statistical Computations at FreeStatistics.org, Office for Research Development and Education, URL https://freestatistics.org/blog/index.php?pk=110426, Retrieved Fri, 03 May 2024 04:13:57 +0000 | |||||||||||||||||||||||||||||||||||||||||
| QR Codes: | |||||||||||||||||||||||||||||||||||||||||
|
| |||||||||||||||||||||||||||||||||||||||||
| Original text written by user: | |||||||||||||||||||||||||||||||||||||||||
| IsPrivate? | No (this computation is public) | ||||||||||||||||||||||||||||||||||||||||
| User-defined keywords | |||||||||||||||||||||||||||||||||||||||||
| Estimated Impact | 111 | ||||||||||||||||||||||||||||||||||||||||
Tree of Dependent Computations | |||||||||||||||||||||||||||||||||||||||||
| Family? (F = Feedback message, R = changed R code, M = changed R Module, P = changed Parameters, D = changed Data) | |||||||||||||||||||||||||||||||||||||||||
| - [Univariate Data Series] [beschrijving] [2009-12-11 09:25:25] [517ac0676608e46c618c738721d88e41] - R PD [Univariate Data Series] [] [2010-12-10 14:31:22] [22937c5b58c14f6c22964f32d64ff823] - P [Univariate Data Series] [] [2010-12-10 14:35:53] [22937c5b58c14f6c22964f32d64ff823] - P [Univariate Data Series] [] [2010-12-10 14:41:14] [22937c5b58c14f6c22964f32d64ff823] - R PD [Univariate Data Series] [Paper Data Serie ...] [2010-12-15 14:34:53] [945bcebba5e7ac34a41d6888338a1ba9] - P [Univariate Data Series] [Paper Data Serie ...] [2010-12-15 14:40:01] [514029464b0621595fe21c9fa38c7009] [Current] | |||||||||||||||||||||||||||||||||||||||||
| Feedback Forum | |||||||||||||||||||||||||||||||||||||||||
Post a new message | |||||||||||||||||||||||||||||||||||||||||
Dataset | |||||||||||||||||||||||||||||||||||||||||
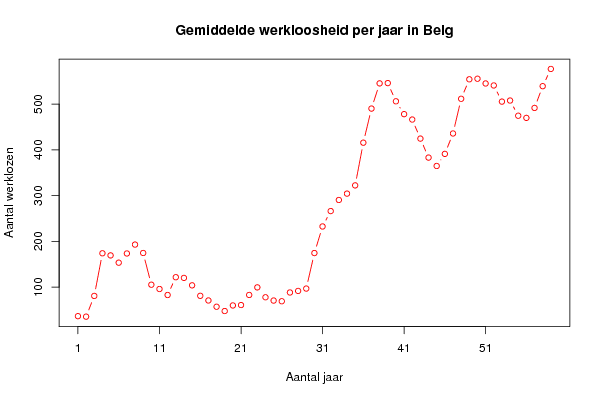
| Dataseries X: | |||||||||||||||||||||||||||||||||||||||||
36.700 35.600 80.900 174.000 169.422 153.452 173.570 193.036 174.652 105.367 95.963 82.896 121.747 120.196 103.983 81.103 70.944 57.248 47.830 60.095 60.931 82.955 99.559 77.911 70.753 69.287 88.426 91.756 96.933 174.484 232.595 266.197 290.435 304.296 322.310 415.555 490.042 545.109 545.720 505.944 477.930 466.106 424.476 383.018 364.696 391.116 435.721 511.435 553.997 555.252 544.897 540.562 505.282 507.626 474.427 469.740 491.480 538.974 576.612 | |||||||||||||||||||||||||||||||||||||||||
Tables (Output of Computation) | |||||||||||||||||||||||||||||||||||||||||
| |||||||||||||||||||||||||||||||||||||||||
Figures (Output of Computation) | |||||||||||||||||||||||||||||||||||||||||
Input Parameters & R Code | |||||||||||||||||||||||||||||||||||||||||
| Parameters (Session): | |||||||||||||||||||||||||||||||||||||||||
| par1 = Gemiddelde werkloosheid per jaar in België ; par2 = Algemene Directie Statistiek en Economische Informatie van de FOD Economie, K.M.O., Middenstand en Energie ; par4 = No season ; | |||||||||||||||||||||||||||||||||||||||||
| Parameters (R input): | |||||||||||||||||||||||||||||||||||||||||
| par1 = Gemiddelde werkloosheid per jaar in België ; par2 = Algemene Directie Statistiek en Economische Informatie van de FOD Economie, K.M.O., Middenstand en Energie ; par3 = ; par4 = No season ; | |||||||||||||||||||||||||||||||||||||||||
| R code (references can be found in the software module): | |||||||||||||||||||||||||||||||||||||||||
if (par4 != 'No season') { | |||||||||||||||||||||||||||||||||||||||||