| Multiple Linear Regression - Estimated Regression Equation |
| SlowWaveSleep[t] = + 11.6991099816800 -1.81485718959219BodyWeightInKg[t] -0.806217858424301OverallDangerIndex[t] + e[t] |
| Multiple Linear Regression - Ordinary Least Squares | |||||
| Variable | Parameter | S.D. | T-STAT H0: parameter = 0 | 2-tail p-value | 1-tail p-value |
| (Intercept) | 11.6991099816800 | 0.941095 | 12.4314 | 0 | 0 |
| BodyWeightInKg | -1.81485718959219 | 0.37295 | -4.8662 | 2.3e-05 | 1.1e-05 |
| OverallDangerIndex | -0.806217858424301 | 0.336956 | -2.3927 | 0.022068 | 0.011034 |
| Multiple Linear Regression - Regression Statistics | |
| Multiple R | 0.757704293033363 |
| R-squared | 0.574115795681188 |
| Adjusted R-squared | 0.55045556210792 |
| F-TEST (value) | 24.265009637515 |
| F-TEST (DF numerator) | 2 |
| F-TEST (DF denominator) | 36 |
| p-value | 2.12445526059923e-07 |
| Multiple Linear Regression - Residual Statistics | |
| Residual Standard Deviation | 2.66067366510955 |
| Sum Squared Residuals | 254.850636679470 |
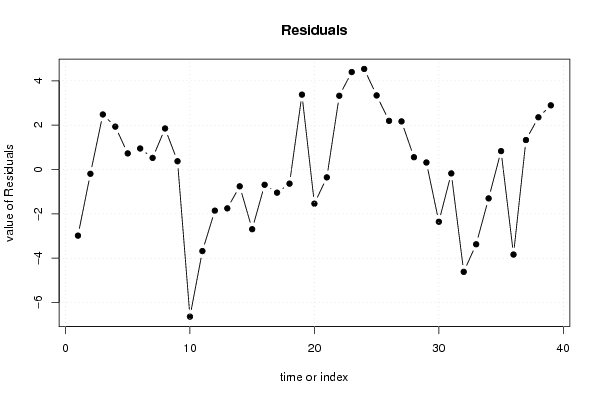
| Multiple Linear Regression - Actuals, Interpolation, and Residuals | |||
| Time or Index | Actuals | Interpolation Forecast | Residuals Prediction Error |
| 1 | 6.3 | 9.28045640640708 | -2.98045640640708 |
| 2 | 2.1 | 2.2927805145161 | -0.192780514516102 |
| 3 | 9.1 | 6.61718592873256 | 2.48281407126743 |
| 4 | 15.8 | 13.8661182112489 | 1.93388178875114 |
| 5 | 5.2 | 4.47407551925884 | 0.725924480741159 |
| 6 | 10.9 | 9.95187052188023 | 0.948129478119774 |
| 7 | 8.3 | 7.77616527728143 | 0.523834722718573 |
| 8 | 11 | 9.14865762820712 | 1.85134237179288 |
| 9 | 3.2 | 2.82697987918079 | 0.373020120819207 |
| 10 | 6.3 | 12.9344975701155 | -6.6344975701155 |
| 11 | 6.6 | 10.2774702011732 | -3.67747020117320 |
| 12 | 9.5 | 11.3552049946406 | -1.85520499464062 |
| 13 | 3.3 | 5.05126885074498 | -1.75126885074498 |
| 14 | 11 | 11.7578310621516 | -0.757831062151645 |
| 15 | 4.7 | 7.39127036451272 | -2.69127036451272 |
| 16 | 10.4 | 11.0874734129402 | -0.687473412940215 |
| 17 | 7.4 | 8.44333153004401 | -1.04333153004401 |
| 18 | 2.1 | 2.73734408258684 | -0.637344082586836 |
| 19 | 17.9 | 14.5226065024400 | 3.37739349755996 |
| 20 | 6.1 | 7.63996024520253 | -1.53996024520253 |
| 21 | 11.9 | 12.2536824944003 | -0.353682494400257 |
| 22 | 13.8 | 10.4746582839142 | 3.32534171608585 |
| 23 | 14.3 | 9.90548277211425 | 4.39451722788575 |
| 24 | 15.2 | 10.6651781425858 | 4.53482185741422 |
| 25 | 10 | 6.65938135839058 | 3.34061864160942 |
| 26 | 11.9 | 9.70642538646802 | 2.19357461353199 |
| 27 | 6.5 | 4.33037512698693 | 2.16962487301307 |
| 28 | 7.5 | 6.94581641953215 | 0.554183580467847 |
| 29 | 10.6 | 10.2837820551012 | 0.316217944898787 |
| 30 | 7.4 | 9.7552488939598 | -2.35524889395981 |
| 31 | 8.4 | 8.57578750592398 | -0.175787505923979 |
| 32 | 5.7 | 10.3134225220990 | -4.61342252209902 |
| 33 | 4.9 | 8.27085135183694 | -3.37085135183694 |
| 34 | 3.2 | 4.50238344232472 | -1.30238344232472 |
| 35 | 11 | 10.1697221298271 | 0.830277870172892 |
| 36 | 4.9 | 8.73412994662413 | -3.83412994662413 |
| 37 | 13.2 | 11.8706244364848 | 1.3293755635152 |
| 38 | 9.7 | 7.34501625604661 | 2.35498374395338 |
| 39 | 12.8 | 9.90548277211425 | 2.89451722788575 |
| Goldfeld-Quandt test for Heteroskedasticity | |||
| p-values | Alternative Hypothesis | ||
| breakpoint index | greater | 2-sided | less |
| 6 | 0.487416969537937 | 0.974833939075873 | 0.512583030462063 |
| 7 | 0.314521626076470 | 0.629043252152939 | 0.68547837392353 |
| 8 | 0.211851180968311 | 0.423702361936623 | 0.788148819031689 |
| 9 | 0.118643181664675 | 0.237286363329351 | 0.881356818335325 |
| 10 | 0.686698128984577 | 0.626603742030847 | 0.313301871015423 |
| 11 | 0.715221188049779 | 0.569557623900442 | 0.284778811950221 |
| 12 | 0.641025546886481 | 0.717948906227038 | 0.358974453113519 |
| 13 | 0.585206819205923 | 0.829586361588154 | 0.414793180794077 |
| 14 | 0.49310961174901 | 0.98621922349802 | 0.50689038825099 |
| 15 | 0.465954108036251 | 0.931908216072502 | 0.534045891963749 |
| 16 | 0.372758837365506 | 0.745517674731012 | 0.627241162634494 |
| 17 | 0.291491973840141 | 0.582983947680283 | 0.708508026159859 |
| 18 | 0.216744272500321 | 0.433488545000642 | 0.783255727499679 |
| 19 | 0.307737966771465 | 0.615475933542929 | 0.692262033228535 |
| 20 | 0.263694618979691 | 0.527389237959383 | 0.736305381020309 |
| 21 | 0.188260018490979 | 0.376520036981958 | 0.811739981509021 |
| 22 | 0.227589875616900 | 0.455179751233801 | 0.7724101243831 |
| 23 | 0.339693023874296 | 0.679386047748592 | 0.660306976125704 |
| 24 | 0.503527141926891 | 0.992945716146218 | 0.496472858073109 |
| 25 | 0.539432155061734 | 0.921135689876532 | 0.460567844938266 |
| 26 | 0.512944116852004 | 0.974111766295991 | 0.487055883147996 |
| 27 | 0.490764569187356 | 0.981529138374712 | 0.509235430812644 |
| 28 | 0.390812285488755 | 0.78162457097751 | 0.609187714511245 |
| 29 | 0.288807116117745 | 0.57761423223549 | 0.711192883882255 |
| 30 | 0.247480958572481 | 0.494961917144962 | 0.752519041427519 |
| 31 | 0.155512474066876 | 0.311024948133753 | 0.844487525933124 |
| 32 | 0.293988156453594 | 0.587976312907188 | 0.706011843546406 |
| 33 | 0.333817946591797 | 0.667635893183594 | 0.666182053408203 |
| Meta Analysis of Goldfeld-Quandt test for Heteroskedasticity | |||
| Description | # significant tests | % significant tests | OK/NOK |
| 1% type I error level | 0 | 0 | OK |
| 5% type I error level | 0 | 0 | OK |
| 10% type I error level | 0 | 0 | OK |