| Multiple Linear Regression - Estimated Regression Equation |
| olie[t] = -0.0541370250440066 + 0.879652544184293benzine[t] + e[t] |
| Multiple Linear Regression - Ordinary Least Squares | |||||
| Variable | Parameter | S.D. | T-STAT H0: parameter = 0 | 2-tail p-value | 1-tail p-value |
| (Intercept) | -0.0541370250440066 | 0.02054 | -2.6357 | 0.010798 | 0.005399 |
| benzine | 0.879652544184293 | 0.033264 | 26.4442 | 0 | 0 |
| Multiple Linear Regression - Regression Statistics | |
| Multiple R | 0.961578230829939 |
| R-squared | 0.924632694006035 |
| Adjusted R-squared | 0.923310460567544 |
| F-TEST (value) | 699.296105430171 |
| F-TEST (DF numerator) | 1 |
| F-TEST (DF denominator) | 57 |
| p-value | 0 |
| Multiple Linear Regression - Residual Statistics | |
| Residual Standard Deviation | 0.0344242198136767 |
| Sum Squared Residuals | 0.0675465338574791 |
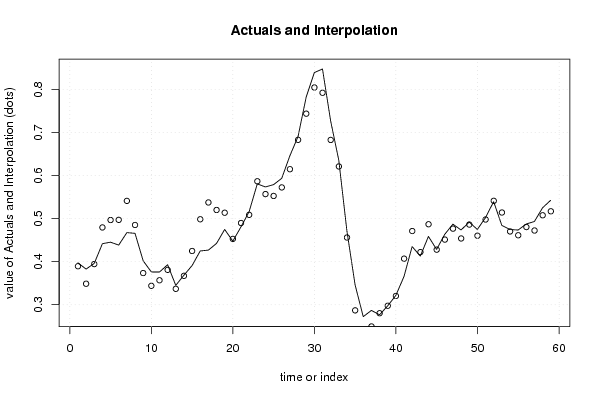
| Multiple Linear Regression - Actuals, Interpolation, and Residuals | |||
| Time or Index | Actuals | Interpolation Forecast | Residuals Prediction Error |
| 1 | 0.397232704 | 0.389391355384552 | 0.00784134861544753 |
| 2 | 0.382767296 | 0.348717227184328 | 0.034050068815672 |
| 3 | 0.396037736 | 0.39441807003192 | 0.00161966596808033 |
| 4 | 0.441761006 | 0.47947975501737 | -0.0377187490173697 |
| 5 | 0.445220126 | 0.496710973142141 | -0.051490847142141 |
| 6 | 0.438490566 | 0.497080806340945 | -0.0585902403409449 |
| 7 | 0.467484277 | 0.541151363618476 | -0.0736670866184763 |
| 8 | 0.465786164 | 0.485193304130542 | -0.0194071401305421 |
| 9 | 0.402075472 | 0.3735639941074 | 0.0285114778926001 |
| 10 | 0.376163522 | 0.343932036097059 | 0.0322314859029412 |
| 11 | 0.37591195 | 0.356793181725992 | 0.0191187682740080 |
| 12 | 0.392955975 | 0.380960662481742 | 0.0119953125182585 |
| 13 | 0.34490566 | 0.336927844057661 | 0.00797781594233914 |
| 14 | 0.368553459 | 0.367095683758962 | 0.00145777524103854 |
| 15 | 0.390880503 | 0.424797243618003 | -0.0339167406180029 |
| 16 | 0.424842767 | 0.498462020932077 | -0.0736192539320773 |
| 17 | 0.426855346 | 0.537498315263759 | -0.110642969263759 |
| 18 | 0.442327044 | 0.520018025280407 | -0.0776909812804069 |
| 19 | 0.474842767 | 0.513617643460735 | -0.0387748764607355 |
| 20 | 0.447610063 | 0.452836654032082 | -0.00522659103208164 |
| 21 | 0.480754717 | 0.489782257050339 | -0.00902754005033924 |
| 22 | 0.516037736 | 0.508749428127389 | 0.00728830787261142 |
| 23 | 0.580628931 | 0.586693706272394 | -0.00606477527239415 |
| 24 | 0.573522013 | 0.556918342906037 | 0.0166036700939627 |
| 25 | 0.578867925 | 0.552623747237448 | 0.0262441777625519 |
| 26 | 0.593584906 | 0.57239096494239 | 0.0211939410576094 |
| 27 | 0.645974843 | 0.614695378712675 | 0.0312794642873251 |
| 28 | 0.690503145 | 0.68285039337953 | 0.00765275162046947 |
| 29 | 0.782201258 | 0.743608739672045 | 0.0385925183279554 |
| 30 | 0.839056604 | 0.804419919655667 | 0.0346366843443327 |
| 31 | 0.847484277 | 0.79214748852915 | 0.0553367884708501 |
| 32 | 0.726855346 | 0.682654155212059 | 0.0442011907879414 |
| 33 | 0.635534591 | 0.621118404548139 | 0.0144161864518613 |
| 34 | 0.470943396 | 0.456067035496886 | 0.0148763605031137 |
| 35 | 0.346163522 | 0.286939952080656 | 0.0592235699193437 |
| 36 | 0.272327044 | 0.237269060490999 | 0.0350579835090006 |
| 37 | 0.286792453 | 0.249564134753657 | 0.0372283182463432 |
| 38 | 0.27672956 | 0.280282950983575 | -0.00355339098357503 |
| 39 | 0.297421384 | 0.297582097637113 | -0.000160713637113282 |
| 40 | 0.321698113 | 0.320368363801731 | 0.00132974919826951 |
| 41 | 0.365597484 | 0.406962216153158 | -0.0413647321531577 |
| 42 | 0.435220126 | 0.471116991522979 | -0.0358968655229794 |
| 43 | 0.412893082 | 0.42218576633093 | -0.0092926843309303 |
| 44 | 0.458679245 | 0.486883970810540 | -0.0282047258105404 |
| 45 | 0.428427673 | 0.427846482632646 | 0.000581190367353649 |
| 46 | 0.463522013 | 0.451259201273477 | 0.0122628117265227 |
| 47 | 0.487169811 | 0.476679587861307 | 0.0104902231386931 |
| 48 | 0.473584906 | 0.453855582843239 | 0.0197293231567609 |
| 49 | 0.491886792 | 0.486144304412933 | 0.00574248758706747 |
| 50 | 0.474842767 | 0.460263512961392 | 0.0145792540386078 |
| 51 | 0.502327044 | 0.497865759010833 | 0.00446128498916738 |
| 52 | 0.539371069 | 0.54126457753987 | -0.00189350853987035 |
| 53 | 0.484402516 | 0.514115786298244 | -0.0297132702982443 |
| 54 | 0.474654088 | 0.470188634376729 | 0.00446545362327133 |
| 55 | 0.473522013 | 0.461305084908690 | 0.0122169280913104 |
| 56 | 0.48754717 | 0.480355279352164 | 0.00719189064783578 |
| 57 | 0.493333333 | 0.47230196794664 | 0.0210313650533602 |
| 58 | 0.525157233 | 0.507700308761262 | 0.0174569242387378 |
| 59 | 0.542704403 | 0.516961238846934 | 0.0257431641530657 |
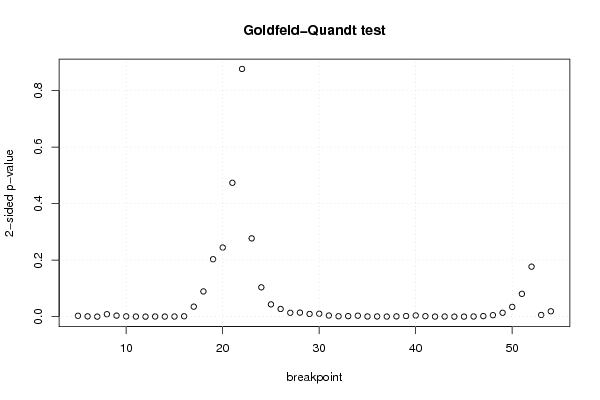
| Goldfeld-Quandt test for Heteroskedasticity | |||
| p-values | Alternative Hypothesis | ||
| breakpoint index | greater | 2-sided | less |
| 5 | 0.00159452722528739 | 0.00318905445057478 | 0.998405472774713 |
| 6 | 0.000642352009735451 | 0.00128470401947090 | 0.999357647990265 |
| 7 | 0.000139159194790768 | 0.000278318389581536 | 0.99986084080521 |
| 8 | 0.00439265244093757 | 0.00878530488187514 | 0.995607347559062 |
| 9 | 0.00186042070749849 | 0.00372084141499699 | 0.998139579292502 |
| 10 | 0.000607787235261097 | 0.00121557447052219 | 0.999392212764739 |
| 11 | 0.000248597573499634 | 0.000497195146999269 | 0.9997514024265 |
| 12 | 6.82521151268311e-05 | 0.000136504230253662 | 0.999931747884873 |
| 13 | 0.00035007236655416 | 0.00070014473310832 | 0.999649927633446 |
| 14 | 0.000225900674042520 | 0.000451801348085041 | 0.999774099325957 |
| 15 | 0.000294599651775336 | 0.000589199303550672 | 0.999705400348225 |
| 16 | 0.000742853132310907 | 0.00148570626462181 | 0.99925714686769 |
| 17 | 0.0177375654125673 | 0.0354751308251345 | 0.982262434587433 |
| 18 | 0.0446724020603833 | 0.0893448041207665 | 0.955327597939617 |
| 19 | 0.101653526993022 | 0.203307053986044 | 0.898346473006978 |
| 20 | 0.122376620212941 | 0.244753240425881 | 0.87762337978706 |
| 21 | 0.236896919421017 | 0.473793838842035 | 0.763103080578983 |
| 22 | 0.561685534354998 | 0.876628931290005 | 0.438314465645002 |
| 23 | 0.861414818788528 | 0.277170362422945 | 0.138585181211472 |
| 24 | 0.948033856997288 | 0.103932286005423 | 0.0519661430027116 |
| 25 | 0.97822171292094 | 0.0435565741581187 | 0.0217782870790594 |
| 26 | 0.986331937410138 | 0.0273361251797244 | 0.0136680625898622 |
| 27 | 0.993104464175976 | 0.0137910716480488 | 0.00689553582402439 |
| 28 | 0.992794237873755 | 0.0144115242524899 | 0.00720576212624494 |
| 29 | 0.995192226175485 | 0.0096155476490301 | 0.00480777382451505 |
| 30 | 0.99480290327592 | 0.0103941934481583 | 0.00519709672407916 |
| 31 | 0.997949089383925 | 0.00410182123215089 | 0.00205091061607544 |
| 32 | 0.999242002578003 | 0.00151599484399343 | 0.000757997421996713 |
| 33 | 0.998970677077536 | 0.00205864584492851 | 0.00102932292246426 |
| 34 | 0.998273335267447 | 0.00345332946510543 | 0.00172666473255271 |
| 35 | 0.999579288705709 | 0.000841422588582937 | 0.000420711294291468 |
| 36 | 0.999547137980543 | 0.000905724038913794 | 0.000452862019456897 |
| 37 | 0.999749975531723 | 0.00050004893655356 | 0.00025002446827678 |
| 38 | 0.999437356497241 | 0.00112528700551772 | 0.000562643502758862 |
| 39 | 0.998820539627554 | 0.00235892074489280 | 0.00117946037244640 |
| 40 | 0.997854732990786 | 0.00429053401842757 | 0.00214526700921378 |
| 41 | 0.99912868886791 | 0.00174262226418179 | 0.000871311132090893 |
| 42 | 0.999775117237146 | 0.000449765525707804 | 0.000224882762853902 |
| 43 | 0.99968517099125 | 0.000629658017498337 | 0.000314829008749169 |
| 44 | 0.99992709949412 | 0.000145801011761555 | 7.29005058807774e-05 |
| 45 | 0.9998834327027 | 0.000233134594599897 | 0.000116567297299948 |
| 46 | 0.999654089032257 | 0.000691821935485234 | 0.000345910967742617 |
| 47 | 0.99898701080627 | 0.00202597838746045 | 0.00101298919373023 |
| 48 | 0.99735289504334 | 0.00529420991332081 | 0.00264710495666040 |
| 49 | 0.993039191486698 | 0.0139216170266035 | 0.00696080851330173 |
| 50 | 0.98272150974519 | 0.0345569805096199 | 0.0172784902548099 |
| 51 | 0.959549234357649 | 0.0809015312847026 | 0.0404507656423513 |
| 52 | 0.911542296102803 | 0.176915407794394 | 0.088457703897197 |
| 53 | 0.99698110308385 | 0.00603779383229997 | 0.00301889691614998 |
| 54 | 0.990426636265006 | 0.0191467274699877 | 0.00957336373499386 |
| Meta Analysis of Goldfeld-Quandt test for Heteroskedasticity | |||
| Description | # significant tests | % significant tests | OK/NOK |
| 1% type I error level | 32 | 0.64 | NOK |
| 5% type I error level | 41 | 0.82 | NOK |
| 10% type I error level | 43 | 0.86 | NOK |