Free Statistics

of Irreproducible Research!

Author's title

Author*The author of this computation has been verified*
R Software Modulerwasp_multipleregression.wasp
Title produced by softwareMultiple Regression
Date of computationTue, 14 Dec 2010 23:42:00 +0000
Cite this page as followsStatistical Computations at FreeStatistics.org, Office for Research Development and Education, URL https://freestatistics.org/blog/index.php?v=date/2010/Dec/15/t1292370318rezcvqndls2sk1w.htm/, Retrieved Fri, 03 May 2024 06:18:05 +0000
Statistical Computations at FreeStatistics.org, Office for Research Development and Education, URL https://freestatistics.org/blog/index.php?pk=110280, Retrieved Fri, 03 May 2024 06:18:05 +0000
QR Codes:

Original text written by user:
IsPrivate?No (this computation is public)
User-defined keywords
Estimated Impact178
Family? (F = Feedback message, R = changed R code, M = changed R Module, P = changed Parameters, D = changed Data)
-     [Multiple Regression] [] [2010-12-05 18:56:24] [b98453cac15ba1066b407e146608df68]
-   PD    [Multiple Regression] [ws10 multiple reg...] [2010-12-14 23:42:00] [2e49bff66bb3e1f5d7fa8957e12fbb12] [Current]
-   P       [Multiple Regression] [Verbetering WS10] [2010-12-20 08:24:20] [c2a9e95daa10045f9fd6252038bcb219]
Feedback Forum

Post a new message
Dataseries X:
0.504208603	0.397232704
0.457969746	0.382767296
0.509923035	0.396037736
0.606622221	0.441761006
0.626210885	0.445220126
0.626631316	0.438490566
0.676731276	0.467484277
0.613117455	0.465786164
0.486215861	0.402075472
0.452529881	0.376163522
0.467150592	0.37591195
0.494624486	0.392955975
0.444567428	0.34490566
0.478862605	0.368553459
0.544458459	0.390880503
0.628201498	0.424842767
0.672578445	0.426855346
0.652706633	0.442327044
0.645430599	0.474842767
0.576334011	0.447610063
0.618334234	0.480754717
0.639896351	0.516037736
0.72850438	0.580628931
0.694655375	0.573522013
0.689773225	0.578867925
0.712244845	0.593584906
0.760337031	0.645974843
0.837816503	0.690503145
0.90688735	0.782201258
0.976018259	0.839056604
0.962066806	0.847484277
0.837593417	0.726855346
0.767638807	0.635534591
0.580006349	0.470943396
0.387740568	0.346163522
0.331274078	0.272327044
0.345251272	0.286792453
0.380172806	0.27672956
0.399838692	0.297421384
0.425742404	0.321698113
0.524183377	0.365597484
0.597115327	0.435220126
0.541489699	0.412893082
0.615039426	0.458679245
0.547924872	0.428427673
0.574540743	0.463522013
0.603438956	0.487169811
0.577492342	0.473584906
0.614198564	0.491886792
0.584776957	0.474842767
0.62752366	0.502327044
0.676859979	0.539371069
0.645996894	0.484402516
0.596059959	0.474654088
0.585961029	0.473522013
0.607617528	0.48754717
0.598462423	0.493333333
0.638703699	0.525157233
0.64923164	0.542704403


Summary of computational transaction
Raw Inputview raw input (R code)
Raw Outputview raw output of R engine
Computing time7 seconds
R Server'Gwilym Jenkins' @ 72.249.127.135

\begin{tabular}{lllllllll}
\hline
Summary of computational transaction \tabularnewline
Raw Input & view raw input (R code)  \tabularnewline
Raw Output & view raw output of R engine  \tabularnewline
Computing time & 7 seconds \tabularnewline
R Server & 'Gwilym Jenkins' @ 72.249.127.135 \tabularnewline
\hline
\end{tabular}
%Source: https://freestatistics.org/blog/index.php?pk=110280&T=0

[TABLE]
[ROW][C]Summary of computational transaction[/C][/ROW]
[ROW][C]Raw Input[/C][C]view raw input (R code) [/C][/ROW]
[ROW][C]Raw Output[/C][C]view raw output of R engine [/C][/ROW]
[ROW][C]Computing time[/C][C]7 seconds[/C][/ROW]
[ROW][C]R Server[/C][C]'Gwilym Jenkins' @ 72.249.127.135[/C][/ROW]
[/TABLE]
Source: https://freestatistics.org/blog/index.php?pk=110280&T=0

Globally Unique Identifier (entire table): ba.freestatistics.org/blog/index.php?pk=110280&T=0

As an alternative you can also use a QR Code:  

The GUIDs for individual cells are displayed in the table below:

Summary of computational transaction
Raw Inputview raw input (R code)
Raw Outputview raw output of R engine
Computing time7 seconds
R Server'Gwilym Jenkins' @ 72.249.127.135


Multiple Linear Regression - Estimated Regression Equation
olie[t] = -0.0541370250440066 + 0.879652544184293benzine[t] + e[t]

\begin{tabular}{lllllllll}
\hline
Multiple Linear Regression - Estimated Regression Equation \tabularnewline
olie[t] =  -0.0541370250440066 +  0.879652544184293benzine[t]  + e[t] \tabularnewline
\hline
\end{tabular}
%Source: https://freestatistics.org/blog/index.php?pk=110280&T=1

[TABLE]
[ROW][C]Multiple Linear Regression - Estimated Regression Equation[/C][/ROW]
[ROW][C]olie[t] =  -0.0541370250440066 +  0.879652544184293benzine[t]  + e[t][/C][/ROW]
[/TABLE]
Source: https://freestatistics.org/blog/index.php?pk=110280&T=1

Globally Unique Identifier (entire table): ba.freestatistics.org/blog/index.php?pk=110280&T=1

As an alternative you can also use a QR Code:  

The GUIDs for individual cells are displayed in the table below:

Multiple Linear Regression - Estimated Regression Equation
olie[t] = -0.0541370250440066 + 0.879652544184293benzine[t] + e[t]


Multiple Linear Regression - Ordinary Least Squares
VariableParameterS.D.T-STATH0: parameter = 02-tail p-value1-tail p-value
(Intercept)-0.05413702504400660.02054-2.63570.0107980.005399
benzine0.8796525441842930.03326426.444200

\begin{tabular}{lllllllll}
\hline
Multiple Linear Regression - Ordinary Least Squares \tabularnewline
Variable & Parameter & S.D. & T-STATH0: parameter = 0 & 2-tail p-value & 1-tail p-value \tabularnewline
(Intercept) & -0.0541370250440066 & 0.02054 & -2.6357 & 0.010798 & 0.005399 \tabularnewline
benzine & 0.879652544184293 & 0.033264 & 26.4442 & 0 & 0 \tabularnewline
\hline
\end{tabular}
%Source: https://freestatistics.org/blog/index.php?pk=110280&T=2

[TABLE]
[ROW][C]Multiple Linear Regression - Ordinary Least Squares[/C][/ROW]
[ROW][C]Variable[/C][C]Parameter[/C][C]S.D.[/C][C]T-STATH0: parameter = 0[/C][C]2-tail p-value[/C][C]1-tail p-value[/C][/ROW]
[ROW][C](Intercept)[/C][C]-0.0541370250440066[/C][C]0.02054[/C][C]-2.6357[/C][C]0.010798[/C][C]0.005399[/C][/ROW]
[ROW][C]benzine[/C][C]0.879652544184293[/C][C]0.033264[/C][C]26.4442[/C][C]0[/C][C]0[/C][/ROW]
[/TABLE]
Source: https://freestatistics.org/blog/index.php?pk=110280&T=2

Globally Unique Identifier (entire table): ba.freestatistics.org/blog/index.php?pk=110280&T=2

As an alternative you can also use a QR Code:  

The GUIDs for individual cells are displayed in the table below:

Multiple Linear Regression - Ordinary Least Squares
VariableParameterS.D.T-STATH0: parameter = 02-tail p-value1-tail p-value
(Intercept)-0.05413702504400660.02054-2.63570.0107980.005399
benzine0.8796525441842930.03326426.444200


Multiple Linear Regression - Regression Statistics
Multiple R0.961578230829939
R-squared0.924632694006035
Adjusted R-squared0.923310460567544
F-TEST (value)699.296105430171
F-TEST (DF numerator)1
F-TEST (DF denominator)57
p-value0
Multiple Linear Regression - Residual Statistics
Residual Standard Deviation0.0344242198136767
Sum Squared Residuals0.0675465338574791

\begin{tabular}{lllllllll}
\hline
Multiple Linear Regression - Regression Statistics \tabularnewline
Multiple R & 0.961578230829939 \tabularnewline
R-squared & 0.924632694006035 \tabularnewline
Adjusted R-squared & 0.923310460567544 \tabularnewline
F-TEST (value) & 699.296105430171 \tabularnewline
F-TEST (DF numerator) & 1 \tabularnewline
F-TEST (DF denominator) & 57 \tabularnewline
p-value & 0 \tabularnewline
Multiple Linear Regression - Residual Statistics \tabularnewline
Residual Standard Deviation & 0.0344242198136767 \tabularnewline
Sum Squared Residuals & 0.0675465338574791 \tabularnewline
\hline
\end{tabular}
%Source: https://freestatistics.org/blog/index.php?pk=110280&T=3

[TABLE]
[ROW][C]Multiple Linear Regression - Regression Statistics[/C][/ROW]
[ROW][C]Multiple R[/C][C]0.961578230829939[/C][/ROW]
[ROW][C]R-squared[/C][C]0.924632694006035[/C][/ROW]
[ROW][C]Adjusted R-squared[/C][C]0.923310460567544[/C][/ROW]
[ROW][C]F-TEST (value)[/C][C]699.296105430171[/C][/ROW]
[ROW][C]F-TEST (DF numerator)[/C][C]1[/C][/ROW]
[ROW][C]F-TEST (DF denominator)[/C][C]57[/C][/ROW]
[ROW][C]p-value[/C][C]0[/C][/ROW]
[ROW][C]Multiple Linear Regression - Residual Statistics[/C][/ROW]
[ROW][C]Residual Standard Deviation[/C][C]0.0344242198136767[/C][/ROW]
[ROW][C]Sum Squared Residuals[/C][C]0.0675465338574791[/C][/ROW]
[/TABLE]
Source: https://freestatistics.org/blog/index.php?pk=110280&T=3

Globally Unique Identifier (entire table): ba.freestatistics.org/blog/index.php?pk=110280&T=3

As an alternative you can also use a QR Code:  

The GUIDs for individual cells are displayed in the table below:

Multiple Linear Regression - Regression Statistics
Multiple R0.961578230829939
R-squared0.924632694006035
Adjusted R-squared0.923310460567544
F-TEST (value)699.296105430171
F-TEST (DF numerator)1
F-TEST (DF denominator)57
p-value0
Multiple Linear Regression - Residual Statistics
Residual Standard Deviation0.0344242198136767
Sum Squared Residuals0.0675465338574791


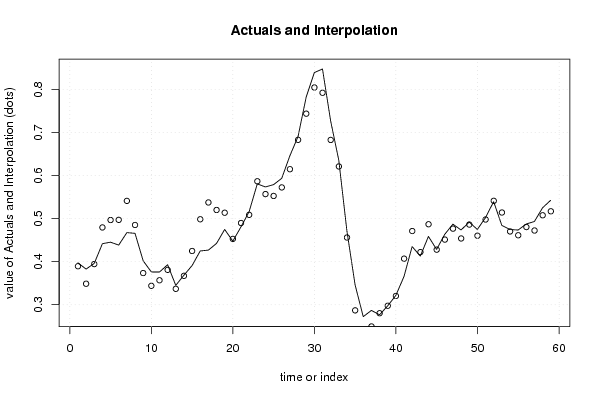
Multiple Linear Regression - Actuals, Interpolation, and Residuals
Time or IndexActualsInterpolationForecastResidualsPrediction Error
10.3972327040.3893913553845520.00784134861544753
20.3827672960.3487172271843280.034050068815672
30.3960377360.394418070031920.00161966596808033
40.4417610060.47947975501737-0.0377187490173697
50.4452201260.496710973142141-0.051490847142141
60.4384905660.497080806340945-0.0585902403409449
70.4674842770.541151363618476-0.0736670866184763
80.4657861640.485193304130542-0.0194071401305421
90.4020754720.37356399410740.0285114778926001
100.3761635220.3439320360970590.0322314859029412
110.375911950.3567931817259920.0191187682740080
120.3929559750.3809606624817420.0119953125182585
130.344905660.3369278440576610.00797781594233914
140.3685534590.3670956837589620.00145777524103854
150.3908805030.424797243618003-0.0339167406180029
160.4248427670.498462020932077-0.0736192539320773
170.4268553460.537498315263759-0.110642969263759
180.4423270440.520018025280407-0.0776909812804069
190.4748427670.513617643460735-0.0387748764607355
200.4476100630.452836654032082-0.00522659103208164
210.4807547170.489782257050339-0.00902754005033924
220.5160377360.5087494281273890.00728830787261142
230.5806289310.586693706272394-0.00606477527239415
240.5735220130.5569183429060370.0166036700939627
250.5788679250.5526237472374480.0262441777625519
260.5935849060.572390964942390.0211939410576094
270.6459748430.6146953787126750.0312794642873251
280.6905031450.682850393379530.00765275162046947
290.7822012580.7436087396720450.0385925183279554
300.8390566040.8044199196556670.0346366843443327
310.8474842770.792147488529150.0553367884708501
320.7268553460.6826541552120590.0442011907879414
330.6355345910.6211184045481390.0144161864518613
340.4709433960.4560670354968860.0148763605031137
350.3461635220.2869399520806560.0592235699193437
360.2723270440.2372690604909990.0350579835090006
370.2867924530.2495641347536570.0372283182463432
380.276729560.280282950983575-0.00355339098357503
390.2974213840.297582097637113-0.000160713637113282
400.3216981130.3203683638017310.00132974919826951
410.3655974840.406962216153158-0.0413647321531577
420.4352201260.471116991522979-0.0358968655229794
430.4128930820.42218576633093-0.0092926843309303
440.4586792450.486883970810540-0.0282047258105404
450.4284276730.4278464826326460.000581190367353649
460.4635220130.4512592012734770.0122628117265227
470.4871698110.4766795878613070.0104902231386931
480.4735849060.4538555828432390.0197293231567609
490.4918867920.4861443044129330.00574248758706747
500.4748427670.4602635129613920.0145792540386078
510.5023270440.4978657590108330.00446128498916738
520.5393710690.54126457753987-0.00189350853987035
530.4844025160.514115786298244-0.0297132702982443
540.4746540880.4701886343767290.00446545362327133
550.4735220130.4613050849086900.0122169280913104
560.487547170.4803552793521640.00719189064783578
570.4933333330.472301967946640.0210313650533602
580.5251572330.5077003087612620.0174569242387378
590.5427044030.5169612388469340.0257431641530657

\begin{tabular}{lllllllll}
\hline
Multiple Linear Regression - Actuals, Interpolation, and Residuals \tabularnewline
Time or Index & Actuals & InterpolationForecast & ResidualsPrediction Error \tabularnewline
1 & 0.397232704 & 0.389391355384552 & 0.00784134861544753 \tabularnewline
2 & 0.382767296 & 0.348717227184328 & 0.034050068815672 \tabularnewline
3 & 0.396037736 & 0.39441807003192 & 0.00161966596808033 \tabularnewline
4 & 0.441761006 & 0.47947975501737 & -0.0377187490173697 \tabularnewline
5 & 0.445220126 & 0.496710973142141 & -0.051490847142141 \tabularnewline
6 & 0.438490566 & 0.497080806340945 & -0.0585902403409449 \tabularnewline
7 & 0.467484277 & 0.541151363618476 & -0.0736670866184763 \tabularnewline
8 & 0.465786164 & 0.485193304130542 & -0.0194071401305421 \tabularnewline
9 & 0.402075472 & 0.3735639941074 & 0.0285114778926001 \tabularnewline
10 & 0.376163522 & 0.343932036097059 & 0.0322314859029412 \tabularnewline
11 & 0.37591195 & 0.356793181725992 & 0.0191187682740080 \tabularnewline
12 & 0.392955975 & 0.380960662481742 & 0.0119953125182585 \tabularnewline
13 & 0.34490566 & 0.336927844057661 & 0.00797781594233914 \tabularnewline
14 & 0.368553459 & 0.367095683758962 & 0.00145777524103854 \tabularnewline
15 & 0.390880503 & 0.424797243618003 & -0.0339167406180029 \tabularnewline
16 & 0.424842767 & 0.498462020932077 & -0.0736192539320773 \tabularnewline
17 & 0.426855346 & 0.537498315263759 & -0.110642969263759 \tabularnewline
18 & 0.442327044 & 0.520018025280407 & -0.0776909812804069 \tabularnewline
19 & 0.474842767 & 0.513617643460735 & -0.0387748764607355 \tabularnewline
20 & 0.447610063 & 0.452836654032082 & -0.00522659103208164 \tabularnewline
21 & 0.480754717 & 0.489782257050339 & -0.00902754005033924 \tabularnewline
22 & 0.516037736 & 0.508749428127389 & 0.00728830787261142 \tabularnewline
23 & 0.580628931 & 0.586693706272394 & -0.00606477527239415 \tabularnewline
24 & 0.573522013 & 0.556918342906037 & 0.0166036700939627 \tabularnewline
25 & 0.578867925 & 0.552623747237448 & 0.0262441777625519 \tabularnewline
26 & 0.593584906 & 0.57239096494239 & 0.0211939410576094 \tabularnewline
27 & 0.645974843 & 0.614695378712675 & 0.0312794642873251 \tabularnewline
28 & 0.690503145 & 0.68285039337953 & 0.00765275162046947 \tabularnewline
29 & 0.782201258 & 0.743608739672045 & 0.0385925183279554 \tabularnewline
30 & 0.839056604 & 0.804419919655667 & 0.0346366843443327 \tabularnewline
31 & 0.847484277 & 0.79214748852915 & 0.0553367884708501 \tabularnewline
32 & 0.726855346 & 0.682654155212059 & 0.0442011907879414 \tabularnewline
33 & 0.635534591 & 0.621118404548139 & 0.0144161864518613 \tabularnewline
34 & 0.470943396 & 0.456067035496886 & 0.0148763605031137 \tabularnewline
35 & 0.346163522 & 0.286939952080656 & 0.0592235699193437 \tabularnewline
36 & 0.272327044 & 0.237269060490999 & 0.0350579835090006 \tabularnewline
37 & 0.286792453 & 0.249564134753657 & 0.0372283182463432 \tabularnewline
38 & 0.27672956 & 0.280282950983575 & -0.00355339098357503 \tabularnewline
39 & 0.297421384 & 0.297582097637113 & -0.000160713637113282 \tabularnewline
40 & 0.321698113 & 0.320368363801731 & 0.00132974919826951 \tabularnewline
41 & 0.365597484 & 0.406962216153158 & -0.0413647321531577 \tabularnewline
42 & 0.435220126 & 0.471116991522979 & -0.0358968655229794 \tabularnewline
43 & 0.412893082 & 0.42218576633093 & -0.0092926843309303 \tabularnewline
44 & 0.458679245 & 0.486883970810540 & -0.0282047258105404 \tabularnewline
45 & 0.428427673 & 0.427846482632646 & 0.000581190367353649 \tabularnewline
46 & 0.463522013 & 0.451259201273477 & 0.0122628117265227 \tabularnewline
47 & 0.487169811 & 0.476679587861307 & 0.0104902231386931 \tabularnewline
48 & 0.473584906 & 0.453855582843239 & 0.0197293231567609 \tabularnewline
49 & 0.491886792 & 0.486144304412933 & 0.00574248758706747 \tabularnewline
50 & 0.474842767 & 0.460263512961392 & 0.0145792540386078 \tabularnewline
51 & 0.502327044 & 0.497865759010833 & 0.00446128498916738 \tabularnewline
52 & 0.539371069 & 0.54126457753987 & -0.00189350853987035 \tabularnewline
53 & 0.484402516 & 0.514115786298244 & -0.0297132702982443 \tabularnewline
54 & 0.474654088 & 0.470188634376729 & 0.00446545362327133 \tabularnewline
55 & 0.473522013 & 0.461305084908690 & 0.0122169280913104 \tabularnewline
56 & 0.48754717 & 0.480355279352164 & 0.00719189064783578 \tabularnewline
57 & 0.493333333 & 0.47230196794664 & 0.0210313650533602 \tabularnewline
58 & 0.525157233 & 0.507700308761262 & 0.0174569242387378 \tabularnewline
59 & 0.542704403 & 0.516961238846934 & 0.0257431641530657 \tabularnewline
\hline
\end{tabular}
%Source: https://freestatistics.org/blog/index.php?pk=110280&T=4

[TABLE]
[ROW][C]Multiple Linear Regression - Actuals, Interpolation, and Residuals[/C][/ROW]
[ROW][C]Time or Index[/C][C]Actuals[/C][C]InterpolationForecast[/C][C]ResidualsPrediction Error[/C][/ROW]
[ROW][C]1[/C][C]0.397232704[/C][C]0.389391355384552[/C][C]0.00784134861544753[/C][/ROW]
[ROW][C]2[/C][C]0.382767296[/C][C]0.348717227184328[/C][C]0.034050068815672[/C][/ROW]
[ROW][C]3[/C][C]0.396037736[/C][C]0.39441807003192[/C][C]0.00161966596808033[/C][/ROW]
[ROW][C]4[/C][C]0.441761006[/C][C]0.47947975501737[/C][C]-0.0377187490173697[/C][/ROW]
[ROW][C]5[/C][C]0.445220126[/C][C]0.496710973142141[/C][C]-0.051490847142141[/C][/ROW]
[ROW][C]6[/C][C]0.438490566[/C][C]0.497080806340945[/C][C]-0.0585902403409449[/C][/ROW]
[ROW][C]7[/C][C]0.467484277[/C][C]0.541151363618476[/C][C]-0.0736670866184763[/C][/ROW]
[ROW][C]8[/C][C]0.465786164[/C][C]0.485193304130542[/C][C]-0.0194071401305421[/C][/ROW]
[ROW][C]9[/C][C]0.402075472[/C][C]0.3735639941074[/C][C]0.0285114778926001[/C][/ROW]
[ROW][C]10[/C][C]0.376163522[/C][C]0.343932036097059[/C][C]0.0322314859029412[/C][/ROW]
[ROW][C]11[/C][C]0.37591195[/C][C]0.356793181725992[/C][C]0.0191187682740080[/C][/ROW]
[ROW][C]12[/C][C]0.392955975[/C][C]0.380960662481742[/C][C]0.0119953125182585[/C][/ROW]
[ROW][C]13[/C][C]0.34490566[/C][C]0.336927844057661[/C][C]0.00797781594233914[/C][/ROW]
[ROW][C]14[/C][C]0.368553459[/C][C]0.367095683758962[/C][C]0.00145777524103854[/C][/ROW]
[ROW][C]15[/C][C]0.390880503[/C][C]0.424797243618003[/C][C]-0.0339167406180029[/C][/ROW]
[ROW][C]16[/C][C]0.424842767[/C][C]0.498462020932077[/C][C]-0.0736192539320773[/C][/ROW]
[ROW][C]17[/C][C]0.426855346[/C][C]0.537498315263759[/C][C]-0.110642969263759[/C][/ROW]
[ROW][C]18[/C][C]0.442327044[/C][C]0.520018025280407[/C][C]-0.0776909812804069[/C][/ROW]
[ROW][C]19[/C][C]0.474842767[/C][C]0.513617643460735[/C][C]-0.0387748764607355[/C][/ROW]
[ROW][C]20[/C][C]0.447610063[/C][C]0.452836654032082[/C][C]-0.00522659103208164[/C][/ROW]
[ROW][C]21[/C][C]0.480754717[/C][C]0.489782257050339[/C][C]-0.00902754005033924[/C][/ROW]
[ROW][C]22[/C][C]0.516037736[/C][C]0.508749428127389[/C][C]0.00728830787261142[/C][/ROW]
[ROW][C]23[/C][C]0.580628931[/C][C]0.586693706272394[/C][C]-0.00606477527239415[/C][/ROW]
[ROW][C]24[/C][C]0.573522013[/C][C]0.556918342906037[/C][C]0.0166036700939627[/C][/ROW]
[ROW][C]25[/C][C]0.578867925[/C][C]0.552623747237448[/C][C]0.0262441777625519[/C][/ROW]
[ROW][C]26[/C][C]0.593584906[/C][C]0.57239096494239[/C][C]0.0211939410576094[/C][/ROW]
[ROW][C]27[/C][C]0.645974843[/C][C]0.614695378712675[/C][C]0.0312794642873251[/C][/ROW]
[ROW][C]28[/C][C]0.690503145[/C][C]0.68285039337953[/C][C]0.00765275162046947[/C][/ROW]
[ROW][C]29[/C][C]0.782201258[/C][C]0.743608739672045[/C][C]0.0385925183279554[/C][/ROW]
[ROW][C]30[/C][C]0.839056604[/C][C]0.804419919655667[/C][C]0.0346366843443327[/C][/ROW]
[ROW][C]31[/C][C]0.847484277[/C][C]0.79214748852915[/C][C]0.0553367884708501[/C][/ROW]
[ROW][C]32[/C][C]0.726855346[/C][C]0.682654155212059[/C][C]0.0442011907879414[/C][/ROW]
[ROW][C]33[/C][C]0.635534591[/C][C]0.621118404548139[/C][C]0.0144161864518613[/C][/ROW]
[ROW][C]34[/C][C]0.470943396[/C][C]0.456067035496886[/C][C]0.0148763605031137[/C][/ROW]
[ROW][C]35[/C][C]0.346163522[/C][C]0.286939952080656[/C][C]0.0592235699193437[/C][/ROW]
[ROW][C]36[/C][C]0.272327044[/C][C]0.237269060490999[/C][C]0.0350579835090006[/C][/ROW]
[ROW][C]37[/C][C]0.286792453[/C][C]0.249564134753657[/C][C]0.0372283182463432[/C][/ROW]
[ROW][C]38[/C][C]0.27672956[/C][C]0.280282950983575[/C][C]-0.00355339098357503[/C][/ROW]
[ROW][C]39[/C][C]0.297421384[/C][C]0.297582097637113[/C][C]-0.000160713637113282[/C][/ROW]
[ROW][C]40[/C][C]0.321698113[/C][C]0.320368363801731[/C][C]0.00132974919826951[/C][/ROW]
[ROW][C]41[/C][C]0.365597484[/C][C]0.406962216153158[/C][C]-0.0413647321531577[/C][/ROW]
[ROW][C]42[/C][C]0.435220126[/C][C]0.471116991522979[/C][C]-0.0358968655229794[/C][/ROW]
[ROW][C]43[/C][C]0.412893082[/C][C]0.42218576633093[/C][C]-0.0092926843309303[/C][/ROW]
[ROW][C]44[/C][C]0.458679245[/C][C]0.486883970810540[/C][C]-0.0282047258105404[/C][/ROW]
[ROW][C]45[/C][C]0.428427673[/C][C]0.427846482632646[/C][C]0.000581190367353649[/C][/ROW]
[ROW][C]46[/C][C]0.463522013[/C][C]0.451259201273477[/C][C]0.0122628117265227[/C][/ROW]
[ROW][C]47[/C][C]0.487169811[/C][C]0.476679587861307[/C][C]0.0104902231386931[/C][/ROW]
[ROW][C]48[/C][C]0.473584906[/C][C]0.453855582843239[/C][C]0.0197293231567609[/C][/ROW]
[ROW][C]49[/C][C]0.491886792[/C][C]0.486144304412933[/C][C]0.00574248758706747[/C][/ROW]
[ROW][C]50[/C][C]0.474842767[/C][C]0.460263512961392[/C][C]0.0145792540386078[/C][/ROW]
[ROW][C]51[/C][C]0.502327044[/C][C]0.497865759010833[/C][C]0.00446128498916738[/C][/ROW]
[ROW][C]52[/C][C]0.539371069[/C][C]0.54126457753987[/C][C]-0.00189350853987035[/C][/ROW]
[ROW][C]53[/C][C]0.484402516[/C][C]0.514115786298244[/C][C]-0.0297132702982443[/C][/ROW]
[ROW][C]54[/C][C]0.474654088[/C][C]0.470188634376729[/C][C]0.00446545362327133[/C][/ROW]
[ROW][C]55[/C][C]0.473522013[/C][C]0.461305084908690[/C][C]0.0122169280913104[/C][/ROW]
[ROW][C]56[/C][C]0.48754717[/C][C]0.480355279352164[/C][C]0.00719189064783578[/C][/ROW]
[ROW][C]57[/C][C]0.493333333[/C][C]0.47230196794664[/C][C]0.0210313650533602[/C][/ROW]
[ROW][C]58[/C][C]0.525157233[/C][C]0.507700308761262[/C][C]0.0174569242387378[/C][/ROW]
[ROW][C]59[/C][C]0.542704403[/C][C]0.516961238846934[/C][C]0.0257431641530657[/C][/ROW]
[/TABLE]
Source: https://freestatistics.org/blog/index.php?pk=110280&T=4

Globally Unique Identifier (entire table): ba.freestatistics.org/blog/index.php?pk=110280&T=4

As an alternative you can also use a QR Code:  

The GUIDs for individual cells are displayed in the table below:

Multiple Linear Regression - Actuals, Interpolation, and Residuals
Time or IndexActualsInterpolationForecastResidualsPrediction Error
10.3972327040.3893913553845520.00784134861544753
20.3827672960.3487172271843280.034050068815672
30.3960377360.394418070031920.00161966596808033
40.4417610060.47947975501737-0.0377187490173697
50.4452201260.496710973142141-0.051490847142141
60.4384905660.497080806340945-0.0585902403409449
70.4674842770.541151363618476-0.0736670866184763
80.4657861640.485193304130542-0.0194071401305421
90.4020754720.37356399410740.0285114778926001
100.3761635220.3439320360970590.0322314859029412
110.375911950.3567931817259920.0191187682740080
120.3929559750.3809606624817420.0119953125182585
130.344905660.3369278440576610.00797781594233914
140.3685534590.3670956837589620.00145777524103854
150.3908805030.424797243618003-0.0339167406180029
160.4248427670.498462020932077-0.0736192539320773
170.4268553460.537498315263759-0.110642969263759
180.4423270440.520018025280407-0.0776909812804069
190.4748427670.513617643460735-0.0387748764607355
200.4476100630.452836654032082-0.00522659103208164
210.4807547170.489782257050339-0.00902754005033924
220.5160377360.5087494281273890.00728830787261142
230.5806289310.586693706272394-0.00606477527239415
240.5735220130.5569183429060370.0166036700939627
250.5788679250.5526237472374480.0262441777625519
260.5935849060.572390964942390.0211939410576094
270.6459748430.6146953787126750.0312794642873251
280.6905031450.682850393379530.00765275162046947
290.7822012580.7436087396720450.0385925183279554
300.8390566040.8044199196556670.0346366843443327
310.8474842770.792147488529150.0553367884708501
320.7268553460.6826541552120590.0442011907879414
330.6355345910.6211184045481390.0144161864518613
340.4709433960.4560670354968860.0148763605031137
350.3461635220.2869399520806560.0592235699193437
360.2723270440.2372690604909990.0350579835090006
370.2867924530.2495641347536570.0372283182463432
380.276729560.280282950983575-0.00355339098357503
390.2974213840.297582097637113-0.000160713637113282
400.3216981130.3203683638017310.00132974919826951
410.3655974840.406962216153158-0.0413647321531577
420.4352201260.471116991522979-0.0358968655229794
430.4128930820.42218576633093-0.0092926843309303
440.4586792450.486883970810540-0.0282047258105404
450.4284276730.4278464826326460.000581190367353649
460.4635220130.4512592012734770.0122628117265227
470.4871698110.4766795878613070.0104902231386931
480.4735849060.4538555828432390.0197293231567609
490.4918867920.4861443044129330.00574248758706747
500.4748427670.4602635129613920.0145792540386078
510.5023270440.4978657590108330.00446128498916738
520.5393710690.54126457753987-0.00189350853987035
530.4844025160.514115786298244-0.0297132702982443
540.4746540880.4701886343767290.00446545362327133
550.4735220130.4613050849086900.0122169280913104
560.487547170.4803552793521640.00719189064783578
570.4933333330.472301967946640.0210313650533602
580.5251572330.5077003087612620.0174569242387378
590.5427044030.5169612388469340.0257431641530657


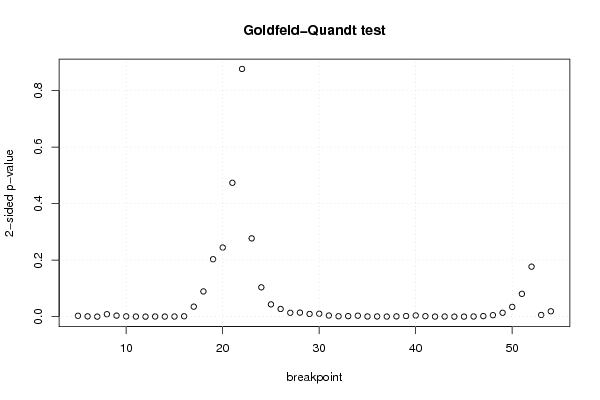
Goldfeld-Quandt test for Heteroskedasticity
p-valuesAlternative Hypothesis
breakpoint indexgreater2-sidedless
50.001594527225287390.003189054450574780.998405472774713
60.0006423520097354510.001284704019470900.999357647990265
70.0001391591947907680.0002783183895815360.99986084080521
80.004392652440937570.008785304881875140.995607347559062
90.001860420707498490.003720841414996990.998139579292502
100.0006077872352610970.001215574470522190.999392212764739
110.0002485975734996340.0004971951469992690.9997514024265
126.82521151268311e-050.0001365042302536620.999931747884873
130.000350072366554160.000700144733108320.999649927633446
140.0002259006740425200.0004518013480850410.999774099325957
150.0002945996517753360.0005891993035506720.999705400348225
160.0007428531323109070.001485706264621810.99925714686769
170.01773756541256730.03547513082513450.982262434587433
180.04467240206038330.08934480412076650.955327597939617
190.1016535269930220.2033070539860440.898346473006978
200.1223766202129410.2447532404258810.87762337978706
210.2368969194210170.4737938388420350.763103080578983
220.5616855343549980.8766289312900050.438314465645002
230.8614148187885280.2771703624229450.138585181211472
240.9480338569972880.1039322860054230.0519661430027116
250.978221712920940.04355657415811870.0217782870790594
260.9863319374101380.02733612517972440.0136680625898622
270.9931044641759760.01379107164804880.00689553582402439
280.9927942378737550.01441152425248990.00720576212624494
290.9951922261754850.00961554764903010.00480777382451505
300.994802903275920.01039419344815830.00519709672407916
310.9979490893839250.004101821232150890.00205091061607544
320.9992420025780030.001515994843993430.000757997421996713
330.9989706770775360.002058645844928510.00102932292246426
340.9982733352674470.003453329465105430.00172666473255271
350.9995792887057090.0008414225885829370.000420711294291468
360.9995471379805430.0009057240389137940.000452862019456897
370.9997499755317230.000500048936553560.00025002446827678
380.9994373564972410.001125287005517720.000562643502758862
390.9988205396275540.002358920744892800.00117946037244640
400.9978547329907860.004290534018427570.00214526700921378
410.999128688867910.001742622264181790.000871311132090893
420.9997751172371460.0004497655257078040.000224882762853902
430.999685170991250.0006296580174983370.000314829008749169
440.999927099494120.0001458010117615557.29005058807774e-05
450.99988343270270.0002331345945998970.000116567297299948
460.9996540890322570.0006918219354852340.000345910967742617
470.998987010806270.002025978387460450.00101298919373023
480.997352895043340.005294209913320810.00264710495666040
490.9930391914866980.01392161702660350.00696080851330173
500.982721509745190.03455698050961990.0172784902548099
510.9595492343576490.08090153128470260.0404507656423513
520.9115422961028030.1769154077943940.088457703897197
530.996981103083850.006037793832299970.00301889691614998
540.9904266362650060.01914672746998770.00957336373499386

\begin{tabular}{lllllllll}
\hline
Goldfeld-Quandt test for Heteroskedasticity \tabularnewline
p-values & Alternative Hypothesis \tabularnewline
breakpoint index & greater & 2-sided & less \tabularnewline
5 & 0.00159452722528739 & 0.00318905445057478 & 0.998405472774713 \tabularnewline
6 & 0.000642352009735451 & 0.00128470401947090 & 0.999357647990265 \tabularnewline
7 & 0.000139159194790768 & 0.000278318389581536 & 0.99986084080521 \tabularnewline
8 & 0.00439265244093757 & 0.00878530488187514 & 0.995607347559062 \tabularnewline
9 & 0.00186042070749849 & 0.00372084141499699 & 0.998139579292502 \tabularnewline
10 & 0.000607787235261097 & 0.00121557447052219 & 0.999392212764739 \tabularnewline
11 & 0.000248597573499634 & 0.000497195146999269 & 0.9997514024265 \tabularnewline
12 & 6.82521151268311e-05 & 0.000136504230253662 & 0.999931747884873 \tabularnewline
13 & 0.00035007236655416 & 0.00070014473310832 & 0.999649927633446 \tabularnewline
14 & 0.000225900674042520 & 0.000451801348085041 & 0.999774099325957 \tabularnewline
15 & 0.000294599651775336 & 0.000589199303550672 & 0.999705400348225 \tabularnewline
16 & 0.000742853132310907 & 0.00148570626462181 & 0.99925714686769 \tabularnewline
17 & 0.0177375654125673 & 0.0354751308251345 & 0.982262434587433 \tabularnewline
18 & 0.0446724020603833 & 0.0893448041207665 & 0.955327597939617 \tabularnewline
19 & 0.101653526993022 & 0.203307053986044 & 0.898346473006978 \tabularnewline
20 & 0.122376620212941 & 0.244753240425881 & 0.87762337978706 \tabularnewline
21 & 0.236896919421017 & 0.473793838842035 & 0.763103080578983 \tabularnewline
22 & 0.561685534354998 & 0.876628931290005 & 0.438314465645002 \tabularnewline
23 & 0.861414818788528 & 0.277170362422945 & 0.138585181211472 \tabularnewline
24 & 0.948033856997288 & 0.103932286005423 & 0.0519661430027116 \tabularnewline
25 & 0.97822171292094 & 0.0435565741581187 & 0.0217782870790594 \tabularnewline
26 & 0.986331937410138 & 0.0273361251797244 & 0.0136680625898622 \tabularnewline
27 & 0.993104464175976 & 0.0137910716480488 & 0.00689553582402439 \tabularnewline
28 & 0.992794237873755 & 0.0144115242524899 & 0.00720576212624494 \tabularnewline
29 & 0.995192226175485 & 0.0096155476490301 & 0.00480777382451505 \tabularnewline
30 & 0.99480290327592 & 0.0103941934481583 & 0.00519709672407916 \tabularnewline
31 & 0.997949089383925 & 0.00410182123215089 & 0.00205091061607544 \tabularnewline
32 & 0.999242002578003 & 0.00151599484399343 & 0.000757997421996713 \tabularnewline
33 & 0.998970677077536 & 0.00205864584492851 & 0.00102932292246426 \tabularnewline
34 & 0.998273335267447 & 0.00345332946510543 & 0.00172666473255271 \tabularnewline
35 & 0.999579288705709 & 0.000841422588582937 & 0.000420711294291468 \tabularnewline
36 & 0.999547137980543 & 0.000905724038913794 & 0.000452862019456897 \tabularnewline
37 & 0.999749975531723 & 0.00050004893655356 & 0.00025002446827678 \tabularnewline
38 & 0.999437356497241 & 0.00112528700551772 & 0.000562643502758862 \tabularnewline
39 & 0.998820539627554 & 0.00235892074489280 & 0.00117946037244640 \tabularnewline
40 & 0.997854732990786 & 0.00429053401842757 & 0.00214526700921378 \tabularnewline
41 & 0.99912868886791 & 0.00174262226418179 & 0.000871311132090893 \tabularnewline
42 & 0.999775117237146 & 0.000449765525707804 & 0.000224882762853902 \tabularnewline
43 & 0.99968517099125 & 0.000629658017498337 & 0.000314829008749169 \tabularnewline
44 & 0.99992709949412 & 0.000145801011761555 & 7.29005058807774e-05 \tabularnewline
45 & 0.9998834327027 & 0.000233134594599897 & 0.000116567297299948 \tabularnewline
46 & 0.999654089032257 & 0.000691821935485234 & 0.000345910967742617 \tabularnewline
47 & 0.99898701080627 & 0.00202597838746045 & 0.00101298919373023 \tabularnewline
48 & 0.99735289504334 & 0.00529420991332081 & 0.00264710495666040 \tabularnewline
49 & 0.993039191486698 & 0.0139216170266035 & 0.00696080851330173 \tabularnewline
50 & 0.98272150974519 & 0.0345569805096199 & 0.0172784902548099 \tabularnewline
51 & 0.959549234357649 & 0.0809015312847026 & 0.0404507656423513 \tabularnewline
52 & 0.911542296102803 & 0.176915407794394 & 0.088457703897197 \tabularnewline
53 & 0.99698110308385 & 0.00603779383229997 & 0.00301889691614998 \tabularnewline
54 & 0.990426636265006 & 0.0191467274699877 & 0.00957336373499386 \tabularnewline
\hline
\end{tabular}
%Source: https://freestatistics.org/blog/index.php?pk=110280&T=5

[TABLE]
[ROW][C]Goldfeld-Quandt test for Heteroskedasticity[/C][/ROW]
[ROW][C]p-values[/C][C]Alternative Hypothesis[/C][/ROW]
[ROW][C]breakpoint index[/C][C]greater[/C][C]2-sided[/C][C]less[/C][/ROW]
[ROW][C]5[/C][C]0.00159452722528739[/C][C]0.00318905445057478[/C][C]0.998405472774713[/C][/ROW]
[ROW][C]6[/C][C]0.000642352009735451[/C][C]0.00128470401947090[/C][C]0.999357647990265[/C][/ROW]
[ROW][C]7[/C][C]0.000139159194790768[/C][C]0.000278318389581536[/C][C]0.99986084080521[/C][/ROW]
[ROW][C]8[/C][C]0.00439265244093757[/C][C]0.00878530488187514[/C][C]0.995607347559062[/C][/ROW]
[ROW][C]9[/C][C]0.00186042070749849[/C][C]0.00372084141499699[/C][C]0.998139579292502[/C][/ROW]
[ROW][C]10[/C][C]0.000607787235261097[/C][C]0.00121557447052219[/C][C]0.999392212764739[/C][/ROW]
[ROW][C]11[/C][C]0.000248597573499634[/C][C]0.000497195146999269[/C][C]0.9997514024265[/C][/ROW]
[ROW][C]12[/C][C]6.82521151268311e-05[/C][C]0.000136504230253662[/C][C]0.999931747884873[/C][/ROW]
[ROW][C]13[/C][C]0.00035007236655416[/C][C]0.00070014473310832[/C][C]0.999649927633446[/C][/ROW]
[ROW][C]14[/C][C]0.000225900674042520[/C][C]0.000451801348085041[/C][C]0.999774099325957[/C][/ROW]
[ROW][C]15[/C][C]0.000294599651775336[/C][C]0.000589199303550672[/C][C]0.999705400348225[/C][/ROW]
[ROW][C]16[/C][C]0.000742853132310907[/C][C]0.00148570626462181[/C][C]0.99925714686769[/C][/ROW]
[ROW][C]17[/C][C]0.0177375654125673[/C][C]0.0354751308251345[/C][C]0.982262434587433[/C][/ROW]
[ROW][C]18[/C][C]0.0446724020603833[/C][C]0.0893448041207665[/C][C]0.955327597939617[/C][/ROW]
[ROW][C]19[/C][C]0.101653526993022[/C][C]0.203307053986044[/C][C]0.898346473006978[/C][/ROW]
[ROW][C]20[/C][C]0.122376620212941[/C][C]0.244753240425881[/C][C]0.87762337978706[/C][/ROW]
[ROW][C]21[/C][C]0.236896919421017[/C][C]0.473793838842035[/C][C]0.763103080578983[/C][/ROW]
[ROW][C]22[/C][C]0.561685534354998[/C][C]0.876628931290005[/C][C]0.438314465645002[/C][/ROW]
[ROW][C]23[/C][C]0.861414818788528[/C][C]0.277170362422945[/C][C]0.138585181211472[/C][/ROW]
[ROW][C]24[/C][C]0.948033856997288[/C][C]0.103932286005423[/C][C]0.0519661430027116[/C][/ROW]
[ROW][C]25[/C][C]0.97822171292094[/C][C]0.0435565741581187[/C][C]0.0217782870790594[/C][/ROW]
[ROW][C]26[/C][C]0.986331937410138[/C][C]0.0273361251797244[/C][C]0.0136680625898622[/C][/ROW]
[ROW][C]27[/C][C]0.993104464175976[/C][C]0.0137910716480488[/C][C]0.00689553582402439[/C][/ROW]
[ROW][C]28[/C][C]0.992794237873755[/C][C]0.0144115242524899[/C][C]0.00720576212624494[/C][/ROW]
[ROW][C]29[/C][C]0.995192226175485[/C][C]0.0096155476490301[/C][C]0.00480777382451505[/C][/ROW]
[ROW][C]30[/C][C]0.99480290327592[/C][C]0.0103941934481583[/C][C]0.00519709672407916[/C][/ROW]
[ROW][C]31[/C][C]0.997949089383925[/C][C]0.00410182123215089[/C][C]0.00205091061607544[/C][/ROW]
[ROW][C]32[/C][C]0.999242002578003[/C][C]0.00151599484399343[/C][C]0.000757997421996713[/C][/ROW]
[ROW][C]33[/C][C]0.998970677077536[/C][C]0.00205864584492851[/C][C]0.00102932292246426[/C][/ROW]
[ROW][C]34[/C][C]0.998273335267447[/C][C]0.00345332946510543[/C][C]0.00172666473255271[/C][/ROW]
[ROW][C]35[/C][C]0.999579288705709[/C][C]0.000841422588582937[/C][C]0.000420711294291468[/C][/ROW]
[ROW][C]36[/C][C]0.999547137980543[/C][C]0.000905724038913794[/C][C]0.000452862019456897[/C][/ROW]
[ROW][C]37[/C][C]0.999749975531723[/C][C]0.00050004893655356[/C][C]0.00025002446827678[/C][/ROW]
[ROW][C]38[/C][C]0.999437356497241[/C][C]0.00112528700551772[/C][C]0.000562643502758862[/C][/ROW]
[ROW][C]39[/C][C]0.998820539627554[/C][C]0.00235892074489280[/C][C]0.00117946037244640[/C][/ROW]
[ROW][C]40[/C][C]0.997854732990786[/C][C]0.00429053401842757[/C][C]0.00214526700921378[/C][/ROW]
[ROW][C]41[/C][C]0.99912868886791[/C][C]0.00174262226418179[/C][C]0.000871311132090893[/C][/ROW]
[ROW][C]42[/C][C]0.999775117237146[/C][C]0.000449765525707804[/C][C]0.000224882762853902[/C][/ROW]
[ROW][C]43[/C][C]0.99968517099125[/C][C]0.000629658017498337[/C][C]0.000314829008749169[/C][/ROW]
[ROW][C]44[/C][C]0.99992709949412[/C][C]0.000145801011761555[/C][C]7.29005058807774e-05[/C][/ROW]
[ROW][C]45[/C][C]0.9998834327027[/C][C]0.000233134594599897[/C][C]0.000116567297299948[/C][/ROW]
[ROW][C]46[/C][C]0.999654089032257[/C][C]0.000691821935485234[/C][C]0.000345910967742617[/C][/ROW]
[ROW][C]47[/C][C]0.99898701080627[/C][C]0.00202597838746045[/C][C]0.00101298919373023[/C][/ROW]
[ROW][C]48[/C][C]0.99735289504334[/C][C]0.00529420991332081[/C][C]0.00264710495666040[/C][/ROW]
[ROW][C]49[/C][C]0.993039191486698[/C][C]0.0139216170266035[/C][C]0.00696080851330173[/C][/ROW]
[ROW][C]50[/C][C]0.98272150974519[/C][C]0.0345569805096199[/C][C]0.0172784902548099[/C][/ROW]
[ROW][C]51[/C][C]0.959549234357649[/C][C]0.0809015312847026[/C][C]0.0404507656423513[/C][/ROW]
[ROW][C]52[/C][C]0.911542296102803[/C][C]0.176915407794394[/C][C]0.088457703897197[/C][/ROW]
[ROW][C]53[/C][C]0.99698110308385[/C][C]0.00603779383229997[/C][C]0.00301889691614998[/C][/ROW]
[ROW][C]54[/C][C]0.990426636265006[/C][C]0.0191467274699877[/C][C]0.00957336373499386[/C][/ROW]
[/TABLE]
Source: https://freestatistics.org/blog/index.php?pk=110280&T=5

Globally Unique Identifier (entire table): ba.freestatistics.org/blog/index.php?pk=110280&T=5

As an alternative you can also use a QR Code:  

The GUIDs for individual cells are displayed in the table below:

Goldfeld-Quandt test for Heteroskedasticity
p-valuesAlternative Hypothesis
breakpoint indexgreater2-sidedless
50.001594527225287390.003189054450574780.998405472774713
60.0006423520097354510.001284704019470900.999357647990265
70.0001391591947907680.0002783183895815360.99986084080521
80.004392652440937570.008785304881875140.995607347559062
90.001860420707498490.003720841414996990.998139579292502
100.0006077872352610970.001215574470522190.999392212764739
110.0002485975734996340.0004971951469992690.9997514024265
126.82521151268311e-050.0001365042302536620.999931747884873
130.000350072366554160.000700144733108320.999649927633446
140.0002259006740425200.0004518013480850410.999774099325957
150.0002945996517753360.0005891993035506720.999705400348225
160.0007428531323109070.001485706264621810.99925714686769
170.01773756541256730.03547513082513450.982262434587433
180.04467240206038330.08934480412076650.955327597939617
190.1016535269930220.2033070539860440.898346473006978
200.1223766202129410.2447532404258810.87762337978706
210.2368969194210170.4737938388420350.763103080578983
220.5616855343549980.8766289312900050.438314465645002
230.8614148187885280.2771703624229450.138585181211472
240.9480338569972880.1039322860054230.0519661430027116
250.978221712920940.04355657415811870.0217782870790594
260.9863319374101380.02733612517972440.0136680625898622
270.9931044641759760.01379107164804880.00689553582402439
280.9927942378737550.01441152425248990.00720576212624494
290.9951922261754850.00961554764903010.00480777382451505
300.994802903275920.01039419344815830.00519709672407916
310.9979490893839250.004101821232150890.00205091061607544
320.9992420025780030.001515994843993430.000757997421996713
330.9989706770775360.002058645844928510.00102932292246426
340.9982733352674470.003453329465105430.00172666473255271
350.9995792887057090.0008414225885829370.000420711294291468
360.9995471379805430.0009057240389137940.000452862019456897
370.9997499755317230.000500048936553560.00025002446827678
380.9994373564972410.001125287005517720.000562643502758862
390.9988205396275540.002358920744892800.00117946037244640
400.9978547329907860.004290534018427570.00214526700921378
410.999128688867910.001742622264181790.000871311132090893
420.9997751172371460.0004497655257078040.000224882762853902
430.999685170991250.0006296580174983370.000314829008749169
440.999927099494120.0001458010117615557.29005058807774e-05
450.99988343270270.0002331345945998970.000116567297299948
460.9996540890322570.0006918219354852340.000345910967742617
470.998987010806270.002025978387460450.00101298919373023
480.997352895043340.005294209913320810.00264710495666040
490.9930391914866980.01392161702660350.00696080851330173
500.982721509745190.03455698050961990.0172784902548099
510.9595492343576490.08090153128470260.0404507656423513
520.9115422961028030.1769154077943940.088457703897197
530.996981103083850.006037793832299970.00301889691614998
540.9904266362650060.01914672746998770.00957336373499386


Meta Analysis of Goldfeld-Quandt test for Heteroskedasticity
Description# significant tests% significant testsOK/NOK
1% type I error level320.64NOK
5% type I error level410.82NOK
10% type I error level430.86NOK

\begin{tabular}{lllllllll}
\hline
Meta Analysis of Goldfeld-Quandt test for Heteroskedasticity \tabularnewline
Description & # significant tests & % significant tests & OK/NOK \tabularnewline
1% type I error level & 32 & 0.64 & NOK \tabularnewline
5% type I error level & 41 & 0.82 & NOK \tabularnewline
10% type I error level & 43 & 0.86 & NOK \tabularnewline
\hline
\end{tabular}
%Source: https://freestatistics.org/blog/index.php?pk=110280&T=6

[TABLE]
[ROW][C]Meta Analysis of Goldfeld-Quandt test for Heteroskedasticity[/C][/ROW]
[ROW][C]Description[/C][C]# significant tests[/C][C]% significant tests[/C][C]OK/NOK[/C][/ROW]
[ROW][C]1% type I error level[/C][C]32[/C][C]0.64[/C][C]NOK[/C][/ROW]
[ROW][C]5% type I error level[/C][C]41[/C][C]0.82[/C][C]NOK[/C][/ROW]
[ROW][C]10% type I error level[/C][C]43[/C][C]0.86[/C][C]NOK[/C][/ROW]
[/TABLE]
Source: https://freestatistics.org/blog/index.php?pk=110280&T=6

Globally Unique Identifier (entire table): ba.freestatistics.org/blog/index.php?pk=110280&T=6

As an alternative you can also use a QR Code:  

The GUIDs for individual cells are displayed in the table below:

Meta Analysis of Goldfeld-Quandt test for Heteroskedasticity
Description# significant tests% significant testsOK/NOK
1% type I error level320.64NOK
5% type I error level410.82NOK
10% type I error level430.86NOK


Parameters (Session):
par1 = 2 ; par2 = Do not include Seasonal Dummies ; par3 = No Linear Trend ;
Parameters (R input):
par1 = 2 ; par2 = Do not include Seasonal Dummies ; par3 = No Linear Trend ;
R code (references can be found in the software module):
library(lattice)
library(lmtest)
n25 <- 25 #minimum number of obs. for Goldfeld-Quandt test
par1 <- as.numeric(par1)
x <- t(y)
k <- length(x[1,])
n <- length(x[,1])
x1 <- cbind(x[,par1], x[,1:k!=par1])
mycolnames <- c(colnames(x)[par1], colnames(x)[1:k!=par1])
colnames(x1) <- mycolnames #colnames(x)[par1]
x <- x1
if (par3 == 'First Differences'){
x2 <- array(0, dim=c(n-1,k), dimnames=list(1:(n-1), paste('(1-B)',colnames(x),sep='')))
for (i in 1:n-1) {
for (j in 1:k) {
x2[i,j] <- x[i+1,j] - x[i,j]
}
}
x <- x2
}
if (par2 == 'Include Monthly Dummies'){
x2 <- array(0, dim=c(n,11), dimnames=list(1:n, paste('M', seq(1:11), sep ='')))
for (i in 1:11){
x2[seq(i,n,12),i] <- 1
}
x <- cbind(x, x2)
}
if (par2 == 'Include Quarterly Dummies'){
x2 <- array(0, dim=c(n,3), dimnames=list(1:n, paste('Q', seq(1:3), sep ='')))
for (i in 1:3){
x2[seq(i,n,4),i] <- 1
}
x <- cbind(x, x2)
}
k <- length(x[1,])
if (par3 == 'Linear Trend'){
x <- cbind(x, c(1:n))
colnames(x)[k+1] <- 't'
}
x
k <- length(x[1,])
df <- as.data.frame(x)
(mylm <- lm(df))
(mysum <- summary(mylm))
if (n > n25) {
kp3 <- k + 3
nmkm3 <- n - k - 3
gqarr <- array(NA, dim=c(nmkm3-kp3+1,3))
numgqtests <- 0
numsignificant1 <- 0
numsignificant5 <- 0
numsignificant10 <- 0
for (mypoint in kp3:nmkm3) {
j <- 0
numgqtests <- numgqtests + 1
for (myalt in c('greater', 'two.sided', 'less')) {
j <- j + 1
gqarr[mypoint-kp3+1,j] <- gqtest(mylm, point=mypoint, alternative=myalt)$p.value
}
if (gqarr[mypoint-kp3+1,2] < 0.01) numsignificant1 <- numsignificant1 + 1
if (gqarr[mypoint-kp3+1,2] < 0.05) numsignificant5 <- numsignificant5 + 1
if (gqarr[mypoint-kp3+1,2] < 0.10) numsignificant10 <- numsignificant10 + 1
}
gqarr
}
bitmap(file='test0.png')
plot(x[,1], type='l', main='Actuals and Interpolation', ylab='value of Actuals and Interpolation (dots)', xlab='time or index')
points(x[,1]-mysum$resid)
grid()
dev.off()
bitmap(file='test1.png')
plot(mysum$resid, type='b', pch=19, main='Residuals', ylab='value of Residuals', xlab='time or index')
grid()
dev.off()
bitmap(file='test2.png')
hist(mysum$resid, main='Residual Histogram', xlab='values of Residuals')
grid()
dev.off()
bitmap(file='test3.png')
densityplot(~mysum$resid,col='black',main='Residual Density Plot', xlab='values of Residuals')
dev.off()
bitmap(file='test4.png')
qqnorm(mysum$resid, main='Residual Normal Q-Q Plot')
qqline(mysum$resid)
grid()
dev.off()
(myerror <- as.ts(mysum$resid))
bitmap(file='test5.png')
dum <- cbind(lag(myerror,k=1),myerror)
dum
dum1 <- dum[2:length(myerror),]
dum1
z <- as.data.frame(dum1)
z
plot(z,main=paste('Residual Lag plot, lowess, and regression line'), ylab='values of Residuals', xlab='lagged values of Residuals')
lines(lowess(z))
abline(lm(z))
grid()
dev.off()
bitmap(file='test6.png')
acf(mysum$resid, lag.max=length(mysum$resid)/2, main='Residual Autocorrelation Function')
grid()
dev.off()
bitmap(file='test7.png')
pacf(mysum$resid, lag.max=length(mysum$resid)/2, main='Residual Partial Autocorrelation Function')
grid()
dev.off()
bitmap(file='test8.png')
opar <- par(mfrow = c(2,2), oma = c(0, 0, 1.1, 0))
plot(mylm, las = 1, sub='Residual Diagnostics')
par(opar)
dev.off()
if (n > n25) {
bitmap(file='test9.png')
plot(kp3:nmkm3,gqarr[,2], main='Goldfeld-Quandt test',ylab='2-sided p-value',xlab='breakpoint')
grid()
dev.off()
}
load(file='createtable')
a<-table.start()
a<-table.row.start(a)
a<-table.element(a, 'Multiple Linear Regression - Estimated Regression Equation', 1, TRUE)
a<-table.row.end(a)
myeq <- colnames(x)[1]
myeq <- paste(myeq, '[t] = ', sep='')
for (i in 1:k){
if (mysum$coefficients[i,1] > 0) myeq <- paste(myeq, '+', '')
myeq <- paste(myeq, mysum$coefficients[i,1], sep=' ')
if (rownames(mysum$coefficients)[i] != '(Intercept)') {
myeq <- paste(myeq, rownames(mysum$coefficients)[i], sep='')
if (rownames(mysum$coefficients)[i] != 't') myeq <- paste(myeq, '[t]', sep='')
}
}
myeq <- paste(myeq, ' + e[t]')
a<-table.row.start(a)
a<-table.element(a, myeq)
a<-table.row.end(a)
a<-table.end(a)
table.save(a,file='mytable1.tab')
a<-table.start()
a<-table.row.start(a)
a<-table.element(a,hyperlink('ols1.htm','Multiple Linear Regression - Ordinary Least Squares',''), 6, TRUE)
a<-table.row.end(a)
a<-table.row.start(a)
a<-table.element(a,'Variable',header=TRUE)
a<-table.element(a,'Parameter',header=TRUE)
a<-table.element(a,'S.D.',header=TRUE)
a<-table.element(a,'T-STAT
H0: parameter = 0',header=TRUE)
a<-table.element(a,'2-tail p-value',header=TRUE)
a<-table.element(a,'1-tail p-value',header=TRUE)
a<-table.row.end(a)
for (i in 1:k){
a<-table.row.start(a)
a<-table.element(a,rownames(mysum$coefficients)[i],header=TRUE)
a<-table.element(a,mysum$coefficients[i,1])
a<-table.element(a, round(mysum$coefficients[i,2],6))
a<-table.element(a, round(mysum$coefficients[i,3],4))
a<-table.element(a, round(mysum$coefficients[i,4],6))
a<-table.element(a, round(mysum$coefficients[i,4]/2,6))
a<-table.row.end(a)
}
a<-table.end(a)
table.save(a,file='mytable2.tab')
a<-table.start()
a<-table.row.start(a)
a<-table.element(a, 'Multiple Linear Regression - Regression Statistics', 2, TRUE)
a<-table.row.end(a)
a<-table.row.start(a)
a<-table.element(a, 'Multiple R',1,TRUE)
a<-table.element(a, sqrt(mysum$r.squared))
a<-table.row.end(a)
a<-table.row.start(a)
a<-table.element(a, 'R-squared',1,TRUE)
a<-table.element(a, mysum$r.squared)
a<-table.row.end(a)
a<-table.row.start(a)
a<-table.element(a, 'Adjusted R-squared',1,TRUE)
a<-table.element(a, mysum$adj.r.squared)
a<-table.row.end(a)
a<-table.row.start(a)
a<-table.element(a, 'F-TEST (value)',1,TRUE)
a<-table.element(a, mysum$fstatistic[1])
a<-table.row.end(a)
a<-table.row.start(a)
a<-table.element(a, 'F-TEST (DF numerator)',1,TRUE)
a<-table.element(a, mysum$fstatistic[2])
a<-table.row.end(a)
a<-table.row.start(a)
a<-table.element(a, 'F-TEST (DF denominator)',1,TRUE)
a<-table.element(a, mysum$fstatistic[3])
a<-table.row.end(a)
a<-table.row.start(a)
a<-table.element(a, 'p-value',1,TRUE)
a<-table.element(a, 1-pf(mysum$fstatistic[1],mysum$fstatistic[2],mysum$fstatistic[3]))
a<-table.row.end(a)
a<-table.row.start(a)
a<-table.element(a, 'Multiple Linear Regression - Residual Statistics', 2, TRUE)
a<-table.row.end(a)
a<-table.row.start(a)
a<-table.element(a, 'Residual Standard Deviation',1,TRUE)
a<-table.element(a, mysum$sigma)
a<-table.row.end(a)
a<-table.row.start(a)
a<-table.element(a, 'Sum Squared Residuals',1,TRUE)
a<-table.element(a, sum(myerror*myerror))
a<-table.row.end(a)
a<-table.end(a)
table.save(a,file='mytable3.tab')
a<-table.start()
a<-table.row.start(a)
a<-table.element(a, 'Multiple Linear Regression - Actuals, Interpolation, and Residuals', 4, TRUE)
a<-table.row.end(a)
a<-table.row.start(a)
a<-table.element(a, 'Time or Index', 1, TRUE)
a<-table.element(a, 'Actuals', 1, TRUE)
a<-table.element(a, 'Interpolation
Forecast', 1, TRUE)
a<-table.element(a, 'Residuals
Prediction Error', 1, TRUE)
a<-table.row.end(a)
for (i in 1:n) {
a<-table.row.start(a)
a<-table.element(a,i, 1, TRUE)
a<-table.element(a,x[i])
a<-table.element(a,x[i]-mysum$resid[i])
a<-table.element(a,mysum$resid[i])
a<-table.row.end(a)
}
a<-table.end(a)
table.save(a,file='mytable4.tab')
if (n > n25) {
a<-table.start()
a<-table.row.start(a)
a<-table.element(a,'Goldfeld-Quandt test for Heteroskedasticity',4,TRUE)
a<-table.row.end(a)
a<-table.row.start(a)
a<-table.element(a,'p-values',header=TRUE)
a<-table.element(a,'Alternative Hypothesis',3,header=TRUE)
a<-table.row.end(a)
a<-table.row.start(a)
a<-table.element(a,'breakpoint index',header=TRUE)
a<-table.element(a,'greater',header=TRUE)
a<-table.element(a,'2-sided',header=TRUE)
a<-table.element(a,'less',header=TRUE)
a<-table.row.end(a)
for (mypoint in kp3:nmkm3) {
a<-table.row.start(a)
a<-table.element(a,mypoint,header=TRUE)
a<-table.element(a,gqarr[mypoint-kp3+1,1])
a<-table.element(a,gqarr[mypoint-kp3+1,2])
a<-table.element(a,gqarr[mypoint-kp3+1,3])
a<-table.row.end(a)
}
a<-table.end(a)
table.save(a,file='mytable5.tab')
a<-table.start()
a<-table.row.start(a)
a<-table.element(a,'Meta Analysis of Goldfeld-Quandt test for Heteroskedasticity',4,TRUE)
a<-table.row.end(a)
a<-table.row.start(a)
a<-table.element(a,'Description',header=TRUE)
a<-table.element(a,'# significant tests',header=TRUE)
a<-table.element(a,'% significant tests',header=TRUE)
a<-table.element(a,'OK/NOK',header=TRUE)
a<-table.row.end(a)
a<-table.row.start(a)
a<-table.element(a,'1% type I error level',header=TRUE)
a<-table.element(a,numsignificant1)
a<-table.element(a,numsignificant1/numgqtests)
if (numsignificant1/numgqtests < 0.01) dum <- 'OK' else dum <- 'NOK'
a<-table.element(a,dum)
a<-table.row.end(a)
a<-table.row.start(a)
a<-table.element(a,'5% type I error level',header=TRUE)
a<-table.element(a,numsignificant5)
a<-table.element(a,numsignificant5/numgqtests)
if (numsignificant5/numgqtests < 0.05) dum <- 'OK' else dum <- 'NOK'
a<-table.element(a,dum)
a<-table.row.end(a)
a<-table.row.start(a)
a<-table.element(a,'10% type I error level',header=TRUE)
a<-table.element(a,numsignificant10)
a<-table.element(a,numsignificant10/numgqtests)
if (numsignificant10/numgqtests < 0.1) dum <- 'OK' else dum <- 'NOK'
a<-table.element(a,dum)
a<-table.row.end(a)
a<-table.end(a)
table.save(a,file='mytable6.tab')
}