| Multiple Linear Regression - Estimated Regression Equation |
| PS[t] = + 3.77763738061614 -0.0133949634614039LS[t] + 0.00137031210793506BW[t] + 0.000296123778267419BRW[t] -0.00500701775504269GT[t] + 0.900361471653856PI[t] + 0.360021324193483SEI[t] -1.73845778307009OD[t] + e[t] |
| Multiple Linear Regression - Ordinary Least Squares | |||||
| Variable | Parameter | S.D. | T-STAT H0: parameter = 0 | 2-tail p-value | 1-tail p-value |
| (Intercept) | 3.77763738061614 | 0.413268 | 9.1409 | 0 | 0 |
| LS | -0.0133949634614039 | 0.014311 | -0.936 | 0.355869 | 0.177935 |
| BW | 0.00137031210793506 | 0.001831 | 0.7483 | 0.459434 | 0.229717 |
| BRW | 0.000296123778267419 | 0.001099 | 0.2694 | 0.789227 | 0.394614 |
| GT | -0.00500701775504269 | 0.002158 | -2.3197 | 0.026497 | 0.013248 |
| PI | 0.900361471653856 | 0.337906 | 2.6645 | 0.011704 | 0.005852 |
| SEI | 0.360021324193483 | 0.211701 | 1.7006 | 0.098147 | 0.049074 |
| OD | -1.73845778307009 | 0.419569 | -4.1434 | 0.000214 | 0.000107 |
| Multiple Linear Regression - Regression Statistics | |
| Multiple R | 0.787651358957768 |
| R-squared | 0.620394663268018 |
| Adjusted R-squared | 0.54224062335261 |
| F-TEST (value) | 7.93810101102281 |
| F-TEST (DF numerator) | 7 |
| F-TEST (DF denominator) | 34 |
| p-value | 1.06575639513551e-05 |
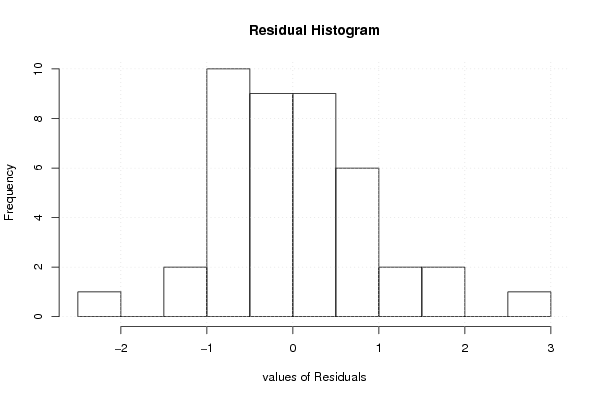
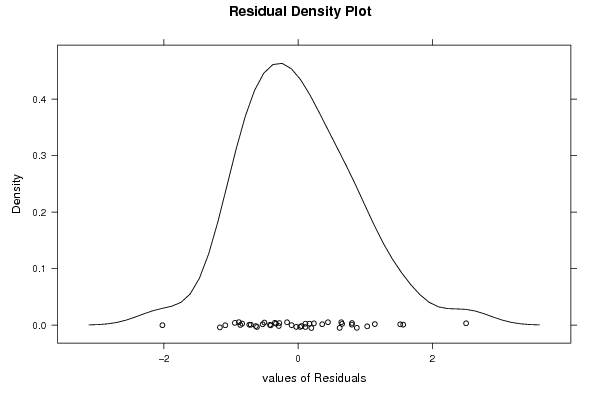
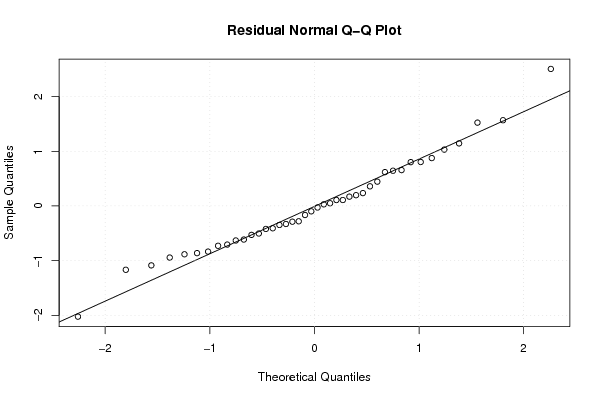
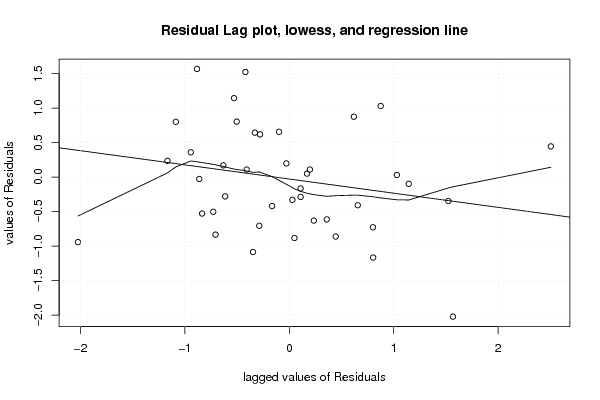
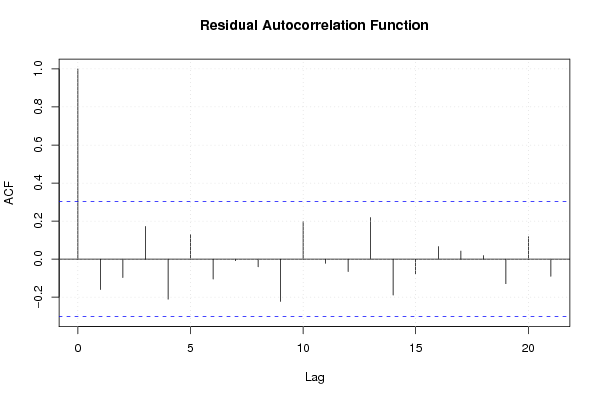
| Multiple Linear Regression - Residual Statistics | |
| Residual Standard Deviation | 0.939636820152983 |
| Sum Squared Residuals | 30.0191900287651 |
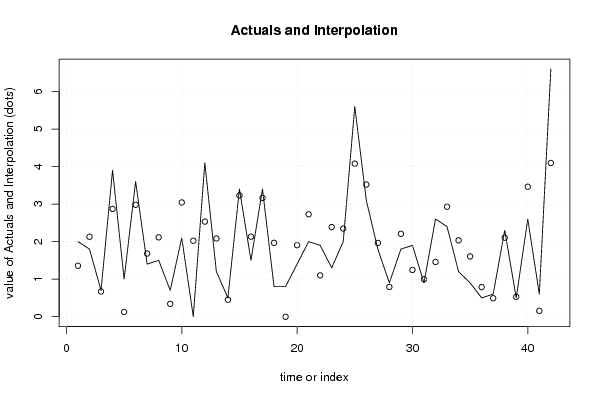
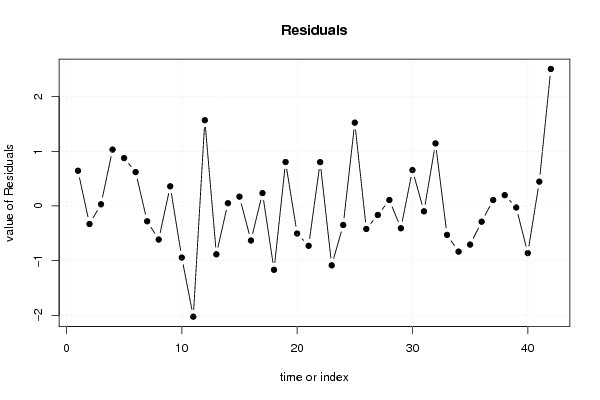
| Multiple Linear Regression - Actuals, Interpolation, and Residuals | |||
| Time or Index | Actuals | Interpolation Forecast | Residuals Prediction Error |
| 1 | 2 | 1.3561224183173 | 0.643877581682701 |
| 2 | 1.8 | 2.12960841655679 | -0.329608416556788 |
| 3 | 0.7 | 0.670021233297254 | 0.0299787667027456 |
| 4 | 3.9 | 2.86993282051218 | 1.03006717948782 |
| 5 | 1 | 0.124695762512002 | 0.875304237487998 |
| 6 | 3.6 | 2.98118542077970 | 0.618814579220296 |
| 7 | 1.4 | 1.67997007865093 | -0.279970078650931 |
| 8 | 1.5 | 2.11362574541116 | -0.613625745411159 |
| 9 | 0.7 | 0.340897039890184 | 0.359102960109816 |
| 10 | 2.1 | 3.0428433975087 | -0.942843397508697 |
| 11 | 0 | 2.02305676673973 | -2.02305676673973 |
| 12 | 4.1 | 2.53293500791908 | 1.56706499208092 |
| 13 | 1.2 | 2.08309233687984 | -0.883092336879836 |
| 14 | 0.5 | 0.450281614934216 | 0.0497183850657844 |
| 15 | 3.4 | 3.22993547328207 | 0.170064526717932 |
| 16 | 1.5 | 2.13095279291095 | -0.630952792910953 |
| 17 | 3.4 | 3.16466444221077 | 0.235335557789233 |
| 18 | 0.8 | 1.96645245490865 | -1.16645245490865 |
| 19 | 0.8 | -0.0033701574172218 | 0.803370157417222 |
| 20 | 1.4 | 1.90322677714845 | -0.503226777148446 |
| 21 | 2 | 2.72782011663321 | -0.727820116633206 |
| 22 | 1.9 | 1.09903504466157 | 0.800964955338435 |
| 23 | 1.3 | 2.38588398848226 | -1.08588398848226 |
| 24 | 2 | 2.34689427846869 | -0.346894278468690 |
| 25 | 5.6 | 4.07705994506629 | 1.52294005493371 |
| 26 | 3.1 | 3.52000870112606 | -0.420008701126056 |
| 27 | 1.8 | 1.96501302730277 | -0.165013027302765 |
| 28 | 0.9 | 0.791323507027615 | 0.108676492972385 |
| 29 | 1.8 | 2.20780797183028 | -0.407807971830278 |
| 30 | 1.9 | 1.24426858124898 | 0.65573141875102 |
| 31 | 0.9 | 0.997944429777654 | -0.0979444297776535 |
| 32 | 2.6 | 1.45621239200535 | 1.14378760799465 |
| 33 | 2.4 | 2.92865473841119 | -0.528654738411193 |
| 34 | 1.2 | 2.03422815680023 | -0.83422815680023 |
| 35 | 0.9 | 1.60581372360984 | -0.705813723609843 |
| 36 | 0.5 | 0.787594042033552 | -0.287594042033552 |
| 37 | 0.6 | 0.491177477450044 | 0.108822522549956 |
| 38 | 2.3 | 2.10277088381891 | 0.197229116181091 |
| 39 | 0.5 | 0.527886940280407 | -0.0278869402804072 |
| 40 | 2.6 | 3.46160046703619 | -0.861600467036191 |
| 41 | 0.6 | 0.155280042770744 | 0.444719957229256 |
| 42 | 6.6 | 4.09559170120545 | 2.50440829879455 |
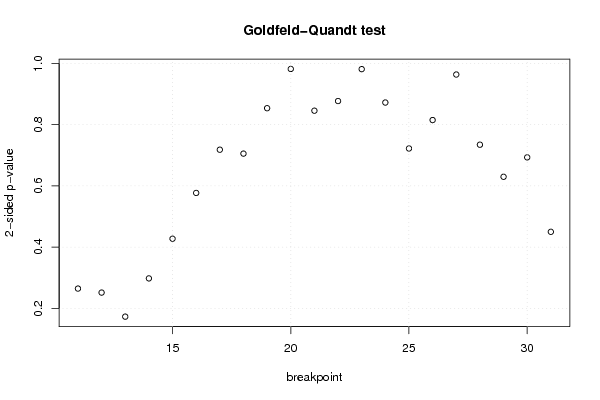
| Goldfeld-Quandt test for Heteroskedasticity | |||
| p-values | Alternative Hypothesis | ||
| breakpoint index | greater | 2-sided | less |
| 11 | 0.867792319701568 | 0.264415360596863 | 0.132207680298432 |
| 12 | 0.87435411602056 | 0.251291767958879 | 0.125645883979439 |
| 13 | 0.913669484051028 | 0.172661031897945 | 0.0863305159489724 |
| 14 | 0.851153651604207 | 0.297692696791587 | 0.148846348395793 |
| 15 | 0.78635314205445 | 0.427293715891101 | 0.213646857945551 |
| 16 | 0.71159120203052 | 0.57681759593896 | 0.28840879796948 |
| 17 | 0.640943346499543 | 0.718113307000913 | 0.359056653500457 |
| 18 | 0.647327813597236 | 0.705344372805529 | 0.352672186402764 |
| 19 | 0.573130128334434 | 0.853739743331132 | 0.426869871665566 |
| 20 | 0.49102338337574 | 0.98204676675148 | 0.50897661662426 |
| 21 | 0.422814367987739 | 0.845628735975478 | 0.577185632012261 |
| 22 | 0.438615803212461 | 0.877231606424922 | 0.561384196787539 |
| 23 | 0.509296993154059 | 0.981406013691882 | 0.490703006845941 |
| 24 | 0.563843008462008 | 0.872313983075983 | 0.436156991537992 |
| 25 | 0.638903524800384 | 0.722192950399231 | 0.361096475199616 |
| 26 | 0.592490286809026 | 0.815019426381948 | 0.407509713190974 |
| 27 | 0.481925069706886 | 0.963850139413772 | 0.518074930293114 |
| 28 | 0.367235106157113 | 0.734470212314227 | 0.632764893842887 |
| 29 | 0.314846356572056 | 0.629692713144112 | 0.685153643427944 |
| 30 | 0.346589670255331 | 0.693179340510661 | 0.65341032974467 |
| 31 | 0.224940433304570 | 0.449880866609139 | 0.77505956669543 |
| Meta Analysis of Goldfeld-Quandt test for Heteroskedasticity | |||
| Description | # significant tests | % significant tests | OK/NOK |
| 1% type I error level | 0 | 0 | OK |
| 5% type I error level | 0 | 0 | OK |
| 10% type I error level | 0 | 0 | OK |