Free Statistics

of Irreproducible Research!

Author's title

Author*The author of this computation has been verified*
R Software Modulerwasp_regression_trees1.wasp
Title produced by softwareRecursive Partitioning (Regression Trees)
Date of computationTue, 14 Dec 2010 22:46:07 +0000
Cite this page as followsStatistical Computations at FreeStatistics.org, Office for Research Development and Education, URL https://freestatistics.org/blog/index.php?v=date/2010/Dec/14/t129236665915cjunmqdqgcgca.htm/, Retrieved Thu, 02 May 2024 20:29:57 +0000
Statistical Computations at FreeStatistics.org, Office for Research Development and Education, URL https://freestatistics.org/blog/index.php?pk=110269, Retrieved Thu, 02 May 2024 20:29:57 +0000
QR Codes:

Original text written by user:
IsPrivate?No (this computation is public)
User-defined keywords
Estimated Impact104
Family? (F = Feedback message, R = changed R code, M = changed R Module, P = changed Parameters, D = changed Data)
-     [Recursive Partitioning (Regression Trees)] [] [2010-12-05 18:59:57] [b98453cac15ba1066b407e146608df68]
-   PD  [Recursive Partitioning (Regression Trees)] [Recursive Partiti...] [2010-12-14 16:43:30] [8d09066a9d3795298da6860e7d4a4400]
-           [Recursive Partitioning (Regression Trees)] [Recursive Partiti...] [2010-12-14 22:46:07] [1b6bbf3cf94635fe119752c144706ab0] [Current]
Feedback Forum

Post a new message
Dataseries X:
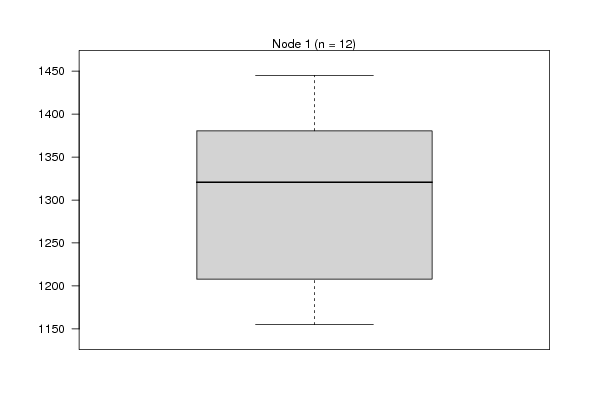
1424	863	1045	1283	583
1445	813	1005	1243	530
1398	821	995	1171	567
1302	772	998	1103	533
1232	719	887	1119	513
1238	673	831	1037	512
1171	670	857	1050	465
1155	708	858	1010	470
1184	682	845	969	508
1363	760	921	1090	514
1339	832	943	1212	526
1339	755	1057	1170	566


Summary of computational transaction
Raw Inputview raw input (R code)
Raw Outputview raw output of R engine
Computing time3 seconds
R Server'RServer@AstonUniversity' @ vre.aston.ac.uk

\begin{tabular}{lllllllll}
\hline
Summary of computational transaction \tabularnewline
Raw Input & view raw input (R code)  \tabularnewline
Raw Output & view raw output of R engine  \tabularnewline
Computing time & 3 seconds \tabularnewline
R Server & 'RServer@AstonUniversity' @ vre.aston.ac.uk \tabularnewline
\hline
\end{tabular}
%Source: https://freestatistics.org/blog/index.php?pk=110269&T=0

[TABLE]
[ROW][C]Summary of computational transaction[/C][/ROW]
[ROW][C]Raw Input[/C][C]view raw input (R code) [/C][/ROW]
[ROW][C]Raw Output[/C][C]view raw output of R engine [/C][/ROW]
[ROW][C]Computing time[/C][C]3 seconds[/C][/ROW]
[ROW][C]R Server[/C][C]'RServer@AstonUniversity' @ vre.aston.ac.uk[/C][/ROW]
[/TABLE]
Source: https://freestatistics.org/blog/index.php?pk=110269&T=0

Globally Unique Identifier (entire table): ba.freestatistics.org/blog/index.php?pk=110269&T=0

As an alternative you can also use a QR Code:  

The GUIDs for individual cells are displayed in the table below:

Summary of computational transaction
Raw Inputview raw input (R code)
Raw Outputview raw output of R engine
Computing time3 seconds
R Server'RServer@AstonUniversity' @ vre.aston.ac.uk


Goodness of Fit
CorrelationNA
R-squaredNA
RMSE96.8683

\begin{tabular}{lllllllll}
\hline
Goodness of Fit \tabularnewline
Correlation & NA \tabularnewline
R-squared & NA \tabularnewline
RMSE & 96.8683 \tabularnewline
\hline
\end{tabular}
%Source: https://freestatistics.org/blog/index.php?pk=110269&T=1

[TABLE]
[ROW][C]Goodness of Fit[/C][/ROW]
[ROW][C]Correlation[/C][C]NA[/C][/ROW]
[ROW][C]R-squared[/C][C]NA[/C][/ROW]
[ROW][C]RMSE[/C][C]96.8683[/C][/ROW]
[/TABLE]
Source: https://freestatistics.org/blog/index.php?pk=110269&T=1

Globally Unique Identifier (entire table): ba.freestatistics.org/blog/index.php?pk=110269&T=1

As an alternative you can also use a QR Code:  

The GUIDs for individual cells are displayed in the table below:

Goodness of Fit
CorrelationNA
R-squaredNA
RMSE96.8683


Actuals, Predictions, and Residuals
#ActualsForecastsResiduals
114241299.16666666667124.833333333333
214451299.16666666667145.833333333333
313981299.1666666666798.8333333333333
413021299.166666666672.83333333333326
512321299.16666666667-67.1666666666667
612381299.16666666667-61.1666666666667
711711299.16666666667-128.166666666667
811551299.16666666667-144.166666666667
911841299.16666666667-115.166666666667
1013631299.1666666666763.8333333333333
1113391299.1666666666739.8333333333333
1213391299.1666666666739.8333333333333

\begin{tabular}{lllllllll}
\hline
Actuals, Predictions, and Residuals \tabularnewline
# & Actuals & Forecasts & Residuals \tabularnewline
1 & 1424 & 1299.16666666667 & 124.833333333333 \tabularnewline
2 & 1445 & 1299.16666666667 & 145.833333333333 \tabularnewline
3 & 1398 & 1299.16666666667 & 98.8333333333333 \tabularnewline
4 & 1302 & 1299.16666666667 & 2.83333333333326 \tabularnewline
5 & 1232 & 1299.16666666667 & -67.1666666666667 \tabularnewline
6 & 1238 & 1299.16666666667 & -61.1666666666667 \tabularnewline
7 & 1171 & 1299.16666666667 & -128.166666666667 \tabularnewline
8 & 1155 & 1299.16666666667 & -144.166666666667 \tabularnewline
9 & 1184 & 1299.16666666667 & -115.166666666667 \tabularnewline
10 & 1363 & 1299.16666666667 & 63.8333333333333 \tabularnewline
11 & 1339 & 1299.16666666667 & 39.8333333333333 \tabularnewline
12 & 1339 & 1299.16666666667 & 39.8333333333333 \tabularnewline
\hline
\end{tabular}
%Source: https://freestatistics.org/blog/index.php?pk=110269&T=2

[TABLE]
[ROW][C]Actuals, Predictions, and Residuals[/C][/ROW]
[ROW][C]#[/C][C]Actuals[/C][C]Forecasts[/C][C]Residuals[/C][/ROW]
[ROW][C]1[/C][C]1424[/C][C]1299.16666666667[/C][C]124.833333333333[/C][/ROW]
[ROW][C]2[/C][C]1445[/C][C]1299.16666666667[/C][C]145.833333333333[/C][/ROW]
[ROW][C]3[/C][C]1398[/C][C]1299.16666666667[/C][C]98.8333333333333[/C][/ROW]
[ROW][C]4[/C][C]1302[/C][C]1299.16666666667[/C][C]2.83333333333326[/C][/ROW]
[ROW][C]5[/C][C]1232[/C][C]1299.16666666667[/C][C]-67.1666666666667[/C][/ROW]
[ROW][C]6[/C][C]1238[/C][C]1299.16666666667[/C][C]-61.1666666666667[/C][/ROW]
[ROW][C]7[/C][C]1171[/C][C]1299.16666666667[/C][C]-128.166666666667[/C][/ROW]
[ROW][C]8[/C][C]1155[/C][C]1299.16666666667[/C][C]-144.166666666667[/C][/ROW]
[ROW][C]9[/C][C]1184[/C][C]1299.16666666667[/C][C]-115.166666666667[/C][/ROW]
[ROW][C]10[/C][C]1363[/C][C]1299.16666666667[/C][C]63.8333333333333[/C][/ROW]
[ROW][C]11[/C][C]1339[/C][C]1299.16666666667[/C][C]39.8333333333333[/C][/ROW]
[ROW][C]12[/C][C]1339[/C][C]1299.16666666667[/C][C]39.8333333333333[/C][/ROW]
[/TABLE]
Source: https://freestatistics.org/blog/index.php?pk=110269&T=2

Globally Unique Identifier (entire table): ba.freestatistics.org/blog/index.php?pk=110269&T=2

As an alternative you can also use a QR Code:  

The GUIDs for individual cells are displayed in the table below:

Actuals, Predictions, and Residuals
#ActualsForecastsResiduals
114241299.16666666667124.833333333333
214451299.16666666667145.833333333333
313981299.1666666666798.8333333333333
413021299.166666666672.83333333333326
512321299.16666666667-67.1666666666667
612381299.16666666667-61.1666666666667
711711299.16666666667-128.166666666667
811551299.16666666667-144.166666666667
911841299.16666666667-115.166666666667
1013631299.1666666666763.8333333333333
1113391299.1666666666739.8333333333333
1213391299.1666666666739.8333333333333


Parameters (Session):
par1 = 1 ; par2 = none ; par3 = 4 ; par4 = no ;
Parameters (R input):
par1 = 1 ; par2 = none ; par3 = 4 ; par4 = no ;
R code (references can be found in the software module):
library(party)
library(Hmisc)
par1 <- as.numeric(par1)
par3 <- as.numeric(par3)
x <- data.frame(t(y))
is.data.frame(x)
x <- x[!is.na(x[,par1]),]
k <- length(x[1,])
n <- length(x[,1])
colnames(x)[par1]
x[,par1]
if (par2 == 'kmeans') {
cl <- kmeans(x[,par1], par3)
print(cl)
clm <- matrix(cbind(cl$centers,1:par3),ncol=2)
clm <- clm[sort.list(clm[,1]),]
for (i in 1:par3) {
cl$cluster[cl$cluster==clm[i,2]] <- paste('C',i,sep='')
}
cl$cluster <- as.factor(cl$cluster)
print(cl$cluster)
x[,par1] <- cl$cluster
}
if (par2 == 'quantiles') {
x[,par1] <- cut2(x[,par1],g=par3)
}
if (par2 == 'hclust') {
hc <- hclust(dist(x[,par1])^2, 'cen')
print(hc)
memb <- cutree(hc, k = par3)
dum <- c(mean(x[memb==1,par1]))
for (i in 2:par3) {
dum <- c(dum, mean(x[memb==i,par1]))
}
hcm <- matrix(cbind(dum,1:par3),ncol=2)
hcm <- hcm[sort.list(hcm[,1]),]
for (i in 1:par3) {
memb[memb==hcm[i,2]] <- paste('C',i,sep='')
}
memb <- as.factor(memb)
print(memb)
x[,par1] <- memb
}
if (par2=='equal') {
ed <- cut(as.numeric(x[,par1]),par3,labels=paste('C',1:par3,sep=''))
x[,par1] <- as.factor(ed)
}
table(x[,par1])
colnames(x)
colnames(x)[par1]
x[,par1]
if (par2 == 'none') {
m <- ctree(as.formula(paste(colnames(x)[par1],' ~ .',sep='')),data = x)
}
load(file='createtable')
if (par2 != 'none') {
m <- ctree(as.formula(paste('as.factor(',colnames(x)[par1],') ~ .',sep='')),data = x)
if (par4=='yes') {
a<-table.start()
a<-table.row.start(a)
a<-table.element(a,'10-Fold Cross Validation',3+2*par3,TRUE)
a<-table.row.end(a)
a<-table.row.start(a)
a<-table.element(a,'',1,TRUE)
a<-table.element(a,'Prediction (training)',par3+1,TRUE)
a<-table.element(a,'Prediction (testing)',par3+1,TRUE)
a<-table.row.end(a)
a<-table.row.start(a)
a<-table.element(a,'Actual',1,TRUE)
for (jjj in 1:par3) a<-table.element(a,paste('C',jjj,sep=''),1,TRUE)
a<-table.element(a,'CV',1,TRUE)
for (jjj in 1:par3) a<-table.element(a,paste('C',jjj,sep=''),1,TRUE)
a<-table.element(a,'CV',1,TRUE)
a<-table.row.end(a)
for (i in 1:10) {
ind <- sample(2, nrow(x), replace=T, prob=c(0.9,0.1))
m.ct <- ctree(as.formula(paste('as.factor(',colnames(x)[par1],') ~ .',sep='')),data =x[ind==1,])
if (i==1) {
m.ct.i.pred <- predict(m.ct, newdata=x[ind==1,])
m.ct.i.actu <- x[ind==1,par1]
m.ct.x.pred <- predict(m.ct, newdata=x[ind==2,])
m.ct.x.actu <- x[ind==2,par1]
} else {
m.ct.i.pred <- c(m.ct.i.pred,predict(m.ct, newdata=x[ind==1,]))
m.ct.i.actu <- c(m.ct.i.actu,x[ind==1,par1])
m.ct.x.pred <- c(m.ct.x.pred,predict(m.ct, newdata=x[ind==2,]))
m.ct.x.actu <- c(m.ct.x.actu,x[ind==2,par1])
}
}
print(m.ct.i.tab <- table(m.ct.i.actu,m.ct.i.pred))
numer <- 0
for (i in 1:par3) {
print(m.ct.i.tab[i,i] / sum(m.ct.i.tab[i,]))
numer <- numer + m.ct.i.tab[i,i]
}
print(m.ct.i.cp <- numer / sum(m.ct.i.tab))
print(m.ct.x.tab <- table(m.ct.x.actu,m.ct.x.pred))
numer <- 0
for (i in 1:par3) {
print(m.ct.x.tab[i,i] / sum(m.ct.x.tab[i,]))
numer <- numer + m.ct.x.tab[i,i]
}
print(m.ct.x.cp <- numer / sum(m.ct.x.tab))
for (i in 1:par3) {
a<-table.row.start(a)
a<-table.element(a,paste('C',i,sep=''),1,TRUE)
for (jjj in 1:par3) a<-table.element(a,m.ct.i.tab[i,jjj])
a<-table.element(a,round(m.ct.i.tab[i,i]/sum(m.ct.i.tab[i,]),4))
for (jjj in 1:par3) a<-table.element(a,m.ct.x.tab[i,jjj])
a<-table.element(a,round(m.ct.x.tab[i,i]/sum(m.ct.x.tab[i,]),4))
a<-table.row.end(a)
}
a<-table.row.start(a)
a<-table.element(a,'Overall',1,TRUE)
for (jjj in 1:par3) a<-table.element(a,'-')
a<-table.element(a,round(m.ct.i.cp,4))
for (jjj in 1:par3) a<-table.element(a,'-')
a<-table.element(a,round(m.ct.x.cp,4))
a<-table.row.end(a)
a<-table.end(a)
table.save(a,file='mytable3.tab')
}
}
m
bitmap(file='test1.png')
plot(m)
dev.off()
bitmap(file='test1a.png')
plot(x[,par1] ~ as.factor(where(m)),main='Response by Terminal Node',xlab='Terminal Node',ylab='Response')
dev.off()
if (par2 == 'none') {
forec <- predict(m)
result <- as.data.frame(cbind(x[,par1],forec,x[,par1]-forec))
colnames(result) <- c('Actuals','Forecasts','Residuals')
print(result)
}
if (par2 != 'none') {
print(cbind(as.factor(x[,par1]),predict(m)))
myt <- table(as.factor(x[,par1]),predict(m))
print(myt)
}
bitmap(file='test2.png')
if(par2=='none') {
op <- par(mfrow=c(2,2))
plot(density(result$Actuals),main='Kernel Density Plot of Actuals')
plot(density(result$Residuals),main='Kernel Density Plot of Residuals')
plot(result$Forecasts,result$Actuals,main='Actuals versus Predictions',xlab='Predictions',ylab='Actuals')
plot(density(result$Forecasts),main='Kernel Density Plot of Predictions')
par(op)
}
if(par2!='none') {
plot(myt,main='Confusion Matrix',xlab='Actual',ylab='Predicted')
}
dev.off()
if (par2 == 'none') {
detcoef <- cor(result$Forecasts,result$Actuals)
a<-table.start()
a<-table.row.start(a)
a<-table.element(a,'Goodness of Fit',2,TRUE)
a<-table.row.end(a)
a<-table.row.start(a)
a<-table.element(a,'Correlation',1,TRUE)
a<-table.element(a,round(detcoef,4))
a<-table.row.end(a)
a<-table.row.start(a)
a<-table.element(a,'R-squared',1,TRUE)
a<-table.element(a,round(detcoef*detcoef,4))
a<-table.row.end(a)
a<-table.row.start(a)
a<-table.element(a,'RMSE',1,TRUE)
a<-table.element(a,round(sqrt(mean((result$Residuals)^2)),4))
a<-table.row.end(a)
a<-table.end(a)
table.save(a,file='mytable1.tab')
a<-table.start()
a<-table.row.start(a)
a<-table.element(a,'Actuals, Predictions, and Residuals',4,TRUE)
a<-table.row.end(a)
a<-table.row.start(a)
a<-table.element(a,'#',header=TRUE)
a<-table.element(a,'Actuals',header=TRUE)
a<-table.element(a,'Forecasts',header=TRUE)
a<-table.element(a,'Residuals',header=TRUE)
a<-table.row.end(a)
for (i in 1:length(result$Actuals)) {
a<-table.row.start(a)
a<-table.element(a,i,header=TRUE)
a<-table.element(a,result$Actuals[i])
a<-table.element(a,result$Forecasts[i])
a<-table.element(a,result$Residuals[i])
a<-table.row.end(a)
}
a<-table.end(a)
table.save(a,file='mytable.tab')
}
if (par2 != 'none') {
a<-table.start()
a<-table.row.start(a)
a<-table.element(a,'Confusion Matrix (predicted in columns / actuals in rows)',par3+1,TRUE)
a<-table.row.end(a)
a<-table.row.start(a)
a<-table.element(a,'',1,TRUE)
for (i in 1:par3) {
a<-table.element(a,paste('C',i,sep=''),1,TRUE)
}
a<-table.row.end(a)
for (i in 1:par3) {
a<-table.row.start(a)
a<-table.element(a,paste('C',i,sep=''),1,TRUE)
for (j in 1:par3) {
a<-table.element(a,myt[i,j])
}
a<-table.row.end(a)
}
a<-table.end(a)
table.save(a,file='mytable2.tab')
}