| Multiple Linear Regression - Estimated Regression Equation |
| Mayonaise[t] = + 2.47865060894444 -0.465444129700099Eieren[t] -0.0988998564557219Olijfolie[t] + 0.413491668082886Mosterd[t] + e[t] |
| Multiple Linear Regression - Ordinary Least Squares | |||||
| Variable | Parameter | S.D. | T-STAT H0: parameter = 0 | 2-tail p-value | 1-tail p-value |
| (Intercept) | 2.47865060894444 | 0.818087 | 3.0298 | 0.003806 | 0.001903 |
| Eieren | -0.465444129700099 | 1.326341 | -0.3509 | 0.727064 | 0.363532 |
| Olijfolie | -0.0988998564557219 | 0.098111 | -1.008 | 0.318104 | 0.159052 |
| Mosterd | 0.413491668082886 | 0.091171 | 4.5354 | 3.4e-05 | 1.7e-05 |
| Multiple Linear Regression - Regression Statistics | |
| Multiple R | 0.831522318599948 |
| R-squared | 0.691429366329834 |
| Adjusted R-squared | 0.673627214387324 |
| F-TEST (value) | 38.8396508783175 |
| F-TEST (DF numerator) | 3 |
| F-TEST (DF denominator) | 52 |
| p-value | 2.58681964737661e-13 |
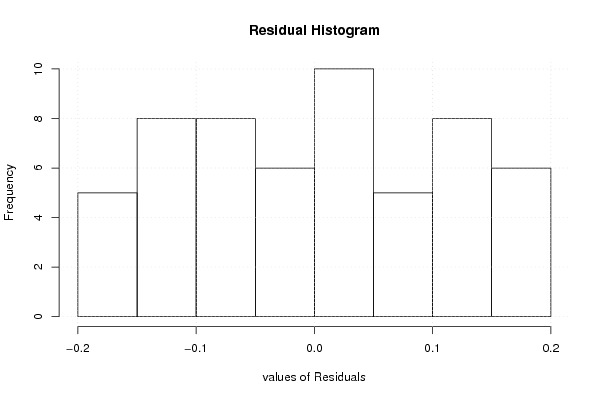
| Multiple Linear Regression - Residual Statistics | |
| Residual Standard Deviation | 0.112734946676432 |
| Sum Squared Residuals | 0.660876746511169 |
| Multiple Linear Regression - Actuals, Interpolation, and Residuals | |||
| Time or Index | Actuals | Interpolation Forecast | Residuals Prediction Error |
| 1 | 3.18 | 3.22664552249524 | -0.0466455224952405 |
| 2 | 3.14 | 3.22430968052093 | -0.08430968052093 |
| 3 | 3.02 | 3.21255332684943 | -0.192553326849429 |
| 4 | 3.02 | 3.20673096456527 | -0.186730964565271 |
| 5 | 3.03 | 3.20108752470371 | -0.171087524703713 |
| 6 | 3.04 | 3.20854728192341 | -0.168547281923413 |
| 7 | 3.09 | 3.1897390665452 | -0.099739066545198 |
| 8 | 3.06 | 3.17319939982188 | -0.113199399821882 |
| 9 | 3.06 | 3.18331835855784 | -0.123318358557842 |
| 10 | 3.09 | 3.18779387743224 | -0.0977938774322427 |
| 11 | 3.11 | 3.1818598860449 | -0.0718598860448994 |
| 12 | 3.1 | 3.18581588030313 | -0.085815880303128 |
| 13 | 3.09 | 3.18435740779019 | -0.094357407790186 |
| 14 | 3.19 | 3.18435740779019 | 0.00564259220981405 |
| 15 | 3.22 | 3.15891675398586 | 0.0610832460141448 |
| 16 | 3.22 | 3.16305167066668 | 0.0569483293333158 |
| 17 | 3.25 | 3.15873783156326 | 0.0912621684367445 |
| 18 | 3.25 | 3.14570192780141 | 0.104298072198588 |
| 19 | 3.27 | 3.12188142628100 | 0.148118573719004 |
| 20 | 3.28 | 3.10237476386401 | 0.177625236135991 |
| 21 | 3.24 | 3.07756526377904 | 0.162434736220965 |
| 22 | 3.23 | 3.07522942180472 | 0.154770578195279 |
| 23 | 3.2 | 3.06533943615915 | 0.134660563840851 |
| 24 | 3.19 | 3.04978876800039 | 0.140211231999609 |
| 25 | 3.23 | 3.03971985993222 | 0.190280140067781 |
| 26 | 3.19 | 3.02632611132517 | 0.163673888674825 |
| 27 | 3.16 | 3.00960752217926 | 0.150392477820741 |
| 28 | 3.11 | 2.99684492729157 | 0.113155072708427 |
| 29 | 3.11 | 2.98048418299086 | 0.129515817009143 |
| 30 | 3.07 | 2.9649335148321 | 0.105066485167901 |
| 31 | 3.05 | 2.93133465676930 | 0.118665343230703 |
| 32 | 3 | 2.90587676031334 | 0.094123239686662 |
| 33 | 2.95 | 2.88421317834464 | 0.0657868216553636 |
| 34 | 2.9 | 2.87250687534092 | 0.0274931246590779 |
| 35 | 2.88 | 2.87023832668602 | 0.00976167331397747 |
| 36 | 2.9 | 2.87698239421532 | 0.0230176057846768 |
| 37 | 2.89 | 2.87273584843131 | 0.0172641515686910 |
| 38 | 2.89 | 2.86761193318592 | 0.0223880668140772 |
| 39 | 2.91 | 2.86976885273764 | 0.0402311472623627 |
| 40 | 2.9 | 2.86365593892769 | 0.0363440610723058 |
| 41 | 2.9 | 2.86761193318592 | 0.032388066814077 |
| 42 | 2.88 | 2.84484772354948 | 0.0351522764505207 |
| 43 | 2.83 | 2.83145397494244 | -0.00145397494243526 |
| 44 | 2.8 | 2.80933816167698 | -0.00933816167697668 |
| 45 | 2.77 | 2.79531325935058 | -0.0253132593505756 |
| 46 | 2.78 | 2.78740127083412 | -0.00740127083411803 |
| 47 | 2.75 | 2.78146727944677 | -0.0314672794467746 |
| 48 | 2.74 | 2.79124563598916 | -0.0512456359891613 |
| 49 | 2.73 | 2.78711071930833 | -0.0571107193083328 |
| 50 | 2.69 | 2.79421263168283 | -0.104212631682833 |
| 51 | 2.67 | 2.78711071930833 | -0.117110719308333 |
| 52 | 2.66 | 2.79106671356656 | -0.131066713566561 |
| 53 | 2.67 | 2.77463867594643 | -0.104638675946431 |
| 54 | 2.65 | 2.77642050800132 | -0.126420508001318 |
| 55 | 2.64 | 2.78523695911129 | -0.14523695911129 |
| 56 | 2.63 | 2.79378010134711 | -0.163780101347105 |
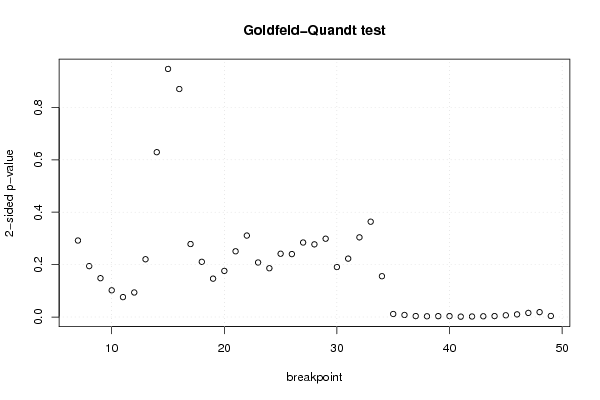
| Goldfeld-Quandt test for Heteroskedasticity | |||
| p-values | Alternative Hypothesis | ||
| breakpoint index | greater | 2-sided | less |
| 7 | 0.146002669927434 | 0.292005339854868 | 0.853997330072566 |
| 8 | 0.097144699141351 | 0.194289398282702 | 0.90285530085865 |
| 9 | 0.0741305099985305 | 0.148261019997061 | 0.92586949000147 |
| 10 | 0.0510292958698748 | 0.102058591739750 | 0.948970704130125 |
| 11 | 0.038082401495465 | 0.07616480299093 | 0.961917598504535 |
| 12 | 0.0468802807533737 | 0.0937605615067475 | 0.953119719246626 |
| 13 | 0.110268538791776 | 0.220537077583553 | 0.889731461208224 |
| 14 | 0.314506075558127 | 0.629012151116253 | 0.685493924441873 |
| 15 | 0.47329071588329 | 0.94658143176658 | 0.52670928411671 |
| 16 | 0.564994284914115 | 0.87001143017177 | 0.435005715085885 |
| 17 | 0.860726074682 | 0.278547850636001 | 0.139273925318000 |
| 18 | 0.894628035440256 | 0.210743929119487 | 0.105371964559743 |
| 19 | 0.926734001824748 | 0.146531996350503 | 0.0732659981752517 |
| 20 | 0.911928708075615 | 0.17614258384877 | 0.088071291924385 |
| 21 | 0.874523131408735 | 0.250953737182529 | 0.125476868591265 |
| 22 | 0.844550301916743 | 0.310899396166513 | 0.155449698083257 |
| 23 | 0.89589788953775 | 0.208204220924500 | 0.104102110462250 |
| 24 | 0.906878235103624 | 0.186243529792753 | 0.0931217648963763 |
| 25 | 0.879210853963584 | 0.241578292072832 | 0.120789146036416 |
| 26 | 0.879842459540326 | 0.240315080919347 | 0.120157540459674 |
| 27 | 0.857803492874558 | 0.284393014250884 | 0.142196507125442 |
| 28 | 0.86129523706117 | 0.277409525877661 | 0.138704762938831 |
| 29 | 0.850565794663001 | 0.298868410673998 | 0.149434205336999 |
| 30 | 0.904574523511161 | 0.190850952977677 | 0.0954254764888386 |
| 31 | 0.888559355350757 | 0.222881289298486 | 0.111440644649243 |
| 32 | 0.847936142528735 | 0.304127714942530 | 0.152063857471265 |
| 33 | 0.818102736782469 | 0.363794526435062 | 0.181897263217531 |
| 34 | 0.922076759693822 | 0.155846480612355 | 0.0779232403061775 |
| 35 | 0.994173242352802 | 0.0116535152943963 | 0.00582675764719816 |
| 36 | 0.996027473743152 | 0.0079450525136965 | 0.00397252625684825 |
| 37 | 0.998171139001843 | 0.00365772199631354 | 0.00182886099815677 |
| 38 | 0.99853801125671 | 0.0029239774865818 | 0.0014619887432909 |
| 39 | 0.998275892840308 | 0.00344821431938471 | 0.00172410715969235 |
| 40 | 0.998158748145203 | 0.0036825037095944 | 0.0018412518547972 |
| 41 | 0.999234127982965 | 0.00153174403406991 | 0.000765872017034953 |
| 42 | 0.998954642482063 | 0.00209071503587427 | 0.00104535751793714 |
| 43 | 0.998522776923168 | 0.00295444615366455 | 0.00147722307683228 |
| 44 | 0.998148007205653 | 0.00370398558869442 | 0.00185199279434721 |
| 45 | 0.99659898908974 | 0.00680202182052002 | 0.00340101091026001 |
| 46 | 0.99485843189506 | 0.0102831362098816 | 0.00514156810494078 |
| 47 | 0.992097026108705 | 0.0158059477825902 | 0.00790297389129508 |
| 48 | 0.990611365310828 | 0.0187772693783448 | 0.00938863468917238 |
| 49 | 0.99791908209403 | 0.00416183581193943 | 0.00208091790596972 |
| Meta Analysis of Goldfeld-Quandt test for Heteroskedasticity | |||
| Description | # significant tests | % significant tests | OK/NOK |
| 1% type I error level | 11 | 0.255813953488372 | NOK |
| 5% type I error level | 15 | 0.348837209302326 | NOK |
| 10% type I error level | 17 | 0.395348837209302 | NOK |