| Multiple Linear Regression - Estimated Regression Equation |
| logPS[t] = + 1.07632053138176 -0.306258333780155logTg[t] -0.109690673239256`D_(overall_danger)`[t] + e[t] |
| Multiple Linear Regression - Ordinary Least Squares | |||||
| Variable | Parameter | S.D. | T-STAT H0: parameter = 0 | 2-tail p-value | 1-tail p-value |
| (Intercept) | 1.07632053138176 | 0.126558 | 8.5046 | 0 | 0 |
| logTg | -0.306258333780155 | 0.068087 | -4.4981 | 6.9e-05 | 3.4e-05 |
| `D_(overall_danger)` | -0.109690673239256 | 0.022194 | -4.9424 | 1.8e-05 | 9e-06 |
| Multiple Linear Regression - Regression Statistics | |
| Multiple R | 0.810098474404666 |
| R-squared | 0.656259538232767 |
| Adjusted R-squared | 0.637162845912365 |
| F-TEST (value) | 34.3650893684692 |
| F-TEST (DF numerator) | 2 |
| F-TEST (DF denominator) | 36 |
| p-value | 4.48902270910878e-09 |
| Multiple Linear Regression - Residual Statistics | |
| Residual Standard Deviation | 0.181540781585162 |
| Sum Squared Residuals | 1.18645399362785 |
| Multiple Linear Regression - Actuals, Interpolation, and Residuals | |||
| Time or Index | Actuals | Interpolation Forecast | Residuals Prediction Error |
| 1 | 0.301029996 | 0.250114888798781 | 0.0509151072012193 |
| 2 | 0.255272505 | -0.218490736716624 | 0.473763241716624 |
| 3 | -0.15490196 | -0.053138161176754 | -0.101763798823246 |
| 4 | 0.591064607 | 0.493746151743886 | 0.0973184552561144 |
| 5 | 0 | -0.156657631469970 | 0.156657631469970 |
| 6 | 0.556302501 | 0.415566819702699 | 0.140735681297301 |
| 7 | 0.146128036 | 0.243331026246937 | -0.0972029902469373 |
| 8 | 0.176091259 | 0.00996774114849874 | 0.166123517851501 |
| 9 | -0.15490196 | -0.222069552294649 | 0.0671675922946485 |
| 10 | 0.322219295 | 0.469496235277289 | -0.147276940277289 |
| 11 | 0.612783857 | 0.359805562038034 | 0.252978294961966 |
| 12 | 0.079181246 | 0.220172600876346 | -0.140991354876346 |
| 13 | -0.301029996 | -0.136793571517275 | -0.164236424482725 |
| 14 | 0.531478917 | 0.488167405238285 | 0.0433115117617153 |
| 15 | 0.176091259 | 0.203629576894364 | -0.0275383178943640 |
| 16 | 0.531478917 | 0.304044304373368 | 0.227434612626632 |
| 17 | -0.096910013 | 0.0763367120920791 | -0.173246725092079 |
| 18 | -0.096910013 | -0.245845292351895 | 0.148935279351895 |
| 19 | 0.301029996 | 0.446306135575005 | -0.145276139575005 |
| 20 | 0.278753601 | 0.223490562449866 | 0.0552630385501344 |
| 21 | 0.113943352 | 0.355619564506365 | -0.241676212506365 |
| 22 | 0.301029996 | 0.294867817316446 | 0.00616217868355372 |
| 23 | 0.748188027 | 0.636121607895757 | 0.112066419104243 |
| 24 | 0.491361694 | 0.329863274115602 | 0.161498419884398 |
| 25 | -0.045757491 | -0.0455357317024625 | -0.00022175929753752 |
| 26 | 0.255272505 | 0.480103948556204 | -0.224831443556204 |
| 27 | 0.278753601 | 0.00645195152197764 | 0.272301649478022 |
| 28 | -0.045757491 | 0.0711252177174974 | -0.116882708717497 |
| 29 | 0.414973348 | 0.342307833485327 | 0.0726655145146735 |
| 30 | 0.380211242 | 0.441089533247894 | -0.0608782912478944 |
| 31 | 0.079181246 | 0.178624798431546 | -0.099443552431546 |
| 32 | -0.045757491 | 0.136563686193763 | -0.182321177193763 |
| 33 | -0.301029996 | 0.0268730129545081 | -0.327903008954508 |
| 34 | -0.22184875 | -0.139462683948103 | -0.0823860660518974 |
| 35 | 0.361727836 | 0.312365545869153 | 0.0493622901308468 |
| 36 | -0.301029996 | 0.0425388991108808 | -0.343568895110881 |
| 37 | 0.414973348 | 0.34770574179503 | 0.0672676062049698 |
| 38 | -0.22184875 | -0.0736411735340842 | -0.148207576465916 |
| 39 | 0.819543936 | 0.615618595538427 | 0.203925340461573 |
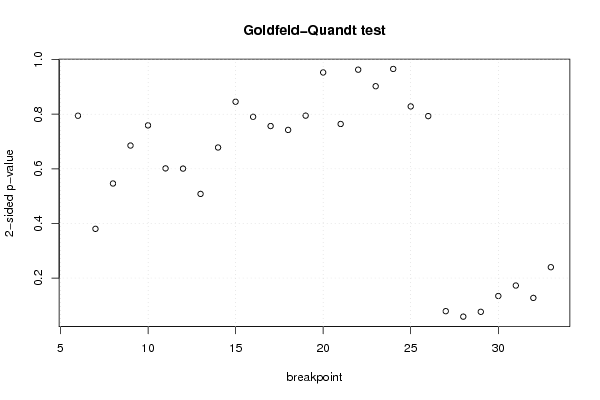
| Goldfeld-Quandt test for Heteroskedasticity | |||
| p-values | Alternative Hypothesis | ||
| breakpoint index | greater | 2-sided | less |
| 6 | 0.60274407919828 | 0.79451184160344 | 0.39725592080172 |
| 7 | 0.809846347275957 | 0.380307305448086 | 0.190153652724043 |
| 8 | 0.726819137646927 | 0.546361724706147 | 0.273180862353073 |
| 9 | 0.657324403012004 | 0.685351193975991 | 0.342675596987996 |
| 10 | 0.62037050095062 | 0.759258998098761 | 0.379629499049380 |
| 11 | 0.699135172830856 | 0.601729654338288 | 0.300864827169144 |
| 12 | 0.699549926652618 | 0.600900146694763 | 0.300450073347382 |
| 13 | 0.74587050086826 | 0.508258998263479 | 0.254129499131740 |
| 14 | 0.66090013183443 | 0.678199736331139 | 0.339099868165570 |
| 15 | 0.577107470857903 | 0.845785058284194 | 0.422892529142097 |
| 16 | 0.604716817246227 | 0.790566365507547 | 0.395283182753773 |
| 17 | 0.621659920635506 | 0.756680158728987 | 0.378340079364494 |
| 18 | 0.628756725460081 | 0.742486549079838 | 0.371243274539919 |
| 19 | 0.602576640368982 | 0.794846719262035 | 0.397423359631018 |
| 20 | 0.523479174684976 | 0.953041650630049 | 0.476520825315024 |
| 21 | 0.617834001520566 | 0.764331996958868 | 0.382165998479434 |
| 22 | 0.518439627876854 | 0.963120744246291 | 0.481560372123146 |
| 23 | 0.451275149910166 | 0.902550299820333 | 0.548724850089834 |
| 24 | 0.482906883357213 | 0.965813766714425 | 0.517093116642787 |
| 25 | 0.414292915826173 | 0.828585831652346 | 0.585707084173827 |
| 26 | 0.603417250562061 | 0.793165498875878 | 0.396582749437939 |
| 27 | 0.960583845313805 | 0.0788323093723893 | 0.0394161546861946 |
| 28 | 0.970627527834245 | 0.0587449443315107 | 0.0293724721657554 |
| 29 | 0.961757161415432 | 0.0764856771691362 | 0.0382428385845681 |
| 30 | 0.932809862581285 | 0.13438027483743 | 0.0671901374187151 |
| 31 | 0.91364556156462 | 0.172708876870759 | 0.0863544384353796 |
| 32 | 0.936294242236028 | 0.127411515527943 | 0.0637057577639716 |
| 33 | 0.880106903359968 | 0.239786193280065 | 0.119893096640032 |
| Meta Analysis of Goldfeld-Quandt test for Heteroskedasticity | |||
| Description | # significant tests | % significant tests | OK/NOK |
| 1% type I error level | 0 | 0 | OK |
| 5% type I error level | 0 | 0 | OK |
| 10% type I error level | 3 | 0.107142857142857 | NOK |