| Multiple Linear Regression - Estimated Regression Equation |
| Vruchtesappen[t] = + 9131.73309840353 + 0.454083662567809Mineraalwater[t] + 0.00771101131009535Appelen[t] -0.0655831488070655Sinaasappelen[t] + 0.0340529156698439Citroenen[t] + 0.0192571859658415Pompelmoezen[t] -0.0490769779229899Bananen[t] + 57.4062005061049M1[t] + 77.7493115271082M2[t] + 250.489345731327M3[t] + 344.236338901192M4[t] + 356.036377383132M5[t] + 359.805646551251M6[t] + 302.852781869608M7[t] + 192.587979854707M8[t] + 49.6309153787849M9[t] + 39.9297724453515M10[t] + 44.9352240195256M11[t] + 4.55639570066448t + e[t] |
| Multiple Linear Regression - Ordinary Least Squares | |||||
| Variable | Parameter | S.D. | T-STAT H0: parameter = 0 | 2-tail p-value | 1-tail p-value |
| (Intercept) | 9131.73309840353 | 991.904759 | 9.2063 | 0 | 0 |
| Mineraalwater | 0.454083662567809 | 0.11238 | 4.0406 | 0.000173 | 8.7e-05 |
| Appelen | 0.00771101131009535 | 0.013222 | 0.5832 | 0.562241 | 0.28112 |
| Sinaasappelen | -0.0655831488070655 | 0.022302 | -2.9407 | 0.004845 | 0.002423 |
| Citroenen | 0.0340529156698439 | 0.041115 | 0.8282 | 0.411251 | 0.205626 |
| Pompelmoezen | 0.0192571859658415 | 0.017953 | 1.0726 | 0.288291 | 0.144145 |
| Bananen | -0.0490769779229899 | 0.028234 | -1.7382 | 0.087974 | 0.043987 |
| M1 | 57.4062005061049 | 79.157528 | 0.7252 | 0.47151 | 0.235755 |
| M2 | 77.7493115271082 | 81.500209 | 0.954 | 0.344426 | 0.172213 |
| M3 | 250.489345731327 | 97.271029 | 2.5752 | 0.012846 | 0.006423 |
| M4 | 344.236338901192 | 110.500607 | 3.1152 | 0.002964 | 0.001482 |
| M5 | 356.036377383132 | 115.737436 | 3.0762 | 0.003313 | 0.001656 |
| M6 | 359.805646551251 | 123.043558 | 2.9242 | 0.005071 | 0.002535 |
| M7 | 302.852781869608 | 114.185284 | 2.6523 | 0.010524 | 0.005262 |
| M8 | 192.587979854707 | 101.554579 | 1.8964 | 0.063364 | 0.031682 |
| M9 | 49.6309153787849 | 92.729641 | 0.5352 | 0.594735 | 0.297368 |
| M10 | 39.9297724453515 | 77.753222 | 0.5135 | 0.609705 | 0.304852 |
| M11 | 44.9352240195256 | 79.954967 | 0.562 | 0.576481 | 0.28824 |
| t | 4.55639570066448 | 2.876237 | 1.5842 | 0.119109 | 0.059554 |
| Multiple Linear Regression - Regression Statistics | |
| Multiple R | 0.799200768910404 |
| R-squared | 0.638721869026981 |
| Adjusted R-squared | 0.516023635866333 |
| F-TEST (value) | 5.20563216416252 |
| F-TEST (DF numerator) | 18 |
| F-TEST (DF denominator) | 53 |
| p-value | 1.3085519341427e-06 |
| Multiple Linear Regression - Residual Statistics | |
| Residual Standard Deviation | 129.986803912926 |
| Sum Squared Residuals | 895518.167149366 |
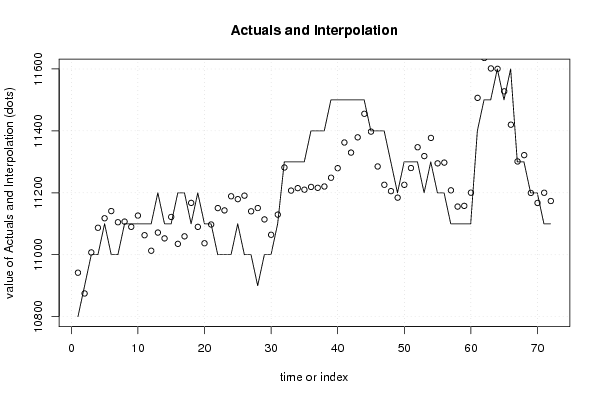
| Multiple Linear Regression - Actuals, Interpolation, and Residuals | |||
| Time or Index | Actuals | Interpolation Forecast | Residuals Prediction Error |
| 1 | 10800 | 10941.9391714998 | -141.939171499841 |
| 2 | 10900 | 10874.9779937080 | 25.0220062919670 |
| 3 | 11000 | 11007.4666254807 | -7.46662548067558 |
| 4 | 11000 | 11087.0630233624 | -87.0630233623686 |
| 5 | 11100 | 11117.7802357804 | -17.7802357803734 |
| 6 | 11000 | 11141.0062181885 | -141.006218188493 |
| 7 | 11000 | 11104.9191983194 | -104.919198319354 |
| 8 | 11100 | 11106.9471516536 | -6.94715165356724 |
| 9 | 11100 | 11090.1306309846 | 9.869369015438 |
| 10 | 11100 | 11126.4208771537 | -26.4208771536528 |
| 11 | 11100 | 11063.0387536280 | 36.9612463720369 |
| 12 | 11100 | 11012.8460427614 | 87.1539572385911 |
| 13 | 11200 | 11071.5643335593 | 128.435666440744 |
| 14 | 11100 | 11052.8677432502 | 47.1322567497655 |
| 15 | 11100 | 11122.0070289226 | -22.0070289225945 |
| 16 | 11200 | 11035.1079584052 | 164.892041594792 |
| 17 | 11200 | 11059.4037687044 | 140.596231295606 |
| 18 | 11100 | 11167.4783734250 | -67.478373424953 |
| 19 | 11200 | 11089.9998283136 | 110.000171686368 |
| 20 | 11100 | 11037.0423837751 | 62.9576162248964 |
| 21 | 11100 | 11097.6568611894 | 2.34313881063982 |
| 22 | 11000 | 11150.6323044162 | -150.632304416210 |
| 23 | 11000 | 11143.1765555573 | -143.176555557299 |
| 24 | 11000 | 11188.8364334207 | -188.836433420730 |
| 25 | 11100 | 11179.4948537127 | -79.4948537126964 |
| 26 | 11000 | 11190.7545403590 | -190.754540358985 |
| 27 | 11000 | 11140.2045892504 | -140.204589250432 |
| 28 | 10900 | 11150.7382354840 | -250.738235484013 |
| 29 | 11000 | 11114.1019851576 | -114.101985157647 |
| 30 | 11000 | 11064.4661514704 | -64.4661514704467 |
| 31 | 11100 | 11129.5968179685 | -29.596817968493 |
| 32 | 11300 | 11281.6771453080 | 18.3228546920307 |
| 33 | 11300 | 11207.1373751130 | 92.8626248870277 |
| 34 | 11300 | 11215.0534259733 | 84.9465740267101 |
| 35 | 11300 | 11210.0232730845 | 89.9767269155478 |
| 36 | 11400 | 11218.9637798106 | 181.036220189367 |
| 37 | 11400 | 11216.0874346639 | 183.9125653361 |
| 38 | 11400 | 11220.3207937966 | 179.679206203378 |
| 39 | 11500 | 11248.6859495975 | 251.314050402483 |
| 40 | 11500 | 11279.5755638071 | 220.424436192851 |
| 41 | 11500 | 11362.4399732866 | 137.560026713448 |
| 42 | 11500 | 11329.8527219905 | 170.14727800953 |
| 43 | 11500 | 11379.1734328689 | 120.826567131071 |
| 44 | 11500 | 11455.1930287973 | 44.8069712027277 |
| 45 | 11400 | 11397.5580699158 | 2.44193008420276 |
| 46 | 11400 | 11285.0284987938 | 114.971501206220 |
| 47 | 11400 | 11225.8310319541 | 174.168968045868 |
| 48 | 11300 | 11205.4725284409 | 94.5274715591098 |
| 49 | 11200 | 11184.2894494505 | 15.7105505495091 |
| 50 | 11300 | 11225.6694413627 | 74.3305586373422 |
| 51 | 11300 | 11279.9558233053 | 20.0441766947427 |
| 52 | 11300 | 11347.1410881156 | -47.1410881155754 |
| 53 | 11200 | 11318.5546458387 | -118.554645838654 |
| 54 | 11300 | 11377.2201233352 | -77.2201233352117 |
| 55 | 11200 | 11295.0689557265 | -95.0689557265167 |
| 56 | 11200 | 11297.5326409155 | -97.5326409154885 |
| 57 | 11100 | 11208.0162445651 | -108.016244565063 |
| 58 | 11100 | 11155.5045876359 | -55.5045876359424 |
| 59 | 11100 | 11157.8341436636 | -57.8341436635955 |
| 60 | 11100 | 11200.3643778261 | -100.364377826066 |
| 61 | 11400 | 11506.6247571138 | -106.624757113815 |
| 62 | 11500 | 11635.4094875235 | -135.409487523468 |
| 63 | 11500 | 11601.6799834435 | -101.679983443523 |
| 64 | 11600 | 11600.3741308257 | -0.374130825685482 |
| 65 | 11500 | 11527.7193912324 | -27.7193912323806 |
| 66 | 11600 | 11419.9764115904 | 180.023588409574 |
| 67 | 11300 | 11301.2417668031 | -1.24176680307487 |
| 68 | 11300 | 11321.6076495506 | -21.6076495505992 |
| 69 | 11200 | 11199.5008182322 | 0.499181767755088 |
| 70 | 11200 | 11167.3603060271 | 32.6396939728755 |
| 71 | 11100 | 11200.0962421126 | -100.096242112558 |
| 72 | 11100 | 11173.5168377403 | -73.5168377402719 |
| Goldfeld-Quandt test for Heteroskedasticity | |||
| p-values | Alternative Hypothesis | ||
| breakpoint index | greater | 2-sided | less |
| 22 | 0.00829046298927137 | 0.0165809259785427 | 0.991709537010729 |
| 23 | 0.0073569799727175 | 0.014713959945435 | 0.992643020027282 |
| 24 | 0.00188740801332064 | 0.00377481602664128 | 0.99811259198668 |
| 25 | 0.00274985532239729 | 0.00549971064479457 | 0.997250144677603 |
| 26 | 0.00126014911385750 | 0.00252029822771499 | 0.998739850886142 |
| 27 | 0.0231916748448085 | 0.046383349689617 | 0.976808325155192 |
| 28 | 0.151391134668211 | 0.302782269336422 | 0.848608865331789 |
| 29 | 0.150820988241316 | 0.301641976482633 | 0.849179011758684 |
| 30 | 0.429895435762797 | 0.859790871525593 | 0.570104564237203 |
| 31 | 0.652309434288732 | 0.695381131422535 | 0.347690565711268 |
| 32 | 0.791665404728275 | 0.416669190543451 | 0.208334595271725 |
| 33 | 0.79510144584561 | 0.409797108308781 | 0.204898554154390 |
| 34 | 0.893025052719179 | 0.213949894561643 | 0.106974947280821 |
| 35 | 0.96024526294742 | 0.0795094741051582 | 0.0397547370525791 |
| 36 | 0.985135161974964 | 0.0297296760500723 | 0.0148648380250361 |
| 37 | 0.979917958458966 | 0.0401640830820678 | 0.0200820415410339 |
| 38 | 0.982945934863936 | 0.0341081302721285 | 0.0170540651360643 |
| 39 | 0.98850600818474 | 0.0229879836305213 | 0.0114939918152606 |
| 40 | 0.990855212939078 | 0.0182895741218443 | 0.00914478706092214 |
| 41 | 0.998558070392299 | 0.00288385921540223 | 0.00144192960770111 |
| 42 | 0.998355351182763 | 0.00328929763447414 | 0.00164464881723707 |
| 43 | 0.998594831951174 | 0.00281033609765232 | 0.00140516804882616 |
| 44 | 0.996576475136715 | 0.0068470497265708 | 0.0034235248632854 |
| 45 | 0.993300133126541 | 0.0133997337469172 | 0.00669986687345861 |
| 46 | 0.98816127686469 | 0.0236774462706222 | 0.0118387231353111 |
| 47 | 0.971068838815022 | 0.0578623223699566 | 0.0289311611849783 |
| 48 | 0.968801758519278 | 0.0623964829614435 | 0.0311982414807217 |
| 49 | 0.974047416734649 | 0.0519051665307025 | 0.0259525832653512 |
| 50 | 0.94479766761859 | 0.110404664762818 | 0.0552023323814091 |
| Meta Analysis of Goldfeld-Quandt test for Heteroskedasticity | |||
| Description | # significant tests | % significant tests | OK/NOK |
| 1% type I error level | 7 | 0.241379310344828 | NOK |
| 5% type I error level | 17 | 0.586206896551724 | NOK |
| 10% type I error level | 21 | 0.724137931034483 | NOK |