| Multiple Linear Regression - Estimated Regression Equation |
| slowsleep[t] = + 2.70159405376894 -0.105498825253138gewicht[t] -0.362298441262711gevaar[t] + e[t] |
| Multiple Linear Regression - Ordinary Least Squares | |||||
| Variable | Parameter | S.D. | T-STAT H0: parameter = 0 | 2-tail p-value | 1-tail p-value |
| (Intercept) | 2.70159405376894 | 0.360803 | 7.4877 | 0 | 0 |
| gewicht | -0.105498825253138 | 0.053561 | -1.9697 | 0.053576 | 0.026788 |
| gevaar | -0.362298441262711 | 0.125028 | -2.8977 | 0.005268 | 0.002634 |
| Multiple Linear Regression - Regression Statistics | |
| Multiple R | 0.462886853769664 |
| R-squared | 0.214264239392778 |
| Adjusted R-squared | 0.18762912886372 |
| F-TEST (value) | 8.0444283930799 |
| F-TEST (DF numerator) | 2 |
| F-TEST (DF denominator) | 59 |
| p-value | 0.000814061694959789 |
| Multiple Linear Regression - Residual Statistics | |
| Residual Standard Deviation | 1.36356875084952 |
| Sum Squared Residuals | 109.699864559306 |
| Multiple Linear Regression - Actuals, Interpolation, and Residuals | |||
| Time or Index | Actuals | Interpolation Forecast | Residuals Prediction Error |
| 1 | 0 | 0.68599257127742 | -0.68599257127742 |
| 2 | 2 | 1.61469872998080 | 0.385301270019198 |
| 3 | 0 | 2.21069254452265 | -2.21069254452265 |
| 4 | 0 | 1.62345513247681 | -1.62345513247681 |
| 5 | 1.8 | 0.424973002257728 | 1.37502699774227 |
| 6 | 0.7 | 1.00384505642170 | -0.303845056421699 |
| 7 | 3.9 | 2.73723718136106 | 1.16276281863894 |
| 8 | 1 | 0.716993750558415 | 0.283006249441585 |
| 9 | 3.6 | 2.21333001515398 | 1.38666998484602 |
| 10 | 1.4 | 1.92215325745532 | -0.522153257455316 |
| 11 | 1.5 | 1.34270728313478 | 0.157292716865221 |
| 12 | 0.7 | 0.242128062750605 | 0.457871937249394 |
| 13 | 2.7 | 2.04008546874489 | 0.659914531255109 |
| 14 | 0 | 0.338131993730962 | -0.338131993730962 |
| 15 | 2.1 | 2.61253756991185 | -0.512537569911854 |
| 16 | 0 | 1.86105396229032 | -1.86105396229032 |
| 17 | 4.1 | 2.00252788695477 | 2.09747211304523 |
| 18 | 1.2 | 2.14674478107581 | -0.946744781075814 |
| 19 | 1.3 | 2.30300401661915 | -1.00300401661915 |
| 20 | 6.1 | 1.90738342191988 | 4.19261657808012 |
| 21 | 0.3 | 0.228518714292951 | 0.0714812857070493 |
| 22 | 0.5 | 0.539845747614962 | -0.0398457476149621 |
| 23 | 3.4 | 2.20065468078017 | 1.19934531921983 |
| 24 | 0 | 1.77667037743124 | -1.77667037743124 |
| 25 | 1.5 | 1.87056433190653 | -0.370564331906531 |
| 26 | 0 | 1.9602383333717 | -1.9602383333717 |
| 27 | 3.4 | 1.85660753628625 | 1.54339246371375 |
| 28 | 0.8 | 1.24828583453322 | -0.448285834533220 |
| 29 | 0.8 | 0.230101196671748 | 0.569898803328252 |
| 30 | 0 | 1.85347352221552 | -1.85347352221552 |
| 31 | 0 | 0.877351964943186 | -0.877351964943186 |
| 32 | 1.4 | 1.81133306490922 | -0.41133306490922 |
| 33 | 2 | 2.82511770279693 | -0.825117702796928 |
| 34 | 1.9 | 1.90390196068652 | -0.00390196068652322 |
| 35 | 2.4 | 2.56126514083883 | -0.161265140838829 |
| 36 | 2.8 | 1.58304908240486 | 1.21695091759514 |
| 37 | 1.3 | 2.01264029883564 | -0.712640298835642 |
| 38 | 2 | 1.93509866227458 | 0.064901337725415 |
| 39 | 5.6 | 2.28327573629681 | 3.31672426370319 |
| 40 | 3.1 | 2.20710558446404 | 0.892894415535957 |
| 41 | 1 | 0.307642833232805 | 0.692357166767195 |
| 42 | 1.8 | 2.05443330897932 | -0.254433308979318 |
| 43 | 0.9 | 1.00943649416011 | -0.109436494160115 |
| 44 | 1.8 | 1.92614673747150 | -0.126146737471502 |
| 45 | 1.9 | 0.697792964362344 | 1.20220703563766 |
| 46 | 0.9 | 0.793464923523507 | 0.106535076476493 |
| 47 | 0 | 1.09460499682626 | -1.09460499682626 |
| 48 | 2.6 | 1.74899873452805 | 0.851001265471951 |
| 49 | 2.4 | 1.45827492281727 | 0.941725077182734 |
| 50 | 1.2 | 1.77475592323325 | -0.574755923233248 |
| 51 | 0.9 | 2.00738083291642 | -1.10738083291642 |
| 52 | 0.5 | 1.47955473483153 | -0.979554734831533 |
| 53 | 0 | 0.605571515747668 | -0.605571515747668 |
| 54 | 0.6 | 0.466418565238778 | 0.133581434761222 |
| 55 | 0 | 1.94154956595846 | -1.94154956595846 |
| 56 | 2.2 | 2.27376536668059 | -0.0737653666805926 |
| 57 | 2.3 | 1.98807454789509 | 0.311925452104906 |
| 58 | 0.5 | 1.54158804408038 | -1.04158804408038 |
| 59 | 2.6 | 2.21574101279137 | 0.384258987208633 |
| 60 | 0.6 | 1.10122047213035 | -0.501220472130345 |
| 61 | 6.6 | 2.20710558446404 | 4.39289441553596 |
| 62 | 0 | 2.19170275597708 | -2.19170275597708 |
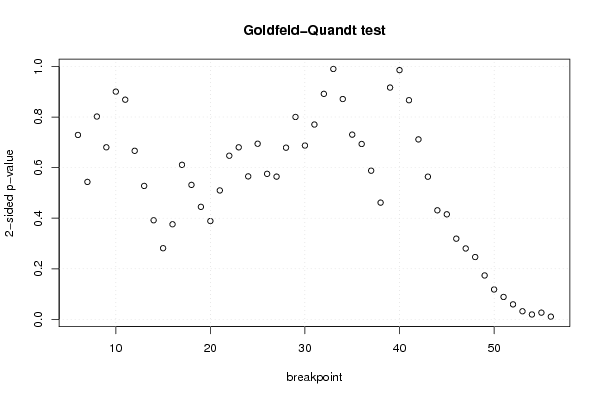
| Goldfeld-Quandt test for Heteroskedasticity | |||
| p-values | Alternative Hypothesis | ||
| breakpoint index | greater | 2-sided | less |
| 6 | 0.364505089259365 | 0.72901017851873 | 0.635494910740635 |
| 7 | 0.728299027539819 | 0.543401944920363 | 0.271700972460181 |
| 8 | 0.599067378242078 | 0.801865243515844 | 0.400932621757922 |
| 9 | 0.659890213118794 | 0.680219573762413 | 0.340109786881206 |
| 10 | 0.549878575099415 | 0.90024284980117 | 0.450121424900585 |
| 11 | 0.434234227874639 | 0.868468455749278 | 0.565765772125361 |
| 12 | 0.333169229373068 | 0.666338458746135 | 0.666830770626932 |
| 13 | 0.263740564664092 | 0.527481129328184 | 0.736259435335908 |
| 14 | 0.195856573142152 | 0.391713146284304 | 0.804143426857848 |
| 15 | 0.140636415909614 | 0.281272831819227 | 0.859363584090386 |
| 16 | 0.187946710618366 | 0.375893421236732 | 0.812053289381634 |
| 17 | 0.305427670856494 | 0.610855341712987 | 0.694572329143506 |
| 18 | 0.265821596993832 | 0.531643193987663 | 0.734178403006168 |
| 19 | 0.222412434102041 | 0.444824868204082 | 0.777587565897959 |
| 20 | 0.805689975473588 | 0.388620049052824 | 0.194310024526412 |
| 21 | 0.745162956241168 | 0.509674087517663 | 0.254837043758832 |
| 22 | 0.67653958114557 | 0.64692083770886 | 0.32346041885443 |
| 23 | 0.659911037245919 | 0.680177925508163 | 0.340088962754081 |
| 24 | 0.71736214396397 | 0.56527571207206 | 0.28263785603603 |
| 25 | 0.652846224873807 | 0.694307550252386 | 0.347153775126193 |
| 26 | 0.712357644508715 | 0.57528471098257 | 0.287642355491285 |
| 27 | 0.717866741842365 | 0.56426651631527 | 0.282133258157635 |
| 28 | 0.660651485272114 | 0.678697029455772 | 0.339348514727886 |
| 29 | 0.599933585023225 | 0.80013282995355 | 0.400066414976775 |
| 30 | 0.656378890376172 | 0.687242219247656 | 0.343621109623828 |
| 31 | 0.614867508311141 | 0.770264983377717 | 0.385132491688859 |
| 32 | 0.554240045561533 | 0.891519908876933 | 0.445759954438467 |
| 33 | 0.504993197808691 | 0.990013604382618 | 0.495006802191309 |
| 34 | 0.435515578468833 | 0.871031156937667 | 0.564484421531167 |
| 35 | 0.365125456765535 | 0.73025091353107 | 0.634874543234465 |
| 36 | 0.34666861407742 | 0.69333722815484 | 0.65333138592258 |
| 37 | 0.293904821065730 | 0.587809642131461 | 0.70609517893427 |
| 38 | 0.230744408943092 | 0.461488817886183 | 0.769255591056908 |
| 39 | 0.541791943060626 | 0.916416113878749 | 0.458208056939374 |
| 40 | 0.492680438224574 | 0.985360876449148 | 0.507319561775426 |
| 41 | 0.433219314188232 | 0.866438628376464 | 0.566780685811768 |
| 42 | 0.355728526061270 | 0.711457052122539 | 0.64427147393873 |
| 43 | 0.282019664599905 | 0.56403932919981 | 0.717980335400095 |
| 44 | 0.215548332382468 | 0.431096664764937 | 0.784451667617532 |
| 45 | 0.207655815381696 | 0.415311630763392 | 0.792344184618304 |
| 46 | 0.159468277401142 | 0.318936554802284 | 0.840531722598858 |
| 47 | 0.140146414904539 | 0.280292829809078 | 0.85985358509546 |
| 48 | 0.123174448290406 | 0.246348896580811 | 0.876825551709594 |
| 49 | 0.0867801094703776 | 0.173560218940755 | 0.913219890529622 |
| 50 | 0.0590527208787065 | 0.118105441757413 | 0.940947279121294 |
| 51 | 0.0442858936400623 | 0.0885717872801246 | 0.955714106359938 |
| 52 | 0.0296256704753052 | 0.0592513409506105 | 0.970374329524695 |
| 53 | 0.0159822403131892 | 0.0319644806263783 | 0.98401775968681 |
| 54 | 0.0096328758862687 | 0.0192657517725374 | 0.990367124113731 |
| 55 | 0.0132678736123894 | 0.0265357472247787 | 0.98673212638761 |
| 56 | 0.00533070834007206 | 0.0106614166801441 | 0.994669291659928 |
| Meta Analysis of Goldfeld-Quandt test for Heteroskedasticity | |||
| Description | # significant tests | % significant tests | OK/NOK |
| 1% type I error level | 0 | 0 | OK |
| 5% type I error level | 4 | 0.0784313725490196 | NOK |
| 10% type I error level | 6 | 0.117647058823529 | NOK |