| Multiple Linear Regression - Estimated Regression Equation |
| PS[t] = -244.529665049594 -0.000242637461065961bowgth[t] + 0.000196998343894375brwght[t] + 0.301538779457337TS[t] + 0.184093912577121LIFESPAN[t] -0.157429661772659DRAAGTIJD[t] -30.6168396497268PRED[t] -103.669940902568Exposure[t] + 160.603410887734OverallD[t] + e[t] |
| Multiple Linear Regression - Ordinary Least Squares | |||||
| Variable | Parameter | S.D. | T-STAT H0: parameter = 0 | 2-tail p-value | 1-tail p-value |
| (Intercept) | -244.529665049594 | 116.124698 | -2.1058 | 0.03998 | 0.01999 |
| bowgth | -0.000242637461065961 | 0.000159 | -1.528 | 0.132457 | 0.066229 |
| brwght | 0.000196998343894375 | 0.000159 | 1.2351 | 0.222238 | 0.111119 |
| TS | 0.301538779457337 | 0.206867 | 1.4576 | 0.150839 | 0.07542 |
| LIFESPAN | 0.184093912577121 | 0.209186 | 0.88 | 0.382806 | 0.191403 |
| DRAAGTIJD | -0.157429661772659 | 0.187617 | -0.8391 | 0.405182 | 0.202591 |
| PRED | -30.6168396497268 | 95.92979 | -0.3192 | 0.750861 | 0.37543 |
| Exposure | -103.669940902568 | 61.459279 | -1.6868 | 0.097519 | 0.048759 |
| OverallD | 160.603410887734 | 122.57462 | 1.3103 | 0.195761 | 0.097881 |
| Multiple Linear Regression - Regression Statistics | |
| Multiple R | 0.437155435075075 |
| R-squared | 0.191104874415678 |
| Adjusted R-squared | 0.0690074969689877 |
| F-TEST (value) | 1.56518410478651 |
| F-TEST (DF numerator) | 8 |
| F-TEST (DF denominator) | 53 |
| p-value | 0.157740646773758 |
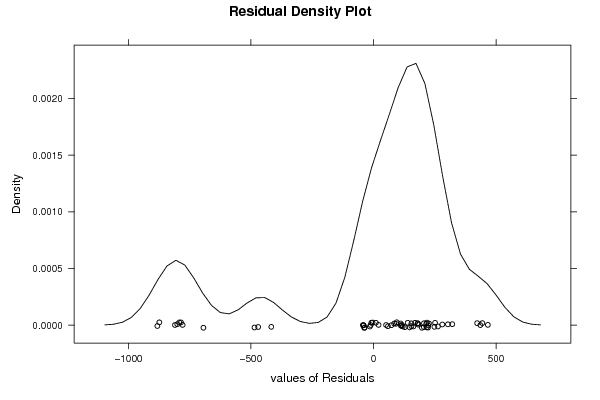
| Multiple Linear Regression - Residual Statistics | |
| Residual Standard Deviation | 384.691125735455 |
| Sum Squared Residuals | 7843324.89763942 |
| Multiple Linear Regression - Actuals, Interpolation, and Residuals | |||
| Time or Index | Actuals | Interpolation Forecast | Residuals Prediction Error |
| 1 | -999 | -955.615810302327 | -43.3841896976729 |
| 2 | 2 | 39.5368080521380 | -37.5368080521380 |
| 3 | -999 | -213.367166403626 | -785.632833596374 |
| 4 | -999 | -304.891015454242 | -694.108984545758 |
| 5 | 1.8 | -7.88810908830689 | 9.6881090883069 |
| 6 | 0.7 | -126.873489633856 | 127.573489633856 |
| 7 | 3.9 | -214.284921063081 | 218.184921063081 |
| 8 | 1 | -302.708790302711 | 303.708790302711 |
| 9 | 3.6 | -318.031648471931 | 321.631648471931 |
| 10 | 1.4 | -168.268933787950 | 169.668933787950 |
| 11 | 1.5 | -181.193527064841 | 182.693527064841 |
| 12 | 0.7 | -179.981549641668 | 180.681549641668 |
| 13 | 2.7 | -111.285538026651 | 113.985538026651 |
| 14 | -999 | -124.964976073713 | -874.035023926287 |
| 15 | 2.1 | -221.411446252281 | 223.511446252281 |
| 16 | 0 | -180.309459561999 | 180.309459561999 |
| 17 | 4.1 | -193.488118024287 | 197.588118024287 |
| 18 | 1.2 | -204.661978968459 | 205.861978968459 |
| 19 | 1.3 | -153.406811725476 | 154.706811725476 |
| 20 | 6.1 | -52.7956751155638 | 58.8956751155638 |
| 21 | 0.3 | -466.397332262899 | 466.697332262899 |
| 22 | 0.5 | -115.474920326501 | 115.974920326501 |
| 23 | 3.4 | -116.105083803601 | 119.505083803601 |
| 24 | -999 | -528.286402890337 | -470.713597109663 |
| 25 | 1.5 | -421.538443245452 | 423.038443245452 |
| 26 | -999 | -206.502494754286 | -792.497505245714 |
| 27 | 3.4 | -17.2755528283292 | 20.6755528283292 |
| 28 | 0.8 | -72.2123797964895 | 73.0123797964895 |
| 29 | 0.8 | -153.880299253587 | 154.680299253587 |
| 30 | -999 | -219.910684546733 | -779.089315453267 |
| 31 | -999 | -513.208337581271 | -485.791662418729 |
| 32 | 1.4 | 37.2978341518032 | -35.8978341518032 |
| 33 | 2 | -215.665595366524 | 217.665595366524 |
| 34 | 1.9 | 5.56923844040173 | -3.66923844040173 |
| 35 | 2.4 | -433.675306389444 | 436.075306389444 |
| 36 | 2.8 | -144.588685339426 | 147.388685339426 |
| 37 | 1.3 | 12.7215901662120 | -11.4215901662120 |
| 38 | 2 | 10.6483158240167 | -8.64831582401667 |
| 39 | 5.6 | -243.120102538073 | 248.720102538073 |
| 40 | 3.1 | -259.999697581963 | 263.099697581963 |
| 41 | 1 | -443.238365651673 | 444.238365651673 |
| 42 | 1.8 | -203.547912960806 | 205.347912960806 |
| 43 | 0.9 | -138.792281541852 | 139.692281541852 |
| 44 | 1.8 | -82.5257571507456 | 84.3257571507456 |
| 45 | 1.9 | -160.990784048345 | 162.890784048345 |
| 46 | 0.9 | -110.203130405062 | 111.103130405062 |
| 47 | -999 | -188.841246077261 | -810.15875392274 |
| 48 | 2.6 | 43.6738670574933 | -41.0738670574933 |
| 49 | 2.4 | -212.739029859733 | 215.139029859733 |
| 50 | 1.2 | -279.538545242627 | 280.738545242627 |
| 51 | 0.9 | -221.6163672933 | 222.5163672933 |
| 52 | 0.5 | -91.3351637930795 | 91.8351637930795 |
| 53 | -999 | -116.900441475076 | -882.099558524924 |
| 54 | 0.6 | -110.882335594233 | 111.482335594233 |
| 55 | -999 | -198.287367821307 | -800.712632178693 |
| 56 | 2.2 | 42.3760908930892 | -40.1760908930892 |
| 57 | 2.3 | -92.3213774887169 | 94.6213774887169 |
| 58 | 0.5 | 15.2209938684948 | -14.7209938684948 |
| 59 | 2.6 | -224.074809130191 | 226.674809130191 |
| 60 | 0.6 | -50.7200754632581 | 51.3200754632581 |
| 61 | 6.6 | -244.712693142038 | 251.312693142038 |
| 62 | -999 | -581.906770846459 | -417.093229153541 |
| Goldfeld-Quandt test for Heteroskedasticity | |||
| p-values | Alternative Hypothesis | ||
| breakpoint index | greater | 2-sided | less |
| 12 | 0.738338079559527 | 0.523323840880946 | 0.261661920440473 |
| 13 | 0.706152229702804 | 0.587695540594392 | 0.293847770297196 |
| 14 | 0.931539562463506 | 0.136920875072987 | 0.0684604375364935 |
| 15 | 0.905051805092775 | 0.18989638981445 | 0.094948194907225 |
| 16 | 0.852702708362963 | 0.294594583274074 | 0.147297291637037 |
| 17 | 0.790664940145131 | 0.418670119709737 | 0.209335059854869 |
| 18 | 0.728653357518112 | 0.542693284963776 | 0.271346642481888 |
| 19 | 0.705103488120435 | 0.589793023759131 | 0.294896511879565 |
| 20 | 0.663953060517205 | 0.672093878965589 | 0.336046939482794 |
| 21 | 0.607221239578175 | 0.78555752084365 | 0.392778760421825 |
| 22 | 0.518437610700273 | 0.963124778599454 | 0.481562389299727 |
| 23 | 0.463500128903553 | 0.927000257807106 | 0.536499871096447 |
| 24 | 0.521583640646114 | 0.956832718707772 | 0.478416359353886 |
| 25 | 0.541915498084073 | 0.916169003831854 | 0.458084501915927 |
| 26 | 0.773264387518016 | 0.453471224963968 | 0.226735612481984 |
| 27 | 0.712184843038033 | 0.575630313923933 | 0.287815156961967 |
| 28 | 0.634968238140517 | 0.730063523718965 | 0.365031761859483 |
| 29 | 0.570093223542002 | 0.859813552915995 | 0.429906776457998 |
| 30 | 0.854514200233432 | 0.290971599533136 | 0.145485799766568 |
| 31 | 0.872425034899589 | 0.255149930200822 | 0.127574965100411 |
| 32 | 0.822144200623933 | 0.355711598752134 | 0.177855799376067 |
| 33 | 0.782858684414224 | 0.434282631171552 | 0.217141315585776 |
| 34 | 0.785261126785605 | 0.429477746428789 | 0.214738873214395 |
| 35 | 0.79041605527593 | 0.419167889448139 | 0.209583944724069 |
| 36 | 0.73318987640567 | 0.533620247188659 | 0.266810123594329 |
| 37 | 0.662372641460726 | 0.675254717078548 | 0.337627358539274 |
| 38 | 0.601323200947907 | 0.797353598104185 | 0.398676799052093 |
| 39 | 0.521845532732993 | 0.956308934534014 | 0.478154467267007 |
| 40 | 0.438933411080906 | 0.877866822161811 | 0.561066588919094 |
| 41 | 0.394232256878251 | 0.788464513756502 | 0.605767743121749 |
| 42 | 0.350226636135575 | 0.70045327227115 | 0.649773363864425 |
| 43 | 0.278223101395908 | 0.556446202791816 | 0.721776898604092 |
| 44 | 0.204669113247342 | 0.409338226494684 | 0.795330886752658 |
| 45 | 0.139520873755176 | 0.279041747510352 | 0.860479126244824 |
| 46 | 0.399583346961828 | 0.799166693923656 | 0.600416653038172 |
| 47 | 0.573012999739444 | 0.853974000521112 | 0.426987000260556 |
| 48 | 0.449834944589286 | 0.899669889178573 | 0.550165055410714 |
| 49 | 0.314433862522383 | 0.628867725044765 | 0.685566137477617 |
| 50 | 0.205830408578058 | 0.411660817156116 | 0.794169591421942 |
| Meta Analysis of Goldfeld-Quandt test for Heteroskedasticity | |||
| Description | # significant tests | % significant tests | OK/NOK |
| 1% type I error level | 0 | 0 | OK |
| 5% type I error level | 0 | 0 | OK |
| 10% type I error level | 0 | 0 | OK |