| Multiple Linear Regression - Estimated Regression Equation |
| SWS[t] = + 106.032869889486 + 0.975170018219347PS[t] + 0.0384720150938441L[t] -0.00401968764009279BW[t] + 0.0207571157072056BRW[t] -0.0679549796875276Tg[t] -18.3085456520360P[t] -16.4244278016369S[t] + 3.99251851862527D[t] -50.772033723839M1[t] -32.9234928415178M2[t] -48.5522187219901M3[t] -9.55932254588741M4[t] -183.119517398206M5[t] -12.2720304320899M6[t] -45.5833528069930M7[t] -45.3053222193736M8[t] -213.805687718862M9[t] -13.3346202789063M10[t] -14.9679713918905M11[t] + 0.0174424391262367t + e[t] |
| Multiple Linear Regression - Ordinary Least Squares | |||||
| Variable | Parameter | S.D. | T-STAT H0: parameter = 0 | 2-tail p-value | 1-tail p-value |
| (Intercept) | 106.032869889486 | 125.798734 | 0.8429 | 0.404188 | 0.202094 |
| PS | 0.975170018219347 | 0.07359 | 13.2513 | 0 | 0 |
| L | 0.0384720150938441 | 0.117778 | 0.3266 | 0.745596 | 0.372798 |
| BW | -0.00401968764009279 | 0.091429 | -0.044 | 0.965146 | 0.482573 |
| BRW | 0.0207571157072056 | 0.090527 | 0.2293 | 0.819781 | 0.409891 |
| Tg | -0.0679549796875276 | 0.108346 | -0.6272 | 0.534002 | 0.267001 |
| P | -18.3085456520360 | 55.143883 | -0.332 | 0.74157 | 0.370785 |
| S | -16.4244278016369 | 32.828458 | -0.5003 | 0.619531 | 0.309766 |
| D | 3.99251851862527 | 69.669207 | 0.0573 | 0.954579 | 0.47729 |
| M1 | -50.772033723839 | 127.579582 | -0.398 | 0.692722 | 0.346361 |
| M2 | -32.9234928415178 | 125.891987 | -0.2615 | 0.795 | 0.3975 |
| M3 | -48.5522187219901 | 133.2 | -0.3645 | 0.717353 | 0.358677 |
| M4 | -9.55932254588741 | 129.384869 | -0.0739 | 0.941463 | 0.470731 |
| M5 | -183.119517398206 | 132.064583 | -1.3866 | 0.17306 | 0.08653 |
| M6 | -12.2720304320899 | 123.526266 | -0.0993 | 0.921347 | 0.460673 |
| M7 | -45.5833528069930 | 130.06506 | -0.3505 | 0.727783 | 0.363892 |
| M8 | -45.3053222193736 | 135.641212 | -0.334 | 0.740076 | 0.370038 |
| M9 | -213.805687718862 | 124.172198 | -1.7218 | 0.092635 | 0.046317 |
| M10 | -13.3346202789063 | 125.974429 | -0.1059 | 0.916216 | 0.458108 |
| M11 | -14.9679713918905 | 129.558881 | -0.1155 | 0.908589 | 0.454294 |
| t | 0.0174424391262367 | 1.538652 | 0.0113 | 0.99101 | 0.495505 |
| Multiple Linear Regression - Regression Statistics | |
| Multiple R | 0.930234763075402 |
| R-squared | 0.86533671443395 |
| Adjusted R-squared | 0.799647306840754 |
| F-TEST (value) | 13.1731544877501 |
| F-TEST (DF numerator) | 20 |
| F-TEST (DF denominator) | 41 |
| p-value | 4.92150764586086e-12 |
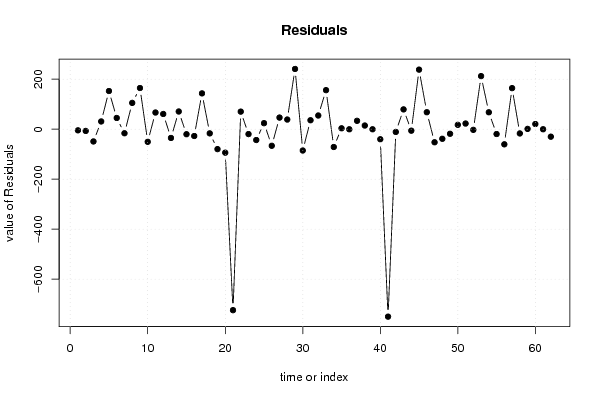
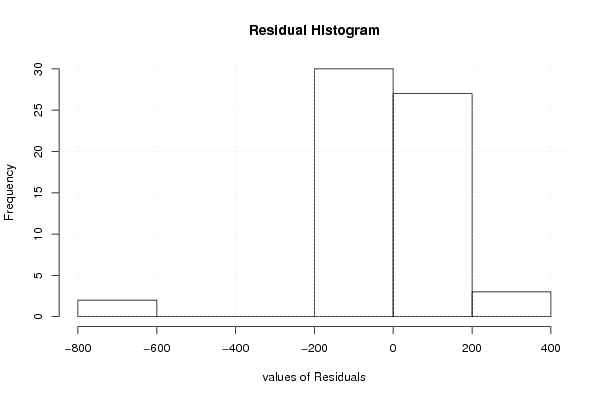
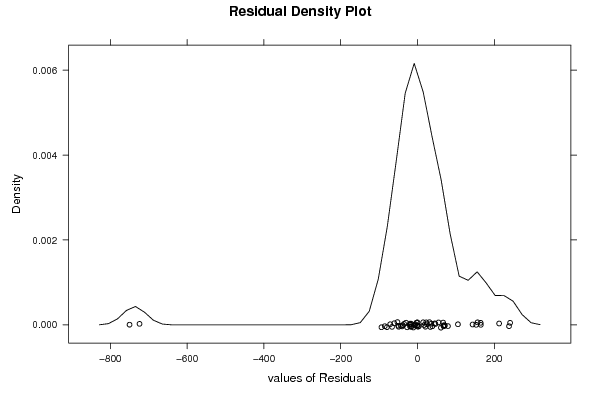
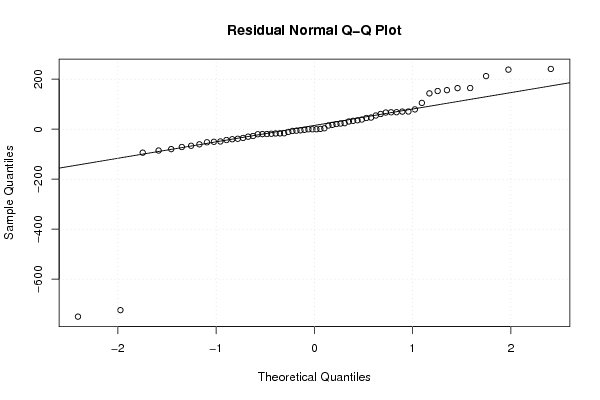
| Multiple Linear Regression - Residual Statistics | |
| Residual Standard Deviation | 190.131256540752 |
| Sum Squared Residuals | 1482145.68326437 |
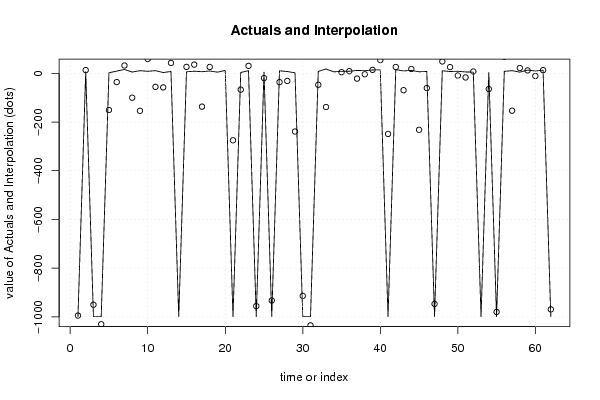
| Multiple Linear Regression - Actuals, Interpolation, and Residuals | |||
| Time or Index | Actuals | Interpolation Forecast | Residuals Prediction Error |
| 1 | -999 | -994.515088758222 | -4.48491124177846 |
| 2 | 6.3 | 13.1740849578628 | -6.87408495786285 |
| 3 | -999 | -950.03093021493 | -48.9690697850707 |
| 4 | -999 | -1030.08335953264 | 31.0833595326379 |
| 5 | 2.1 | -150.764310272676 | 152.864310272676 |
| 6 | 9.1 | -35.923364006664 | 45.023364006664 |
| 7 | 15.8 | 31.9930009720007 | -16.1930009720007 |
| 8 | 5.2 | -100.147990587041 | 105.347990587041 |
| 9 | 10.9 | -153.955936653129 | 164.855936653129 |
| 10 | 8.3 | 58.7148765227258 | -50.4148765227258 |
| 11 | 11 | -55.761341384542 | 66.761341384542 |
| 12 | 3.2 | -57.8075601513587 | 61.0075601513587 |
| 13 | 7.6 | 42.5651527336073 | -34.9651527336073 |
| 14 | -999 | -1069.86309073897 | 70.8630907389658 |
| 15 | 6.3 | 26.3548398258306 | -20.0548398258306 |
| 16 | 8.6 | 35.7994466527246 | -27.1994466527246 |
| 17 | 6.6 | -136.826621445105 | 143.426621445105 |
| 18 | 9.5 | 26.112590548917 | -16.612590548917 |
| 19 | 4.8 | 84.4364166992267 | -79.6364166992267 |
| 20 | 12 | 105.880952556103 | -93.8809525561028 |
| 21 | -999 | -274.932601810589 | -724.06739818941 |
| 22 | 3.3 | -67.144719340445 | 70.444719340445 |
| 23 | 11 | 30.4996608760066 | -19.4996608760066 |
| 24 | -999 | -955.774489165013 | -43.2255108349874 |
| 25 | 4.7 | -19.5139602960413 | 24.2139602960413 |
| 26 | -999 | -932.695899671672 | -66.304100328328 |
| 27 | 10.4 | -36.1962942411197 | 46.5962942411197 |
| 28 | 7.4 | -31.3224335796754 | 38.7224335796754 |
| 29 | 2.1 | -239.064462387683 | 241.164462387683 |
| 30 | -999 | -913.72801693362 | -85.2719830663797 |
| 31 | -999 | -1034.87602846697 | 35.876028466971 |
| 32 | 7.7 | -47.1286849675704 | 54.8286849675704 |
| 33 | 17.9 | -138.45696554878 | 156.35696554878 |
| 34 | 6.1 | 77.2570546730813 | -71.1570546730813 |
| 35 | 8.2 | 4.55637979951042 | 3.64362020048958 |
| 36 | 8.4 | 8.68995344140126 | -0.289953441401265 |
| 37 | 11.9 | -21.6669511891974 | 33.5669511891974 |
| 38 | 10.8 | -3.9135735399624 | 14.7135735399624 |
| 39 | 13.8 | 14.0736944875502 | -0.273694487550242 |
| 40 | 14.3 | 54.3727540606055 | -40.0727540606055 |
| 41 | -999 | -248.924798881353 | -750.075201118647 |
| 42 | 15.2 | 26.0355909316646 | -10.8355909316646 |
| 43 | 10 | -69.3129651709281 | 79.3129651709281 |
| 44 | 11.9 | 17.7688597226208 | -5.86885972262078 |
| 45 | 6.5 | -231.908482230401 | 238.408482230401 |
| 46 | 7.5 | -60.4970160661213 | 67.9970160661213 |
| 47 | -999 | -946.7487195331 | -52.2512804668993 |
| 48 | 10.6 | 48.8251167178543 | -38.2251167178543 |
| 49 | 7.4 | 25.5879708501672 | -18.1879708501672 |
| 50 | 8.4 | -9.09437304098455 | 17.4943730409845 |
| 51 | 5.7 | -17.0013098573319 | 22.7013098573319 |
| 52 | 4.9 | 7.43359239898319 | -2.53359239898319 |
| 53 | -999 | -1211.61980701318 | 212.619807013184 |
| 54 | 3.2 | -64.4968005402973 | 67.6968005402973 |
| 55 | -999 | -979.640424033328 | -19.3595759666718 |
| 56 | 8.1 | 68.5268632758874 | -60.4268632758874 |
| 57 | 11 | -153.446013757100 | 164.446013757100 |
| 58 | 4.9 | 21.7698042107590 | -16.8698042107590 |
| 59 | 13.2 | 11.8540202421259 | 1.34597975787414 |
| 60 | 9.7 | -11.0330208428841 | 20.7330208428841 |
| 61 | 12.8 | 12.9428766596857 | -0.142876659685702 |
| 62 | -999 | -969.107147966278 | -29.8928520337221 |
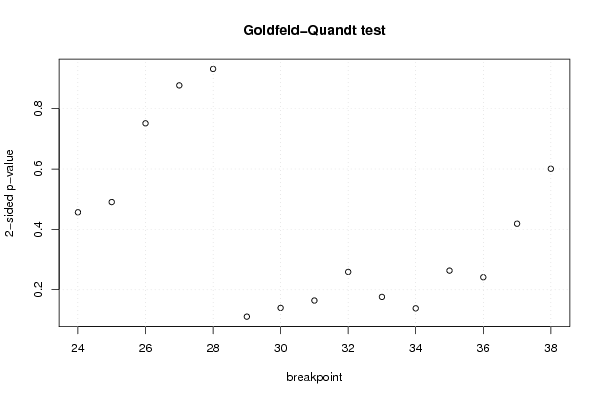
| Goldfeld-Quandt test for Heteroskedasticity | |||
| p-values | Alternative Hypothesis | ||
| breakpoint index | greater | 2-sided | less |
| 24 | 0.771726605269004 | 0.456546789461992 | 0.228273394730996 |
| 25 | 0.75478159495581 | 0.490436810088378 | 0.245218405044189 |
| 26 | 0.624268774760959 | 0.751462450478081 | 0.375731225239041 |
| 27 | 0.561434927733232 | 0.877130144533537 | 0.438565072266768 |
| 28 | 0.465815786072569 | 0.931631572145138 | 0.534184213927431 |
| 29 | 0.944682704585518 | 0.110634590828963 | 0.0553172954144817 |
| 30 | 0.930145598478507 | 0.139708803042987 | 0.0698544015214935 |
| 31 | 0.917962877095295 | 0.164074245809409 | 0.0820371229047045 |
| 32 | 0.87055382131194 | 0.258892357376119 | 0.129446178688059 |
| 33 | 0.911978506512912 | 0.176042986974176 | 0.0880214934870878 |
| 34 | 0.930850375761045 | 0.138299248477910 | 0.0691496242389548 |
| 35 | 0.868392398436788 | 0.263215203126424 | 0.131607601563212 |
| 36 | 0.879348786888365 | 0.241302426223271 | 0.120651213111635 |
| 37 | 0.790656727105735 | 0.418686545788531 | 0.209343272894265 |
| 38 | 0.699613222031766 | 0.600773555936468 | 0.300386777968234 |
| Meta Analysis of Goldfeld-Quandt test for Heteroskedasticity | |||
| Description | # significant tests | % significant tests | OK/NOK |
| 1% type I error level | 0 | 0 | OK |
| 5% type I error level | 0 | 0 | OK |
| 10% type I error level | 0 | 0 | OK |