| Multiple Linear Regression - Estimated Regression Equation |
| SWS[t] = + 11.4284987502934 -2.22094756787301Wbr[t] + e[t] |
| Multiple Linear Regression - Ordinary Least Squares | |||||
| Variable | Parameter | S.D. | T-STAT H0: parameter = 0 | 2-tail p-value | 1-tail p-value |
| (Intercept) | 11.4284987502934 | 0.700222 | 16.3213 | 0 | 0 |
| Wbr | -2.22094756787301 | 0.432617 | -5.1338 | 8e-06 | 4e-06 |
| Multiple Linear Regression - Regression Statistics | |
| Multiple R | 0.630226571304154 |
| R-squared | 0.397185531177790 |
| Adjusted R-squared | 0.382115169457235 |
| F-TEST (value) | 26.3554079552085 |
| F-TEST (DF numerator) | 1 |
| F-TEST (DF denominator) | 40 |
| p-value | 7.72398759996129e-06 |
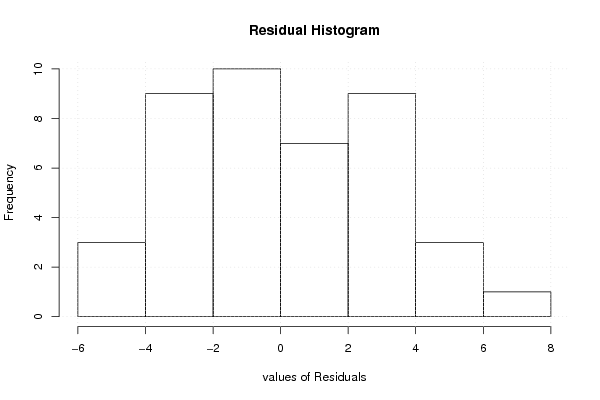
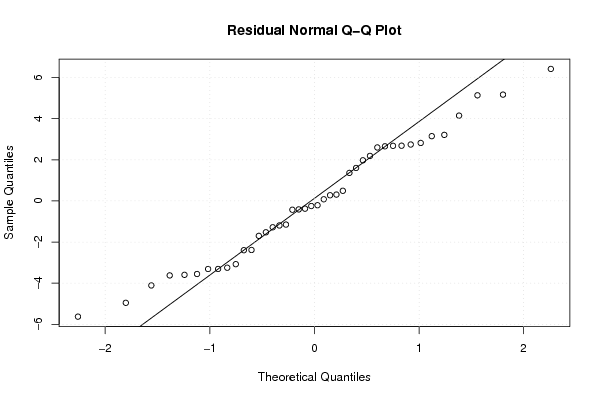
| Multiple Linear Regression - Residual Statistics | |
| Residual Standard Deviation | 3.01644238310278 |
| Sum Squared Residuals | 363.956986023151 |
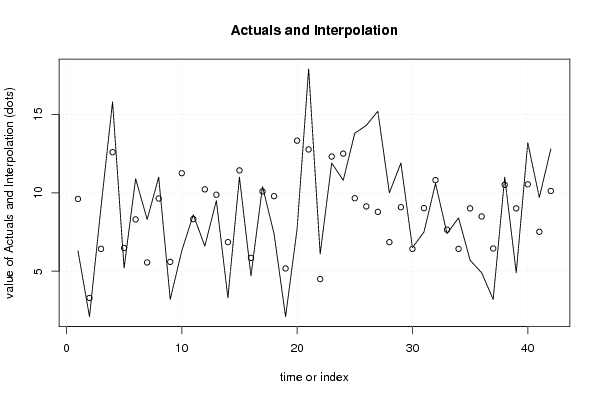
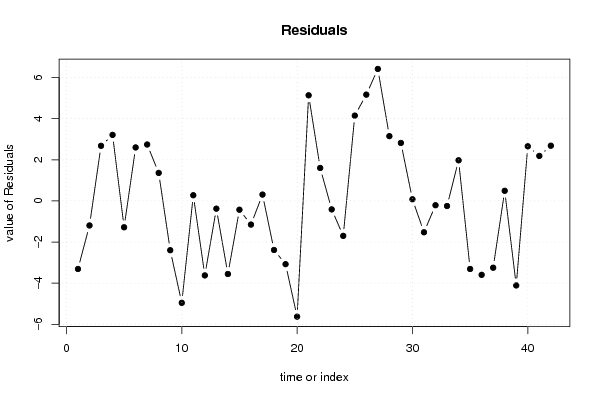
| Multiple Linear Regression - Actuals, Interpolation, and Residuals | |||
| Time or Index | Actuals | Interpolation Forecast | Residuals Prediction Error |
| 1 | 6.3 | 9.60833463886911 | -3.30833463886911 |
| 2 | 2.1 | 3.29307680584796 | -1.19307680584796 |
| 3 | 9.1 | 6.42233978557403 | 2.67766021442597 |
| 4 | 15.8 | 12.5897850272936 | 3.21021497270637 |
| 5 | 5.2 | 6.48047919132702 | -1.28047919132702 |
| 6 | 10.9 | 8.30087162504507 | 2.59912837495493 |
| 7 | 8.3 | 5.55752895874379 | 2.74247104125621 |
| 8 | 11 | 9.63801529777016 | 1.36198470222984 |
| 9 | 3.2 | 5.59553449979803 | -2.39553449979803 |
| 10 | 6.3 | 11.2526413545685 | -4.95264135456853 |
| 11 | 8.6 | 8.32374728727246 | 0.276252712727536 |
| 12 | 6.6 | 10.2201521512142 | -3.62015215121416 |
| 13 | 9.5 | 9.8761230198934 | -0.376123019893400 |
| 14 | 3.3 | 6.85179689442422 | -3.55179689442422 |
| 15 | 11 | 11.4284987502934 | -0.428498750293388 |
| 16 | 4.7 | 5.84973750889976 | -1.14973750889976 |
| 17 | 10.4 | 10.0913550775683 | 0.308644922431709 |
| 18 | 7.4 | 9.78419203681492 | -2.38419203681492 |
| 19 | 2.1 | 5.17377448451486 | -3.07377448451486 |
| 20 | 7.7 | 13.3249036120141 | -5.62490361201414 |
| 21 | 17.9 | 12.7656424230185 | 5.13435757698152 |
| 22 | 6.1 | 4.49786766787102 | 1.60213233212898 |
| 23 | 11.9 | 12.3123026454413 | -0.412302645441301 |
| 24 | 10.8 | 12.4978540442151 | -1.69785404421514 |
| 25 | 13.8 | 9.65320530208956 | 4.14679469791044 |
| 26 | 14.3 | 9.13331877504394 | 5.16668122495606 |
| 27 | 15.2 | 8.78483446065814 | 6.41516553934186 |
| 28 | 10 | 6.85179689442422 | 3.14820310557578 |
| 29 | 11.9 | 9.08116849199175 | 2.81883150800825 |
| 30 | 6.5 | 6.41965676542277 | 0.0803432345772338 |
| 31 | 7.5 | 9.02368921626341 | -1.52368921626341 |
| 32 | 10.6 | 10.8094016181166 | -0.209401618116594 |
| 33 | 7.4 | 7.64748979189144 | -0.247489791891442 |
| 34 | 8.4 | 6.4250302903186 | 1.9749697096814 |
| 35 | 5.7 | 9.00787664480557 | -3.30787664480557 |
| 36 | 4.9 | 8.49191902286837 | -3.59191902286837 |
| 37 | 3.2 | 6.44682885072022 | -3.24682885072022 |
| 38 | 11 | 10.5068647023207 | 0.493135297679333 |
| 39 | 4.9 | 9.00787664480557 | -4.10787664480557 |
| 40 | 13.2 | 10.5446948551455 | 2.65530514485453 |
| 41 | 9.7 | 7.5120176358999 | 2.18798236410009 |
| 42 | 12.8 | 10.1157752489209 | 2.68422475107908 |
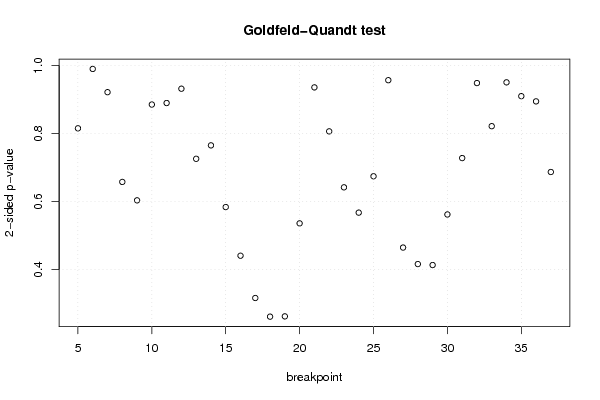
| Goldfeld-Quandt test for Heteroskedasticity | |||
| p-values | Alternative Hypothesis | ||
| breakpoint index | greater | 2-sided | less |
| 5 | 0.592463958579386 | 0.815072082841228 | 0.407536041420614 |
| 6 | 0.505268299805008 | 0.989463400389983 | 0.494731700194992 |
| 7 | 0.460587902489802 | 0.921175804979604 | 0.539412097510198 |
| 8 | 0.328765104946341 | 0.657530209892682 | 0.671234895053659 |
| 9 | 0.301717633590823 | 0.603435267181646 | 0.698282366409177 |
| 10 | 0.557549030344352 | 0.884901939311297 | 0.442450969655648 |
| 11 | 0.444682426383708 | 0.889364852767415 | 0.555317573616292 |
| 12 | 0.465680658112681 | 0.931361316225362 | 0.534319341887319 |
| 13 | 0.362748253728224 | 0.725496507456448 | 0.637251746271776 |
| 14 | 0.382484636527333 | 0.764969273054665 | 0.617515363472667 |
| 15 | 0.291848603234538 | 0.583697206469076 | 0.708151396765462 |
| 16 | 0.220381548245451 | 0.440763096490901 | 0.77961845175455 |
| 17 | 0.158259207412718 | 0.316518414825437 | 0.841740792587282 |
| 18 | 0.130862190229717 | 0.261724380459434 | 0.869137809770283 |
| 19 | 0.131280549272657 | 0.262561098545314 | 0.868719450727343 |
| 20 | 0.267892846905056 | 0.535785693810112 | 0.732107153094944 |
| 21 | 0.467653110681435 | 0.93530622136287 | 0.532346889318565 |
| 22 | 0.403067600708499 | 0.806135201416998 | 0.596932399291501 |
| 23 | 0.320844254378805 | 0.64168850875761 | 0.679155745621195 |
| 24 | 0.283657145798584 | 0.567314291597169 | 0.716342854201416 |
| 25 | 0.337088208945634 | 0.674176417891269 | 0.662911791054366 |
| 26 | 0.478209437952983 | 0.956418875905966 | 0.521790562047017 |
| 27 | 0.767638978627543 | 0.464722042744915 | 0.232361021372457 |
| 28 | 0.791864832874409 | 0.416270334251182 | 0.208135167125591 |
| 29 | 0.793347359294142 | 0.413305281411716 | 0.206652640705858 |
| 30 | 0.719035775710762 | 0.561928448578476 | 0.280964224289238 |
| 31 | 0.636170399456495 | 0.72765920108701 | 0.363829600543505 |
| 32 | 0.525976808053036 | 0.948046383893928 | 0.474023191946964 |
| 33 | 0.4106733964299 | 0.8213467928598 | 0.5893266035701 |
| 34 | 0.475056875356276 | 0.950113750712552 | 0.524943124643724 |
| 35 | 0.454771269618456 | 0.909542539236912 | 0.545228730381544 |
| 36 | 0.447105023055059 | 0.894210046110117 | 0.552894976944941 |
| 37 | 0.343349668981739 | 0.686699337963477 | 0.656650331018261 |
| Meta Analysis of Goldfeld-Quandt test for Heteroskedasticity | |||
| Description | # significant tests | % significant tests | OK/NOK |
| 1% type I error level | 0 | 0 | OK |
| 5% type I error level | 0 | 0 | OK |
| 10% type I error level | 0 | 0 | OK |