Free Statistics

of Irreproducible Research!

Author's title

Author*The author of this computation has been verified*
R Software Modulerwasp_multipleregression.wasp
Title produced by softwareMultiple Regression
Date of computationTue, 14 Dec 2010 16:43:37 +0000
Cite this page as followsStatistical Computations at FreeStatistics.org, Office for Research Development and Education, URL https://freestatistics.org/blog/index.php?v=date/2010/Dec/14/t1292345076j1h156es4nqf9bd.htm/, Retrieved Thu, 02 May 2024 22:19:04 +0000
Statistical Computations at FreeStatistics.org, Office for Research Development and Education, URL https://freestatistics.org/blog/index.php?pk=109875, Retrieved Thu, 02 May 2024 22:19:04 +0000
QR Codes:

Original text written by user:
IsPrivate?No (this computation is public)
User-defined keywords
Estimated Impact154
Family? (F = Feedback message, R = changed R code, M = changed R Module, P = changed Parameters, D = changed Data)
-     [Multiple Regression] [Competence to learn] [2010-11-17 07:43:53] [b98453cac15ba1066b407e146608df68]
-    D  [Multiple Regression] [Poging 1] [2010-11-20 16:08:07] [26379b86c25fbf0febe6a7a428e65173]
-   P     [Multiple Regression] [Multiple regressi...] [2010-11-21 12:41:20] [26379b86c25fbf0febe6a7a428e65173]
-           [Multiple Regression] [Multiple regressi...] [2010-11-21 12:49:51] [26379b86c25fbf0febe6a7a428e65173]
-   PD        [Multiple Regression] [Meervoudige regre...] [2010-11-29 20:14:20] [26379b86c25fbf0febe6a7a428e65173]
-    D          [Multiple Regression] [Meervoudige regre...] [2010-12-11 18:22:44] [26379b86c25fbf0febe6a7a428e65173]
-    D            [Multiple Regression] [MR (SWS=te verkla...] [2010-12-14 16:32:07] [2c7c841db524046f0462b1835d20d1ce]
-   PD                [Multiple Regression] [SWS (te verklaren...] [2010-12-14 16:43:37] [bff44ea937c3f909b1dc9a8bfab919e2] [Current]
-    D                  [Multiple Regression] [MR: PS (te verkla...] [2010-12-14 17:03:27] [26379b86c25fbf0febe6a7a428e65173]
Feedback Forum

Post a new message
Dataseries X:
0,819543936	6,3
3,663040975	2,1
2,254064453	9,1
-0,522878745	15,8
2,227886705	5,2
1,408239965	10,9
2,643452676	8,3
0,806179974	11
2,626340367	3,2
0,079181246	6,3
1,397940009	8,6
0,544068044	6,6
0,698970004	9,5
2,06069784	3,3
0	11
2,511883361	4,7
0,602059991	10,4
0,740362689	7,4
2,8162413	2,1
-0,853871964	7,7
-0,602059991	17,9
3,120573931	6,1
-0,397940009	11,9
-0,48148606	10,8
0,799340549	13,8
1,033423755	14,3
1,190331698	15,2
2,06069784	10
1,056904851	11,9
2,255272505	6,5
1,08278537	7,5
0,278753601	10,6
1,702430536	7,4
2,252853031	8,4
1,089905111	5,7
1,322219295	4,9
2,243038049	3,2
0,414973348	11
1,089905111	4,9
0,397940009	13,2
1,763427994	9,7
0,591064607	12,8


Summary of computational transaction
Raw Inputview raw input (R code)
Raw Outputview raw output of R engine
Computing time5 seconds
R Server'Sir Ronald Aylmer Fisher' @ 193.190.124.24

\begin{tabular}{lllllllll}
\hline
Summary of computational transaction \tabularnewline
Raw Input & view raw input (R code)  \tabularnewline
Raw Output & view raw output of R engine  \tabularnewline
Computing time & 5 seconds \tabularnewline
R Server & 'Sir Ronald Aylmer Fisher' @ 193.190.124.24 \tabularnewline
\hline
\end{tabular}
%Source: https://freestatistics.org/blog/index.php?pk=109875&T=0

[TABLE]
[ROW][C]Summary of computational transaction[/C][/ROW]
[ROW][C]Raw Input[/C][C]view raw input (R code) [/C][/ROW]
[ROW][C]Raw Output[/C][C]view raw output of R engine [/C][/ROW]
[ROW][C]Computing time[/C][C]5 seconds[/C][/ROW]
[ROW][C]R Server[/C][C]'Sir Ronald Aylmer Fisher' @ 193.190.124.24[/C][/ROW]
[/TABLE]
Source: https://freestatistics.org/blog/index.php?pk=109875&T=0

Globally Unique Identifier (entire table): ba.freestatistics.org/blog/index.php?pk=109875&T=0

As an alternative you can also use a QR Code:  

The GUIDs for individual cells are displayed in the table below:

Summary of computational transaction
Raw Inputview raw input (R code)
Raw Outputview raw output of R engine
Computing time5 seconds
R Server'Sir Ronald Aylmer Fisher' @ 193.190.124.24


Multiple Linear Regression - Estimated Regression Equation
SWS[t] = + 11.4284987502934 -2.22094756787301Wbr[t] + e[t]

\begin{tabular}{lllllllll}
\hline
Multiple Linear Regression - Estimated Regression Equation \tabularnewline
SWS[t] =  +  11.4284987502934 -2.22094756787301Wbr[t]  + e[t] \tabularnewline
\hline
\end{tabular}
%Source: https://freestatistics.org/blog/index.php?pk=109875&T=1

[TABLE]
[ROW][C]Multiple Linear Regression - Estimated Regression Equation[/C][/ROW]
[ROW][C]SWS[t] =  +  11.4284987502934 -2.22094756787301Wbr[t]  + e[t][/C][/ROW]
[/TABLE]
Source: https://freestatistics.org/blog/index.php?pk=109875&T=1

Globally Unique Identifier (entire table): ba.freestatistics.org/blog/index.php?pk=109875&T=1

As an alternative you can also use a QR Code:  

The GUIDs for individual cells are displayed in the table below:

Multiple Linear Regression - Estimated Regression Equation
SWS[t] = + 11.4284987502934 -2.22094756787301Wbr[t] + e[t]


Multiple Linear Regression - Ordinary Least Squares
VariableParameterS.D.T-STATH0: parameter = 02-tail p-value1-tail p-value
(Intercept)11.42849875029340.70022216.321300
Wbr-2.220947567873010.432617-5.13388e-064e-06

\begin{tabular}{lllllllll}
\hline
Multiple Linear Regression - Ordinary Least Squares \tabularnewline
Variable & Parameter & S.D. & T-STATH0: parameter = 0 & 2-tail p-value & 1-tail p-value \tabularnewline
(Intercept) & 11.4284987502934 & 0.700222 & 16.3213 & 0 & 0 \tabularnewline
Wbr & -2.22094756787301 & 0.432617 & -5.1338 & 8e-06 & 4e-06 \tabularnewline
\hline
\end{tabular}
%Source: https://freestatistics.org/blog/index.php?pk=109875&T=2

[TABLE]
[ROW][C]Multiple Linear Regression - Ordinary Least Squares[/C][/ROW]
[ROW][C]Variable[/C][C]Parameter[/C][C]S.D.[/C][C]T-STATH0: parameter = 0[/C][C]2-tail p-value[/C][C]1-tail p-value[/C][/ROW]
[ROW][C](Intercept)[/C][C]11.4284987502934[/C][C]0.700222[/C][C]16.3213[/C][C]0[/C][C]0[/C][/ROW]
[ROW][C]Wbr[/C][C]-2.22094756787301[/C][C]0.432617[/C][C]-5.1338[/C][C]8e-06[/C][C]4e-06[/C][/ROW]
[/TABLE]
Source: https://freestatistics.org/blog/index.php?pk=109875&T=2

Globally Unique Identifier (entire table): ba.freestatistics.org/blog/index.php?pk=109875&T=2

As an alternative you can also use a QR Code:  

The GUIDs for individual cells are displayed in the table below:

Multiple Linear Regression - Ordinary Least Squares
VariableParameterS.D.T-STATH0: parameter = 02-tail p-value1-tail p-value
(Intercept)11.42849875029340.70022216.321300
Wbr-2.220947567873010.432617-5.13388e-064e-06


Multiple Linear Regression - Regression Statistics
Multiple R0.630226571304154
R-squared0.397185531177790
Adjusted R-squared0.382115169457235
F-TEST (value)26.3554079552085
F-TEST (DF numerator)1
F-TEST (DF denominator)40
p-value7.72398759996129e-06
Multiple Linear Regression - Residual Statistics
Residual Standard Deviation3.01644238310278
Sum Squared Residuals363.956986023151

\begin{tabular}{lllllllll}
\hline
Multiple Linear Regression - Regression Statistics \tabularnewline
Multiple R & 0.630226571304154 \tabularnewline
R-squared & 0.397185531177790 \tabularnewline
Adjusted R-squared & 0.382115169457235 \tabularnewline
F-TEST (value) & 26.3554079552085 \tabularnewline
F-TEST (DF numerator) & 1 \tabularnewline
F-TEST (DF denominator) & 40 \tabularnewline
p-value & 7.72398759996129e-06 \tabularnewline
Multiple Linear Regression - Residual Statistics \tabularnewline
Residual Standard Deviation & 3.01644238310278 \tabularnewline
Sum Squared Residuals & 363.956986023151 \tabularnewline
\hline
\end{tabular}
%Source: https://freestatistics.org/blog/index.php?pk=109875&T=3

[TABLE]
[ROW][C]Multiple Linear Regression - Regression Statistics[/C][/ROW]
[ROW][C]Multiple R[/C][C]0.630226571304154[/C][/ROW]
[ROW][C]R-squared[/C][C]0.397185531177790[/C][/ROW]
[ROW][C]Adjusted R-squared[/C][C]0.382115169457235[/C][/ROW]
[ROW][C]F-TEST (value)[/C][C]26.3554079552085[/C][/ROW]
[ROW][C]F-TEST (DF numerator)[/C][C]1[/C][/ROW]
[ROW][C]F-TEST (DF denominator)[/C][C]40[/C][/ROW]
[ROW][C]p-value[/C][C]7.72398759996129e-06[/C][/ROW]
[ROW][C]Multiple Linear Regression - Residual Statistics[/C][/ROW]
[ROW][C]Residual Standard Deviation[/C][C]3.01644238310278[/C][/ROW]
[ROW][C]Sum Squared Residuals[/C][C]363.956986023151[/C][/ROW]
[/TABLE]
Source: https://freestatistics.org/blog/index.php?pk=109875&T=3

Globally Unique Identifier (entire table): ba.freestatistics.org/blog/index.php?pk=109875&T=3

As an alternative you can also use a QR Code:  

The GUIDs for individual cells are displayed in the table below:

Multiple Linear Regression - Regression Statistics
Multiple R0.630226571304154
R-squared0.397185531177790
Adjusted R-squared0.382115169457235
F-TEST (value)26.3554079552085
F-TEST (DF numerator)1
F-TEST (DF denominator)40
p-value7.72398759996129e-06
Multiple Linear Regression - Residual Statistics
Residual Standard Deviation3.01644238310278
Sum Squared Residuals363.956986023151


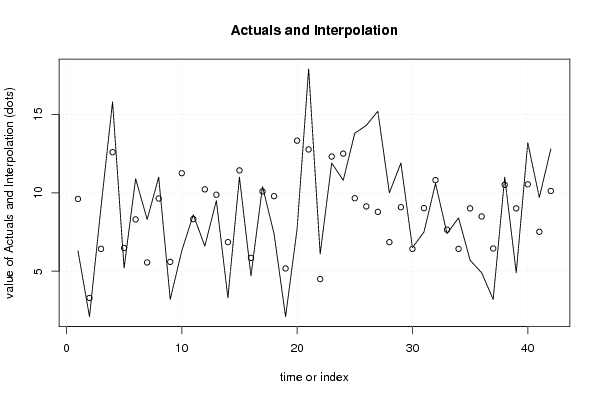
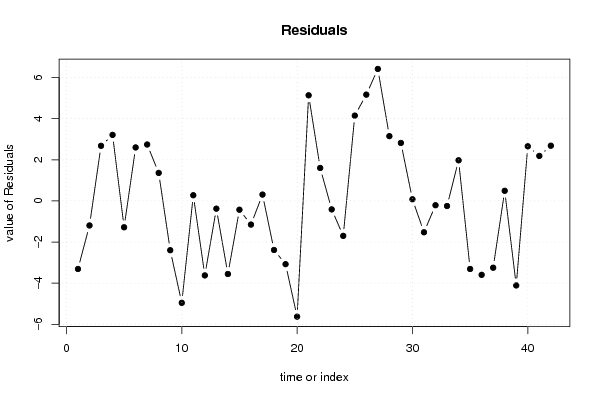
Multiple Linear Regression - Actuals, Interpolation, and Residuals
Time or IndexActualsInterpolationForecastResidualsPrediction Error
16.39.60833463886911-3.30833463886911
22.13.29307680584796-1.19307680584796
39.16.422339785574032.67766021442597
415.812.58978502729363.21021497270637
55.26.48047919132702-1.28047919132702
610.98.300871625045072.59912837495493
78.35.557528958743792.74247104125621
8119.638015297770161.36198470222984
93.25.59553449979803-2.39553449979803
106.311.2526413545685-4.95264135456853
118.68.323747287272460.276252712727536
126.610.2201521512142-3.62015215121416
139.59.8761230198934-0.376123019893400
143.36.85179689442422-3.55179689442422
151111.4284987502934-0.428498750293388
164.75.84973750889976-1.14973750889976
1710.410.09135507756830.308644922431709
187.49.78419203681492-2.38419203681492
192.15.17377448451486-3.07377448451486
207.713.3249036120141-5.62490361201414
2117.912.76564242301855.13435757698152
226.14.497867667871021.60213233212898
2311.912.3123026454413-0.412302645441301
2410.812.4978540442151-1.69785404421514
2513.89.653205302089564.14679469791044
2614.39.133318775043945.16668122495606
2715.28.784834460658146.41516553934186
28106.851796894424223.14820310557578
2911.99.081168491991752.81883150800825
306.56.419656765422770.0803432345772338
317.59.02368921626341-1.52368921626341
3210.610.8094016181166-0.209401618116594
337.47.64748979189144-0.247489791891442
348.46.42503029031861.9749697096814
355.79.00787664480557-3.30787664480557
364.98.49191902286837-3.59191902286837
373.26.44682885072022-3.24682885072022
381110.50686470232070.493135297679333
394.99.00787664480557-4.10787664480557
4013.210.54469485514552.65530514485453
419.77.51201763589992.18798236410009
4212.810.11577524892092.68422475107908

\begin{tabular}{lllllllll}
\hline
Multiple Linear Regression - Actuals, Interpolation, and Residuals \tabularnewline
Time or Index & Actuals & InterpolationForecast & ResidualsPrediction Error \tabularnewline
1 & 6.3 & 9.60833463886911 & -3.30833463886911 \tabularnewline
2 & 2.1 & 3.29307680584796 & -1.19307680584796 \tabularnewline
3 & 9.1 & 6.42233978557403 & 2.67766021442597 \tabularnewline
4 & 15.8 & 12.5897850272936 & 3.21021497270637 \tabularnewline
5 & 5.2 & 6.48047919132702 & -1.28047919132702 \tabularnewline
6 & 10.9 & 8.30087162504507 & 2.59912837495493 \tabularnewline
7 & 8.3 & 5.55752895874379 & 2.74247104125621 \tabularnewline
8 & 11 & 9.63801529777016 & 1.36198470222984 \tabularnewline
9 & 3.2 & 5.59553449979803 & -2.39553449979803 \tabularnewline
10 & 6.3 & 11.2526413545685 & -4.95264135456853 \tabularnewline
11 & 8.6 & 8.32374728727246 & 0.276252712727536 \tabularnewline
12 & 6.6 & 10.2201521512142 & -3.62015215121416 \tabularnewline
13 & 9.5 & 9.8761230198934 & -0.376123019893400 \tabularnewline
14 & 3.3 & 6.85179689442422 & -3.55179689442422 \tabularnewline
15 & 11 & 11.4284987502934 & -0.428498750293388 \tabularnewline
16 & 4.7 & 5.84973750889976 & -1.14973750889976 \tabularnewline
17 & 10.4 & 10.0913550775683 & 0.308644922431709 \tabularnewline
18 & 7.4 & 9.78419203681492 & -2.38419203681492 \tabularnewline
19 & 2.1 & 5.17377448451486 & -3.07377448451486 \tabularnewline
20 & 7.7 & 13.3249036120141 & -5.62490361201414 \tabularnewline
21 & 17.9 & 12.7656424230185 & 5.13435757698152 \tabularnewline
22 & 6.1 & 4.49786766787102 & 1.60213233212898 \tabularnewline
23 & 11.9 & 12.3123026454413 & -0.412302645441301 \tabularnewline
24 & 10.8 & 12.4978540442151 & -1.69785404421514 \tabularnewline
25 & 13.8 & 9.65320530208956 & 4.14679469791044 \tabularnewline
26 & 14.3 & 9.13331877504394 & 5.16668122495606 \tabularnewline
27 & 15.2 & 8.78483446065814 & 6.41516553934186 \tabularnewline
28 & 10 & 6.85179689442422 & 3.14820310557578 \tabularnewline
29 & 11.9 & 9.08116849199175 & 2.81883150800825 \tabularnewline
30 & 6.5 & 6.41965676542277 & 0.0803432345772338 \tabularnewline
31 & 7.5 & 9.02368921626341 & -1.52368921626341 \tabularnewline
32 & 10.6 & 10.8094016181166 & -0.209401618116594 \tabularnewline
33 & 7.4 & 7.64748979189144 & -0.247489791891442 \tabularnewline
34 & 8.4 & 6.4250302903186 & 1.9749697096814 \tabularnewline
35 & 5.7 & 9.00787664480557 & -3.30787664480557 \tabularnewline
36 & 4.9 & 8.49191902286837 & -3.59191902286837 \tabularnewline
37 & 3.2 & 6.44682885072022 & -3.24682885072022 \tabularnewline
38 & 11 & 10.5068647023207 & 0.493135297679333 \tabularnewline
39 & 4.9 & 9.00787664480557 & -4.10787664480557 \tabularnewline
40 & 13.2 & 10.5446948551455 & 2.65530514485453 \tabularnewline
41 & 9.7 & 7.5120176358999 & 2.18798236410009 \tabularnewline
42 & 12.8 & 10.1157752489209 & 2.68422475107908 \tabularnewline
\hline
\end{tabular}
%Source: https://freestatistics.org/blog/index.php?pk=109875&T=4

[TABLE]
[ROW][C]Multiple Linear Regression - Actuals, Interpolation, and Residuals[/C][/ROW]
[ROW][C]Time or Index[/C][C]Actuals[/C][C]InterpolationForecast[/C][C]ResidualsPrediction Error[/C][/ROW]
[ROW][C]1[/C][C]6.3[/C][C]9.60833463886911[/C][C]-3.30833463886911[/C][/ROW]
[ROW][C]2[/C][C]2.1[/C][C]3.29307680584796[/C][C]-1.19307680584796[/C][/ROW]
[ROW][C]3[/C][C]9.1[/C][C]6.42233978557403[/C][C]2.67766021442597[/C][/ROW]
[ROW][C]4[/C][C]15.8[/C][C]12.5897850272936[/C][C]3.21021497270637[/C][/ROW]
[ROW][C]5[/C][C]5.2[/C][C]6.48047919132702[/C][C]-1.28047919132702[/C][/ROW]
[ROW][C]6[/C][C]10.9[/C][C]8.30087162504507[/C][C]2.59912837495493[/C][/ROW]
[ROW][C]7[/C][C]8.3[/C][C]5.55752895874379[/C][C]2.74247104125621[/C][/ROW]
[ROW][C]8[/C][C]11[/C][C]9.63801529777016[/C][C]1.36198470222984[/C][/ROW]
[ROW][C]9[/C][C]3.2[/C][C]5.59553449979803[/C][C]-2.39553449979803[/C][/ROW]
[ROW][C]10[/C][C]6.3[/C][C]11.2526413545685[/C][C]-4.95264135456853[/C][/ROW]
[ROW][C]11[/C][C]8.6[/C][C]8.32374728727246[/C][C]0.276252712727536[/C][/ROW]
[ROW][C]12[/C][C]6.6[/C][C]10.2201521512142[/C][C]-3.62015215121416[/C][/ROW]
[ROW][C]13[/C][C]9.5[/C][C]9.8761230198934[/C][C]-0.376123019893400[/C][/ROW]
[ROW][C]14[/C][C]3.3[/C][C]6.85179689442422[/C][C]-3.55179689442422[/C][/ROW]
[ROW][C]15[/C][C]11[/C][C]11.4284987502934[/C][C]-0.428498750293388[/C][/ROW]
[ROW][C]16[/C][C]4.7[/C][C]5.84973750889976[/C][C]-1.14973750889976[/C][/ROW]
[ROW][C]17[/C][C]10.4[/C][C]10.0913550775683[/C][C]0.308644922431709[/C][/ROW]
[ROW][C]18[/C][C]7.4[/C][C]9.78419203681492[/C][C]-2.38419203681492[/C][/ROW]
[ROW][C]19[/C][C]2.1[/C][C]5.17377448451486[/C][C]-3.07377448451486[/C][/ROW]
[ROW][C]20[/C][C]7.7[/C][C]13.3249036120141[/C][C]-5.62490361201414[/C][/ROW]
[ROW][C]21[/C][C]17.9[/C][C]12.7656424230185[/C][C]5.13435757698152[/C][/ROW]
[ROW][C]22[/C][C]6.1[/C][C]4.49786766787102[/C][C]1.60213233212898[/C][/ROW]
[ROW][C]23[/C][C]11.9[/C][C]12.3123026454413[/C][C]-0.412302645441301[/C][/ROW]
[ROW][C]24[/C][C]10.8[/C][C]12.4978540442151[/C][C]-1.69785404421514[/C][/ROW]
[ROW][C]25[/C][C]13.8[/C][C]9.65320530208956[/C][C]4.14679469791044[/C][/ROW]
[ROW][C]26[/C][C]14.3[/C][C]9.13331877504394[/C][C]5.16668122495606[/C][/ROW]
[ROW][C]27[/C][C]15.2[/C][C]8.78483446065814[/C][C]6.41516553934186[/C][/ROW]
[ROW][C]28[/C][C]10[/C][C]6.85179689442422[/C][C]3.14820310557578[/C][/ROW]
[ROW][C]29[/C][C]11.9[/C][C]9.08116849199175[/C][C]2.81883150800825[/C][/ROW]
[ROW][C]30[/C][C]6.5[/C][C]6.41965676542277[/C][C]0.0803432345772338[/C][/ROW]
[ROW][C]31[/C][C]7.5[/C][C]9.02368921626341[/C][C]-1.52368921626341[/C][/ROW]
[ROW][C]32[/C][C]10.6[/C][C]10.8094016181166[/C][C]-0.209401618116594[/C][/ROW]
[ROW][C]33[/C][C]7.4[/C][C]7.64748979189144[/C][C]-0.247489791891442[/C][/ROW]
[ROW][C]34[/C][C]8.4[/C][C]6.4250302903186[/C][C]1.9749697096814[/C][/ROW]
[ROW][C]35[/C][C]5.7[/C][C]9.00787664480557[/C][C]-3.30787664480557[/C][/ROW]
[ROW][C]36[/C][C]4.9[/C][C]8.49191902286837[/C][C]-3.59191902286837[/C][/ROW]
[ROW][C]37[/C][C]3.2[/C][C]6.44682885072022[/C][C]-3.24682885072022[/C][/ROW]
[ROW][C]38[/C][C]11[/C][C]10.5068647023207[/C][C]0.493135297679333[/C][/ROW]
[ROW][C]39[/C][C]4.9[/C][C]9.00787664480557[/C][C]-4.10787664480557[/C][/ROW]
[ROW][C]40[/C][C]13.2[/C][C]10.5446948551455[/C][C]2.65530514485453[/C][/ROW]
[ROW][C]41[/C][C]9.7[/C][C]7.5120176358999[/C][C]2.18798236410009[/C][/ROW]
[ROW][C]42[/C][C]12.8[/C][C]10.1157752489209[/C][C]2.68422475107908[/C][/ROW]
[/TABLE]
Source: https://freestatistics.org/blog/index.php?pk=109875&T=4

Globally Unique Identifier (entire table): ba.freestatistics.org/blog/index.php?pk=109875&T=4

As an alternative you can also use a QR Code:  

The GUIDs for individual cells are displayed in the table below:

Multiple Linear Regression - Actuals, Interpolation, and Residuals
Time or IndexActualsInterpolationForecastResidualsPrediction Error
16.39.60833463886911-3.30833463886911
22.13.29307680584796-1.19307680584796
39.16.422339785574032.67766021442597
415.812.58978502729363.21021497270637
55.26.48047919132702-1.28047919132702
610.98.300871625045072.59912837495493
78.35.557528958743792.74247104125621
8119.638015297770161.36198470222984
93.25.59553449979803-2.39553449979803
106.311.2526413545685-4.95264135456853
118.68.323747287272460.276252712727536
126.610.2201521512142-3.62015215121416
139.59.8761230198934-0.376123019893400
143.36.85179689442422-3.55179689442422
151111.4284987502934-0.428498750293388
164.75.84973750889976-1.14973750889976
1710.410.09135507756830.308644922431709
187.49.78419203681492-2.38419203681492
192.15.17377448451486-3.07377448451486
207.713.3249036120141-5.62490361201414
2117.912.76564242301855.13435757698152
226.14.497867667871021.60213233212898
2311.912.3123026454413-0.412302645441301
2410.812.4978540442151-1.69785404421514
2513.89.653205302089564.14679469791044
2614.39.133318775043945.16668122495606
2715.28.784834460658146.41516553934186
28106.851796894424223.14820310557578
2911.99.081168491991752.81883150800825
306.56.419656765422770.0803432345772338
317.59.02368921626341-1.52368921626341
3210.610.8094016181166-0.209401618116594
337.47.64748979189144-0.247489791891442
348.46.42503029031861.9749697096814
355.79.00787664480557-3.30787664480557
364.98.49191902286837-3.59191902286837
373.26.44682885072022-3.24682885072022
381110.50686470232070.493135297679333
394.99.00787664480557-4.10787664480557
4013.210.54469485514552.65530514485453
419.77.51201763589992.18798236410009
4212.810.11577524892092.68422475107908


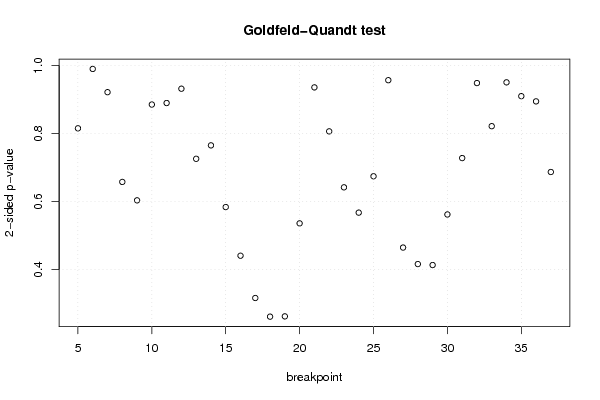
Goldfeld-Quandt test for Heteroskedasticity
p-valuesAlternative Hypothesis
breakpoint indexgreater2-sidedless
50.5924639585793860.8150720828412280.407536041420614
60.5052682998050080.9894634003899830.494731700194992
70.4605879024898020.9211758049796040.539412097510198
80.3287651049463410.6575302098926820.671234895053659
90.3017176335908230.6034352671816460.698282366409177
100.5575490303443520.8849019393112970.442450969655648
110.4446824263837080.8893648527674150.555317573616292
120.4656806581126810.9313613162253620.534319341887319
130.3627482537282240.7254965074564480.637251746271776
140.3824846365273330.7649692730546650.617515363472667
150.2918486032345380.5836972064690760.708151396765462
160.2203815482454510.4407630964909010.77961845175455
170.1582592074127180.3165184148254370.841740792587282
180.1308621902297170.2617243804594340.869137809770283
190.1312805492726570.2625610985453140.868719450727343
200.2678928469050560.5357856938101120.732107153094944
210.4676531106814350.935306221362870.532346889318565
220.4030676007084990.8061352014169980.596932399291501
230.3208442543788050.641688508757610.679155745621195
240.2836571457985840.5673142915971690.716342854201416
250.3370882089456340.6741764178912690.662911791054366
260.4782094379529830.9564188759059660.521790562047017
270.7676389786275430.4647220427449150.232361021372457
280.7918648328744090.4162703342511820.208135167125591
290.7933473592941420.4133052814117160.206652640705858
300.7190357757107620.5619284485784760.280964224289238
310.6361703994564950.727659201087010.363829600543505
320.5259768080530360.9480463838939280.474023191946964
330.41067339642990.82134679285980.5893266035701
340.4750568753562760.9501137507125520.524943124643724
350.4547712696184560.9095425392369120.545228730381544
360.4471050230550590.8942100461101170.552894976944941
370.3433496689817390.6866993379634770.656650331018261

\begin{tabular}{lllllllll}
\hline
Goldfeld-Quandt test for Heteroskedasticity \tabularnewline
p-values & Alternative Hypothesis \tabularnewline
breakpoint index & greater & 2-sided & less \tabularnewline
5 & 0.592463958579386 & 0.815072082841228 & 0.407536041420614 \tabularnewline
6 & 0.505268299805008 & 0.989463400389983 & 0.494731700194992 \tabularnewline
7 & 0.460587902489802 & 0.921175804979604 & 0.539412097510198 \tabularnewline
8 & 0.328765104946341 & 0.657530209892682 & 0.671234895053659 \tabularnewline
9 & 0.301717633590823 & 0.603435267181646 & 0.698282366409177 \tabularnewline
10 & 0.557549030344352 & 0.884901939311297 & 0.442450969655648 \tabularnewline
11 & 0.444682426383708 & 0.889364852767415 & 0.555317573616292 \tabularnewline
12 & 0.465680658112681 & 0.931361316225362 & 0.534319341887319 \tabularnewline
13 & 0.362748253728224 & 0.725496507456448 & 0.637251746271776 \tabularnewline
14 & 0.382484636527333 & 0.764969273054665 & 0.617515363472667 \tabularnewline
15 & 0.291848603234538 & 0.583697206469076 & 0.708151396765462 \tabularnewline
16 & 0.220381548245451 & 0.440763096490901 & 0.77961845175455 \tabularnewline
17 & 0.158259207412718 & 0.316518414825437 & 0.841740792587282 \tabularnewline
18 & 0.130862190229717 & 0.261724380459434 & 0.869137809770283 \tabularnewline
19 & 0.131280549272657 & 0.262561098545314 & 0.868719450727343 \tabularnewline
20 & 0.267892846905056 & 0.535785693810112 & 0.732107153094944 \tabularnewline
21 & 0.467653110681435 & 0.93530622136287 & 0.532346889318565 \tabularnewline
22 & 0.403067600708499 & 0.806135201416998 & 0.596932399291501 \tabularnewline
23 & 0.320844254378805 & 0.64168850875761 & 0.679155745621195 \tabularnewline
24 & 0.283657145798584 & 0.567314291597169 & 0.716342854201416 \tabularnewline
25 & 0.337088208945634 & 0.674176417891269 & 0.662911791054366 \tabularnewline
26 & 0.478209437952983 & 0.956418875905966 & 0.521790562047017 \tabularnewline
27 & 0.767638978627543 & 0.464722042744915 & 0.232361021372457 \tabularnewline
28 & 0.791864832874409 & 0.416270334251182 & 0.208135167125591 \tabularnewline
29 & 0.793347359294142 & 0.413305281411716 & 0.206652640705858 \tabularnewline
30 & 0.719035775710762 & 0.561928448578476 & 0.280964224289238 \tabularnewline
31 & 0.636170399456495 & 0.72765920108701 & 0.363829600543505 \tabularnewline
32 & 0.525976808053036 & 0.948046383893928 & 0.474023191946964 \tabularnewline
33 & 0.4106733964299 & 0.8213467928598 & 0.5893266035701 \tabularnewline
34 & 0.475056875356276 & 0.950113750712552 & 0.524943124643724 \tabularnewline
35 & 0.454771269618456 & 0.909542539236912 & 0.545228730381544 \tabularnewline
36 & 0.447105023055059 & 0.894210046110117 & 0.552894976944941 \tabularnewline
37 & 0.343349668981739 & 0.686699337963477 & 0.656650331018261 \tabularnewline
\hline
\end{tabular}
%Source: https://freestatistics.org/blog/index.php?pk=109875&T=5

[TABLE]
[ROW][C]Goldfeld-Quandt test for Heteroskedasticity[/C][/ROW]
[ROW][C]p-values[/C][C]Alternative Hypothesis[/C][/ROW]
[ROW][C]breakpoint index[/C][C]greater[/C][C]2-sided[/C][C]less[/C][/ROW]
[ROW][C]5[/C][C]0.592463958579386[/C][C]0.815072082841228[/C][C]0.407536041420614[/C][/ROW]
[ROW][C]6[/C][C]0.505268299805008[/C][C]0.989463400389983[/C][C]0.494731700194992[/C][/ROW]
[ROW][C]7[/C][C]0.460587902489802[/C][C]0.921175804979604[/C][C]0.539412097510198[/C][/ROW]
[ROW][C]8[/C][C]0.328765104946341[/C][C]0.657530209892682[/C][C]0.671234895053659[/C][/ROW]
[ROW][C]9[/C][C]0.301717633590823[/C][C]0.603435267181646[/C][C]0.698282366409177[/C][/ROW]
[ROW][C]10[/C][C]0.557549030344352[/C][C]0.884901939311297[/C][C]0.442450969655648[/C][/ROW]
[ROW][C]11[/C][C]0.444682426383708[/C][C]0.889364852767415[/C][C]0.555317573616292[/C][/ROW]
[ROW][C]12[/C][C]0.465680658112681[/C][C]0.931361316225362[/C][C]0.534319341887319[/C][/ROW]
[ROW][C]13[/C][C]0.362748253728224[/C][C]0.725496507456448[/C][C]0.637251746271776[/C][/ROW]
[ROW][C]14[/C][C]0.382484636527333[/C][C]0.764969273054665[/C][C]0.617515363472667[/C][/ROW]
[ROW][C]15[/C][C]0.291848603234538[/C][C]0.583697206469076[/C][C]0.708151396765462[/C][/ROW]
[ROW][C]16[/C][C]0.220381548245451[/C][C]0.440763096490901[/C][C]0.77961845175455[/C][/ROW]
[ROW][C]17[/C][C]0.158259207412718[/C][C]0.316518414825437[/C][C]0.841740792587282[/C][/ROW]
[ROW][C]18[/C][C]0.130862190229717[/C][C]0.261724380459434[/C][C]0.869137809770283[/C][/ROW]
[ROW][C]19[/C][C]0.131280549272657[/C][C]0.262561098545314[/C][C]0.868719450727343[/C][/ROW]
[ROW][C]20[/C][C]0.267892846905056[/C][C]0.535785693810112[/C][C]0.732107153094944[/C][/ROW]
[ROW][C]21[/C][C]0.467653110681435[/C][C]0.93530622136287[/C][C]0.532346889318565[/C][/ROW]
[ROW][C]22[/C][C]0.403067600708499[/C][C]0.806135201416998[/C][C]0.596932399291501[/C][/ROW]
[ROW][C]23[/C][C]0.320844254378805[/C][C]0.64168850875761[/C][C]0.679155745621195[/C][/ROW]
[ROW][C]24[/C][C]0.283657145798584[/C][C]0.567314291597169[/C][C]0.716342854201416[/C][/ROW]
[ROW][C]25[/C][C]0.337088208945634[/C][C]0.674176417891269[/C][C]0.662911791054366[/C][/ROW]
[ROW][C]26[/C][C]0.478209437952983[/C][C]0.956418875905966[/C][C]0.521790562047017[/C][/ROW]
[ROW][C]27[/C][C]0.767638978627543[/C][C]0.464722042744915[/C][C]0.232361021372457[/C][/ROW]
[ROW][C]28[/C][C]0.791864832874409[/C][C]0.416270334251182[/C][C]0.208135167125591[/C][/ROW]
[ROW][C]29[/C][C]0.793347359294142[/C][C]0.413305281411716[/C][C]0.206652640705858[/C][/ROW]
[ROW][C]30[/C][C]0.719035775710762[/C][C]0.561928448578476[/C][C]0.280964224289238[/C][/ROW]
[ROW][C]31[/C][C]0.636170399456495[/C][C]0.72765920108701[/C][C]0.363829600543505[/C][/ROW]
[ROW][C]32[/C][C]0.525976808053036[/C][C]0.948046383893928[/C][C]0.474023191946964[/C][/ROW]
[ROW][C]33[/C][C]0.4106733964299[/C][C]0.8213467928598[/C][C]0.5893266035701[/C][/ROW]
[ROW][C]34[/C][C]0.475056875356276[/C][C]0.950113750712552[/C][C]0.524943124643724[/C][/ROW]
[ROW][C]35[/C][C]0.454771269618456[/C][C]0.909542539236912[/C][C]0.545228730381544[/C][/ROW]
[ROW][C]36[/C][C]0.447105023055059[/C][C]0.894210046110117[/C][C]0.552894976944941[/C][/ROW]
[ROW][C]37[/C][C]0.343349668981739[/C][C]0.686699337963477[/C][C]0.656650331018261[/C][/ROW]
[/TABLE]
Source: https://freestatistics.org/blog/index.php?pk=109875&T=5

Globally Unique Identifier (entire table): ba.freestatistics.org/blog/index.php?pk=109875&T=5

As an alternative you can also use a QR Code:  

The GUIDs for individual cells are displayed in the table below:

Goldfeld-Quandt test for Heteroskedasticity
p-valuesAlternative Hypothesis
breakpoint indexgreater2-sidedless
50.5924639585793860.8150720828412280.407536041420614
60.5052682998050080.9894634003899830.494731700194992
70.4605879024898020.9211758049796040.539412097510198
80.3287651049463410.6575302098926820.671234895053659
90.3017176335908230.6034352671816460.698282366409177
100.5575490303443520.8849019393112970.442450969655648
110.4446824263837080.8893648527674150.555317573616292
120.4656806581126810.9313613162253620.534319341887319
130.3627482537282240.7254965074564480.637251746271776
140.3824846365273330.7649692730546650.617515363472667
150.2918486032345380.5836972064690760.708151396765462
160.2203815482454510.4407630964909010.77961845175455
170.1582592074127180.3165184148254370.841740792587282
180.1308621902297170.2617243804594340.869137809770283
190.1312805492726570.2625610985453140.868719450727343
200.2678928469050560.5357856938101120.732107153094944
210.4676531106814350.935306221362870.532346889318565
220.4030676007084990.8061352014169980.596932399291501
230.3208442543788050.641688508757610.679155745621195
240.2836571457985840.5673142915971690.716342854201416
250.3370882089456340.6741764178912690.662911791054366
260.4782094379529830.9564188759059660.521790562047017
270.7676389786275430.4647220427449150.232361021372457
280.7918648328744090.4162703342511820.208135167125591
290.7933473592941420.4133052814117160.206652640705858
300.7190357757107620.5619284485784760.280964224289238
310.6361703994564950.727659201087010.363829600543505
320.5259768080530360.9480463838939280.474023191946964
330.41067339642990.82134679285980.5893266035701
340.4750568753562760.9501137507125520.524943124643724
350.4547712696184560.9095425392369120.545228730381544
360.4471050230550590.8942100461101170.552894976944941
370.3433496689817390.6866993379634770.656650331018261


Meta Analysis of Goldfeld-Quandt test for Heteroskedasticity
Description# significant tests% significant testsOK/NOK
1% type I error level00OK
5% type I error level00OK
10% type I error level00OK

\begin{tabular}{lllllllll}
\hline
Meta Analysis of Goldfeld-Quandt test for Heteroskedasticity \tabularnewline
Description & # significant tests & % significant tests & OK/NOK \tabularnewline
1% type I error level & 0 & 0 & OK \tabularnewline
5% type I error level & 0 & 0 & OK \tabularnewline
10% type I error level & 0 & 0 & OK \tabularnewline
\hline
\end{tabular}
%Source: https://freestatistics.org/blog/index.php?pk=109875&T=6

[TABLE]
[ROW][C]Meta Analysis of Goldfeld-Quandt test for Heteroskedasticity[/C][/ROW]
[ROW][C]Description[/C][C]# significant tests[/C][C]% significant tests[/C][C]OK/NOK[/C][/ROW]
[ROW][C]1% type I error level[/C][C]0[/C][C]0[/C][C]OK[/C][/ROW]
[ROW][C]5% type I error level[/C][C]0[/C][C]0[/C][C]OK[/C][/ROW]
[ROW][C]10% type I error level[/C][C]0[/C][C]0[/C][C]OK[/C][/ROW]
[/TABLE]
Source: https://freestatistics.org/blog/index.php?pk=109875&T=6

Globally Unique Identifier (entire table): ba.freestatistics.org/blog/index.php?pk=109875&T=6

As an alternative you can also use a QR Code:  

The GUIDs for individual cells are displayed in the table below:

Meta Analysis of Goldfeld-Quandt test for Heteroskedasticity
Description# significant tests% significant testsOK/NOK
1% type I error level00OK
5% type I error level00OK
10% type I error level00OK


Parameters (Session):
par1 = 2 ; par2 = Do not include Seasonal Dummies ; par3 = No Linear Trend ;
Parameters (R input):
par1 = 2 ; par2 = Do not include Seasonal Dummies ; par3 = No Linear Trend ;
R code (references can be found in the software module):
library(lattice)
library(lmtest)
n25 <- 25 #minimum number of obs. for Goldfeld-Quandt test
par1 <- as.numeric(par1)
x <- t(y)
k <- length(x[1,])
n <- length(x[,1])
x1 <- cbind(x[,par1], x[,1:k!=par1])
mycolnames <- c(colnames(x)[par1], colnames(x)[1:k!=par1])
colnames(x1) <- mycolnames #colnames(x)[par1]
x <- x1
if (par3 == 'First Differences'){
x2 <- array(0, dim=c(n-1,k), dimnames=list(1:(n-1), paste('(1-B)',colnames(x),sep='')))
for (i in 1:n-1) {
for (j in 1:k) {
x2[i,j] <- x[i+1,j] - x[i,j]
}
}
x <- x2
}
if (par2 == 'Include Monthly Dummies'){
x2 <- array(0, dim=c(n,11), dimnames=list(1:n, paste('M', seq(1:11), sep ='')))
for (i in 1:11){
x2[seq(i,n,12),i] <- 1
}
x <- cbind(x, x2)
}
if (par2 == 'Include Quarterly Dummies'){
x2 <- array(0, dim=c(n,3), dimnames=list(1:n, paste('Q', seq(1:3), sep ='')))
for (i in 1:3){
x2[seq(i,n,4),i] <- 1
}
x <- cbind(x, x2)
}
k <- length(x[1,])
if (par3 == 'Linear Trend'){
x <- cbind(x, c(1:n))
colnames(x)[k+1] <- 't'
}
x
k <- length(x[1,])
df <- as.data.frame(x)
(mylm <- lm(df))
(mysum <- summary(mylm))
if (n > n25) {
kp3 <- k + 3
nmkm3 <- n - k - 3
gqarr <- array(NA, dim=c(nmkm3-kp3+1,3))
numgqtests <- 0
numsignificant1 <- 0
numsignificant5 <- 0
numsignificant10 <- 0
for (mypoint in kp3:nmkm3) {
j <- 0
numgqtests <- numgqtests + 1
for (myalt in c('greater', 'two.sided', 'less')) {
j <- j + 1
gqarr[mypoint-kp3+1,j] <- gqtest(mylm, point=mypoint, alternative=myalt)$p.value
}
if (gqarr[mypoint-kp3+1,2] < 0.01) numsignificant1 <- numsignificant1 + 1
if (gqarr[mypoint-kp3+1,2] < 0.05) numsignificant5 <- numsignificant5 + 1
if (gqarr[mypoint-kp3+1,2] < 0.10) numsignificant10 <- numsignificant10 + 1
}
gqarr
}
bitmap(file='test0.png')
plot(x[,1], type='l', main='Actuals and Interpolation', ylab='value of Actuals and Interpolation (dots)', xlab='time or index')
points(x[,1]-mysum$resid)
grid()
dev.off()
bitmap(file='test1.png')
plot(mysum$resid, type='b', pch=19, main='Residuals', ylab='value of Residuals', xlab='time or index')
grid()
dev.off()
bitmap(file='test2.png')
hist(mysum$resid, main='Residual Histogram', xlab='values of Residuals')
grid()
dev.off()
bitmap(file='test3.png')
densityplot(~mysum$resid,col='black',main='Residual Density Plot', xlab='values of Residuals')
dev.off()
bitmap(file='test4.png')
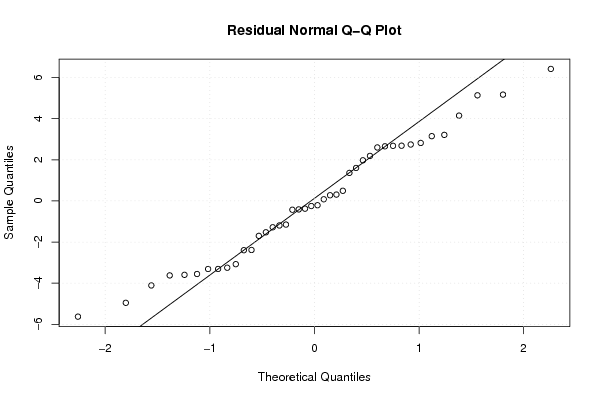
qqnorm(mysum$resid, main='Residual Normal Q-Q Plot')
qqline(mysum$resid)
grid()
dev.off()
(myerror <- as.ts(mysum$resid))
bitmap(file='test5.png')
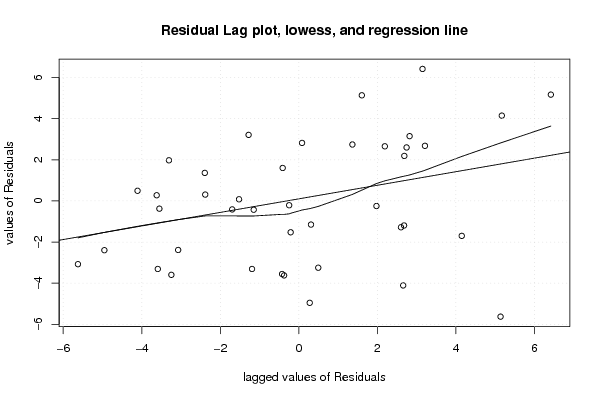
dum <- cbind(lag(myerror,k=1),myerror)
dum
dum1 <- dum[2:length(myerror),]
dum1
z <- as.data.frame(dum1)
z
plot(z,main=paste('Residual Lag plot, lowess, and regression line'), ylab='values of Residuals', xlab='lagged values of Residuals')
lines(lowess(z))
abline(lm(z))
grid()
dev.off()
bitmap(file='test6.png')
acf(mysum$resid, lag.max=length(mysum$resid)/2, main='Residual Autocorrelation Function')
grid()
dev.off()
bitmap(file='test7.png')
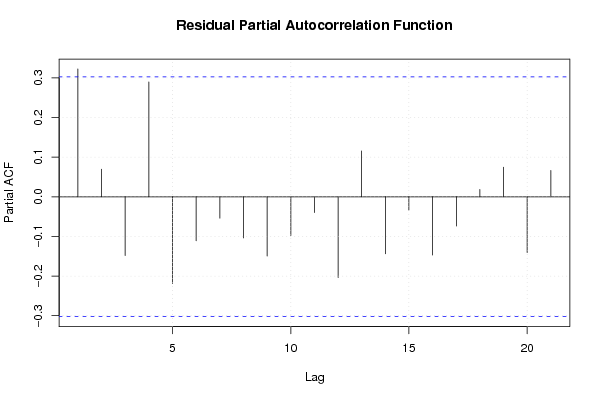
pacf(mysum$resid, lag.max=length(mysum$resid)/2, main='Residual Partial Autocorrelation Function')
grid()
dev.off()
bitmap(file='test8.png')
opar <- par(mfrow = c(2,2), oma = c(0, 0, 1.1, 0))
plot(mylm, las = 1, sub='Residual Diagnostics')
par(opar)
dev.off()
if (n > n25) {
bitmap(file='test9.png')
plot(kp3:nmkm3,gqarr[,2], main='Goldfeld-Quandt test',ylab='2-sided p-value',xlab='breakpoint')
grid()
dev.off()
}
load(file='createtable')
a<-table.start()
a<-table.row.start(a)
a<-table.element(a, 'Multiple Linear Regression - Estimated Regression Equation', 1, TRUE)
a<-table.row.end(a)
myeq <- colnames(x)[1]
myeq <- paste(myeq, '[t] = ', sep='')
for (i in 1:k){
if (mysum$coefficients[i,1] > 0) myeq <- paste(myeq, '+', '')
myeq <- paste(myeq, mysum$coefficients[i,1], sep=' ')
if (rownames(mysum$coefficients)[i] != '(Intercept)') {
myeq <- paste(myeq, rownames(mysum$coefficients)[i], sep='')
if (rownames(mysum$coefficients)[i] != 't') myeq <- paste(myeq, '[t]', sep='')
}
}
myeq <- paste(myeq, ' + e[t]')
a<-table.row.start(a)
a<-table.element(a, myeq)
a<-table.row.end(a)
a<-table.end(a)
table.save(a,file='mytable1.tab')
a<-table.start()
a<-table.row.start(a)
a<-table.element(a,hyperlink('ols1.htm','Multiple Linear Regression - Ordinary Least Squares',''), 6, TRUE)
a<-table.row.end(a)
a<-table.row.start(a)
a<-table.element(a,'Variable',header=TRUE)
a<-table.element(a,'Parameter',header=TRUE)
a<-table.element(a,'S.D.',header=TRUE)
a<-table.element(a,'T-STAT
H0: parameter = 0',header=TRUE)
a<-table.element(a,'2-tail p-value',header=TRUE)
a<-table.element(a,'1-tail p-value',header=TRUE)
a<-table.row.end(a)
for (i in 1:k){
a<-table.row.start(a)
a<-table.element(a,rownames(mysum$coefficients)[i],header=TRUE)
a<-table.element(a,mysum$coefficients[i,1])
a<-table.element(a, round(mysum$coefficients[i,2],6))
a<-table.element(a, round(mysum$coefficients[i,3],4))
a<-table.element(a, round(mysum$coefficients[i,4],6))
a<-table.element(a, round(mysum$coefficients[i,4]/2,6))
a<-table.row.end(a)
}
a<-table.end(a)
table.save(a,file='mytable2.tab')
a<-table.start()
a<-table.row.start(a)
a<-table.element(a, 'Multiple Linear Regression - Regression Statistics', 2, TRUE)
a<-table.row.end(a)
a<-table.row.start(a)
a<-table.element(a, 'Multiple R',1,TRUE)
a<-table.element(a, sqrt(mysum$r.squared))
a<-table.row.end(a)
a<-table.row.start(a)
a<-table.element(a, 'R-squared',1,TRUE)
a<-table.element(a, mysum$r.squared)
a<-table.row.end(a)
a<-table.row.start(a)
a<-table.element(a, 'Adjusted R-squared',1,TRUE)
a<-table.element(a, mysum$adj.r.squared)
a<-table.row.end(a)
a<-table.row.start(a)
a<-table.element(a, 'F-TEST (value)',1,TRUE)
a<-table.element(a, mysum$fstatistic[1])
a<-table.row.end(a)
a<-table.row.start(a)
a<-table.element(a, 'F-TEST (DF numerator)',1,TRUE)
a<-table.element(a, mysum$fstatistic[2])
a<-table.row.end(a)
a<-table.row.start(a)
a<-table.element(a, 'F-TEST (DF denominator)',1,TRUE)
a<-table.element(a, mysum$fstatistic[3])
a<-table.row.end(a)
a<-table.row.start(a)
a<-table.element(a, 'p-value',1,TRUE)
a<-table.element(a, 1-pf(mysum$fstatistic[1],mysum$fstatistic[2],mysum$fstatistic[3]))
a<-table.row.end(a)
a<-table.row.start(a)
a<-table.element(a, 'Multiple Linear Regression - Residual Statistics', 2, TRUE)
a<-table.row.end(a)
a<-table.row.start(a)
a<-table.element(a, 'Residual Standard Deviation',1,TRUE)
a<-table.element(a, mysum$sigma)
a<-table.row.end(a)
a<-table.row.start(a)
a<-table.element(a, 'Sum Squared Residuals',1,TRUE)
a<-table.element(a, sum(myerror*myerror))
a<-table.row.end(a)
a<-table.end(a)
table.save(a,file='mytable3.tab')
a<-table.start()
a<-table.row.start(a)
a<-table.element(a, 'Multiple Linear Regression - Actuals, Interpolation, and Residuals', 4, TRUE)
a<-table.row.end(a)
a<-table.row.start(a)
a<-table.element(a, 'Time or Index', 1, TRUE)
a<-table.element(a, 'Actuals', 1, TRUE)
a<-table.element(a, 'Interpolation
Forecast', 1, TRUE)
a<-table.element(a, 'Residuals
Prediction Error', 1, TRUE)
a<-table.row.end(a)
for (i in 1:n) {
a<-table.row.start(a)
a<-table.element(a,i, 1, TRUE)
a<-table.element(a,x[i])
a<-table.element(a,x[i]-mysum$resid[i])
a<-table.element(a,mysum$resid[i])
a<-table.row.end(a)
}
a<-table.end(a)
table.save(a,file='mytable4.tab')
if (n > n25) {
a<-table.start()
a<-table.row.start(a)
a<-table.element(a,'Goldfeld-Quandt test for Heteroskedasticity',4,TRUE)
a<-table.row.end(a)
a<-table.row.start(a)
a<-table.element(a,'p-values',header=TRUE)
a<-table.element(a,'Alternative Hypothesis',3,header=TRUE)
a<-table.row.end(a)
a<-table.row.start(a)
a<-table.element(a,'breakpoint index',header=TRUE)
a<-table.element(a,'greater',header=TRUE)
a<-table.element(a,'2-sided',header=TRUE)
a<-table.element(a,'less',header=TRUE)
a<-table.row.end(a)
for (mypoint in kp3:nmkm3) {
a<-table.row.start(a)
a<-table.element(a,mypoint,header=TRUE)
a<-table.element(a,gqarr[mypoint-kp3+1,1])
a<-table.element(a,gqarr[mypoint-kp3+1,2])
a<-table.element(a,gqarr[mypoint-kp3+1,3])
a<-table.row.end(a)
}
a<-table.end(a)
table.save(a,file='mytable5.tab')
a<-table.start()
a<-table.row.start(a)
a<-table.element(a,'Meta Analysis of Goldfeld-Quandt test for Heteroskedasticity',4,TRUE)
a<-table.row.end(a)
a<-table.row.start(a)
a<-table.element(a,'Description',header=TRUE)
a<-table.element(a,'# significant tests',header=TRUE)
a<-table.element(a,'% significant tests',header=TRUE)
a<-table.element(a,'OK/NOK',header=TRUE)
a<-table.row.end(a)
a<-table.row.start(a)
a<-table.element(a,'1% type I error level',header=TRUE)
a<-table.element(a,numsignificant1)
a<-table.element(a,numsignificant1/numgqtests)
if (numsignificant1/numgqtests < 0.01) dum <- 'OK' else dum <- 'NOK'
a<-table.element(a,dum)
a<-table.row.end(a)
a<-table.row.start(a)
a<-table.element(a,'5% type I error level',header=TRUE)
a<-table.element(a,numsignificant5)
a<-table.element(a,numsignificant5/numgqtests)
if (numsignificant5/numgqtests < 0.05) dum <- 'OK' else dum <- 'NOK'
a<-table.element(a,dum)
a<-table.row.end(a)
a<-table.row.start(a)
a<-table.element(a,'10% type I error level',header=TRUE)
a<-table.element(a,numsignificant10)
a<-table.element(a,numsignificant10/numgqtests)
if (numsignificant10/numgqtests < 0.1) dum <- 'OK' else dum <- 'NOK'
a<-table.element(a,dum)
a<-table.row.end(a)
a<-table.end(a)
table.save(a,file='mytable6.tab')
}