Free Statistics

of Irreproducible Research!

Author's title

Author*The author of this computation has been verified*
R Software Modulerwasp_multipleregression.wasp
Title produced by softwareMultiple Regression
Date of computationTue, 14 Dec 2010 16:36:49 +0000
Cite this page as followsStatistical Computations at FreeStatistics.org, Office for Research Development and Education, URL https://freestatistics.org/blog/index.php?v=date/2010/Dec/14/t12923445868kp6x38rye3j3e5.htm/, Retrieved Thu, 02 May 2024 22:19:14 +0000
Statistical Computations at FreeStatistics.org, Office for Research Development and Education, URL https://freestatistics.org/blog/index.php?pk=109862, Retrieved Thu, 02 May 2024 22:19:14 +0000
QR Codes:

Original text written by user:
IsPrivate?No (this computation is public)
User-defined keywords
Estimated Impact91
Family? (F = Feedback message, R = changed R code, M = changed R Module, P = changed Parameters, D = changed Data)
-     [Multiple Regression] [] [2010-12-05 18:56:24] [b98453cac15ba1066b407e146608df68]
-   PD    [Multiple Regression] [Multiple Regression] [2010-12-14 16:36:49] [a960f182d9e6e851e9aaba5921cd26a4] [Current]
-           [Multiple Regression] [Multiple regression] [2010-12-14 22:44:12] [18a20458ff88c9ba38344d123a9464bc]
Feedback Forum

Post a new message
Dataseries X:
1424	863	1045	1283	583
1445	813	1005	1243	530
1398	821	995	1171	567
1302	772	998	1103	533
1232	719	887	1119	513
1238	673	831	1037	512
1171	670	857	1050	465
1155	708	858	1010	470
1184	682	845	969	508
1363	760	921	1090	514
1339	832	943	1212	526
1339	755	1057	1170	566


Summary of computational transaction
Raw Inputview raw input (R code)
Raw Outputview raw output of R engine
Computing time5 seconds
R Server'RServer@AstonUniversity' @ vre.aston.ac.uk

\begin{tabular}{lllllllll}
\hline
Summary of computational transaction \tabularnewline
Raw Input & view raw input (R code)  \tabularnewline
Raw Output & view raw output of R engine  \tabularnewline
Computing time & 5 seconds \tabularnewline
R Server & 'RServer@AstonUniversity' @ vre.aston.ac.uk \tabularnewline
\hline
\end{tabular}
%Source: https://freestatistics.org/blog/index.php?pk=109862&T=0

[TABLE]
[ROW][C]Summary of computational transaction[/C][/ROW]
[ROW][C]Raw Input[/C][C]view raw input (R code) [/C][/ROW]
[ROW][C]Raw Output[/C][C]view raw output of R engine [/C][/ROW]
[ROW][C]Computing time[/C][C]5 seconds[/C][/ROW]
[ROW][C]R Server[/C][C]'RServer@AstonUniversity' @ vre.aston.ac.uk[/C][/ROW]
[/TABLE]
Source: https://freestatistics.org/blog/index.php?pk=109862&T=0

Globally Unique Identifier (entire table): ba.freestatistics.org/blog/index.php?pk=109862&T=0

As an alternative you can also use a QR Code:  

The GUIDs for individual cells are displayed in the table below:

Summary of computational transaction
Raw Inputview raw input (R code)
Raw Outputview raw output of R engine
Computing time5 seconds
R Server'RServer@AstonUniversity' @ vre.aston.ac.uk


Multiple Linear Regression - Estimated Regression Equation
Antwerpen[t] = + 81.87106520292 + 0.570789115514044`Vlaams-Brabant`[t] + 0.102967541561667`West-Vlaanderen`[t] + 0.311320329226794`Oost-Vlaanderen`[t] + 0.649695044606708Limburg[t] + e[t]

\begin{tabular}{lllllllll}
\hline
Multiple Linear Regression - Estimated Regression Equation \tabularnewline
Antwerpen[t] =  +  81.87106520292 +  0.570789115514044`Vlaams-Brabant`[t] +  0.102967541561667`West-Vlaanderen`[t] +  0.311320329226794`Oost-Vlaanderen`[t] +  0.649695044606708Limburg[t]  + e[t] \tabularnewline
\hline
\end{tabular}
%Source: https://freestatistics.org/blog/index.php?pk=109862&T=1

[TABLE]
[ROW][C]Multiple Linear Regression - Estimated Regression Equation[/C][/ROW]
[ROW][C]Antwerpen[t] =  +  81.87106520292 +  0.570789115514044`Vlaams-Brabant`[t] +  0.102967541561667`West-Vlaanderen`[t] +  0.311320329226794`Oost-Vlaanderen`[t] +  0.649695044606708Limburg[t]  + e[t][/C][/ROW]
[/TABLE]
Source: https://freestatistics.org/blog/index.php?pk=109862&T=1

Globally Unique Identifier (entire table): ba.freestatistics.org/blog/index.php?pk=109862&T=1

As an alternative you can also use a QR Code:  

The GUIDs for individual cells are displayed in the table below:

Multiple Linear Regression - Estimated Regression Equation
Antwerpen[t] = + 81.87106520292 + 0.570789115514044`Vlaams-Brabant`[t] + 0.102967541561667`West-Vlaanderen`[t] + 0.311320329226794`Oost-Vlaanderen`[t] + 0.649695044606708Limburg[t] + e[t]


Multiple Linear Regression - Ordinary Least Squares
VariableParameterS.D.T-STATH0: parameter = 02-tail p-value1-tail p-value
(Intercept)81.87106520292222.1330650.36860.7233440.361672
`Vlaams-Brabant`0.5707891155140440.551851.03430.3353910.167696
`West-Vlaanderen`0.1029675415616670.4219530.2440.8142090.407104
`Oost-Vlaanderen`0.3113203292267940.3844220.80980.4446860.222343
Limburg0.6496950446067080.8013350.81080.4441870.222094

\begin{tabular}{lllllllll}
\hline
Multiple Linear Regression - Ordinary Least Squares \tabularnewline
Variable & Parameter & S.D. & T-STATH0: parameter = 0 & 2-tail p-value & 1-tail p-value \tabularnewline
(Intercept) & 81.87106520292 & 222.133065 & 0.3686 & 0.723344 & 0.361672 \tabularnewline
`Vlaams-Brabant` & 0.570789115514044 & 0.55185 & 1.0343 & 0.335391 & 0.167696 \tabularnewline
`West-Vlaanderen` & 0.102967541561667 & 0.421953 & 0.244 & 0.814209 & 0.407104 \tabularnewline
`Oost-Vlaanderen` & 0.311320329226794 & 0.384422 & 0.8098 & 0.444686 & 0.222343 \tabularnewline
Limburg & 0.649695044606708 & 0.801335 & 0.8108 & 0.444187 & 0.222094 \tabularnewline
\hline
\end{tabular}
%Source: https://freestatistics.org/blog/index.php?pk=109862&T=2

[TABLE]
[ROW][C]Multiple Linear Regression - Ordinary Least Squares[/C][/ROW]
[ROW][C]Variable[/C][C]Parameter[/C][C]S.D.[/C][C]T-STATH0: parameter = 0[/C][C]2-tail p-value[/C][C]1-tail p-value[/C][/ROW]
[ROW][C](Intercept)[/C][C]81.87106520292[/C][C]222.133065[/C][C]0.3686[/C][C]0.723344[/C][C]0.361672[/C][/ROW]
[ROW][C]`Vlaams-Brabant`[/C][C]0.570789115514044[/C][C]0.55185[/C][C]1.0343[/C][C]0.335391[/C][C]0.167696[/C][/ROW]
[ROW][C]`West-Vlaanderen`[/C][C]0.102967541561667[/C][C]0.421953[/C][C]0.244[/C][C]0.814209[/C][C]0.407104[/C][/ROW]
[ROW][C]`Oost-Vlaanderen`[/C][C]0.311320329226794[/C][C]0.384422[/C][C]0.8098[/C][C]0.444686[/C][C]0.222343[/C][/ROW]
[ROW][C]Limburg[/C][C]0.649695044606708[/C][C]0.801335[/C][C]0.8108[/C][C]0.444187[/C][C]0.222094[/C][/ROW]
[/TABLE]
Source: https://freestatistics.org/blog/index.php?pk=109862&T=2

Globally Unique Identifier (entire table): ba.freestatistics.org/blog/index.php?pk=109862&T=2

As an alternative you can also use a QR Code:  

The GUIDs for individual cells are displayed in the table below:

Multiple Linear Regression - Ordinary Least Squares
VariableParameterS.D.T-STATH0: parameter = 02-tail p-value1-tail p-value
(Intercept)81.87106520292222.1330650.36860.7233440.361672
`Vlaams-Brabant`0.5707891155140440.551851.03430.3353910.167696
`West-Vlaanderen`0.1029675415616670.4219530.2440.8142090.407104
`Oost-Vlaanderen`0.3113203292267940.3844220.80980.4446860.222343
Limburg0.6496950446067080.8013350.81080.4441870.222094


Multiple Linear Regression - Regression Statistics
Multiple R0.92074199655236
R-squared0.847765824215226
Adjusted R-squared0.760774866623927
F-TEST (value)9.74544766133277
F-TEST (DF numerator)4
F-TEST (DF denominator)7
p-value0.00546102932726655
Multiple Linear Regression - Residual Statistics
Residual Standard Deviation49.4856716881503
Sum Squared Residuals17141.8219169918

\begin{tabular}{lllllllll}
\hline
Multiple Linear Regression - Regression Statistics \tabularnewline
Multiple R & 0.92074199655236 \tabularnewline
R-squared & 0.847765824215226 \tabularnewline
Adjusted R-squared & 0.760774866623927 \tabularnewline
F-TEST (value) & 9.74544766133277 \tabularnewline
F-TEST (DF numerator) & 4 \tabularnewline
F-TEST (DF denominator) & 7 \tabularnewline
p-value & 0.00546102932726655 \tabularnewline
Multiple Linear Regression - Residual Statistics \tabularnewline
Residual Standard Deviation & 49.4856716881503 \tabularnewline
Sum Squared Residuals & 17141.8219169918 \tabularnewline
\hline
\end{tabular}
%Source: https://freestatistics.org/blog/index.php?pk=109862&T=3

[TABLE]
[ROW][C]Multiple Linear Regression - Regression Statistics[/C][/ROW]
[ROW][C]Multiple R[/C][C]0.92074199655236[/C][/ROW]
[ROW][C]R-squared[/C][C]0.847765824215226[/C][/ROW]
[ROW][C]Adjusted R-squared[/C][C]0.760774866623927[/C][/ROW]
[ROW][C]F-TEST (value)[/C][C]9.74544766133277[/C][/ROW]
[ROW][C]F-TEST (DF numerator)[/C][C]4[/C][/ROW]
[ROW][C]F-TEST (DF denominator)[/C][C]7[/C][/ROW]
[ROW][C]p-value[/C][C]0.00546102932726655[/C][/ROW]
[ROW][C]Multiple Linear Regression - Residual Statistics[/C][/ROW]
[ROW][C]Residual Standard Deviation[/C][C]49.4856716881503[/C][/ROW]
[ROW][C]Sum Squared Residuals[/C][C]17141.8219169918[/C][/ROW]
[/TABLE]
Source: https://freestatistics.org/blog/index.php?pk=109862&T=3

Globally Unique Identifier (entire table): ba.freestatistics.org/blog/index.php?pk=109862&T=3

As an alternative you can also use a QR Code:  

The GUIDs for individual cells are displayed in the table below:

Multiple Linear Regression - Regression Statistics
Multiple R0.92074199655236
R-squared0.847765824215226
Adjusted R-squared0.760774866623927
F-TEST (value)9.74544766133277
F-TEST (DF numerator)4
F-TEST (DF denominator)7
p-value0.00546102932726655
Multiple Linear Regression - Residual Statistics
Residual Standard Deviation49.4856716881503
Sum Squared Residuals17141.8219169918


Multiple Linear Regression - Actuals, Interpolation, and Residuals
Time or IndexActualsInterpolationForecastResidualsPrediction Error
114241460.25934622717-36.2593462271704
214451380.7145382557764.285461744226
313981385.8748287103912.1251712896113
413021314.95565077084-12.9556507708355
512321265.26165491074-33.2616549107406
612381207.0612112284430.9387887715626
711711181.53749714593-10.5374971459317
811551194.12611313099-39.1261131309888
911841189.87129628408-5.87129628407832
1013631283.7863105569479.2136894430572
1113391372.92583348926-33.9258334892601
1213391353.62571928945-14.6257192894517

\begin{tabular}{lllllllll}
\hline
Multiple Linear Regression - Actuals, Interpolation, and Residuals \tabularnewline
Time or Index & Actuals & InterpolationForecast & ResidualsPrediction Error \tabularnewline
1 & 1424 & 1460.25934622717 & -36.2593462271704 \tabularnewline
2 & 1445 & 1380.71453825577 & 64.285461744226 \tabularnewline
3 & 1398 & 1385.87482871039 & 12.1251712896113 \tabularnewline
4 & 1302 & 1314.95565077084 & -12.9556507708355 \tabularnewline
5 & 1232 & 1265.26165491074 & -33.2616549107406 \tabularnewline
6 & 1238 & 1207.06121122844 & 30.9387887715626 \tabularnewline
7 & 1171 & 1181.53749714593 & -10.5374971459317 \tabularnewline
8 & 1155 & 1194.12611313099 & -39.1261131309888 \tabularnewline
9 & 1184 & 1189.87129628408 & -5.87129628407832 \tabularnewline
10 & 1363 & 1283.78631055694 & 79.2136894430572 \tabularnewline
11 & 1339 & 1372.92583348926 & -33.9258334892601 \tabularnewline
12 & 1339 & 1353.62571928945 & -14.6257192894517 \tabularnewline
\hline
\end{tabular}
%Source: https://freestatistics.org/blog/index.php?pk=109862&T=4

[TABLE]
[ROW][C]Multiple Linear Regression - Actuals, Interpolation, and Residuals[/C][/ROW]
[ROW][C]Time or Index[/C][C]Actuals[/C][C]InterpolationForecast[/C][C]ResidualsPrediction Error[/C][/ROW]
[ROW][C]1[/C][C]1424[/C][C]1460.25934622717[/C][C]-36.2593462271704[/C][/ROW]
[ROW][C]2[/C][C]1445[/C][C]1380.71453825577[/C][C]64.285461744226[/C][/ROW]
[ROW][C]3[/C][C]1398[/C][C]1385.87482871039[/C][C]12.1251712896113[/C][/ROW]
[ROW][C]4[/C][C]1302[/C][C]1314.95565077084[/C][C]-12.9556507708355[/C][/ROW]
[ROW][C]5[/C][C]1232[/C][C]1265.26165491074[/C][C]-33.2616549107406[/C][/ROW]
[ROW][C]6[/C][C]1238[/C][C]1207.06121122844[/C][C]30.9387887715626[/C][/ROW]
[ROW][C]7[/C][C]1171[/C][C]1181.53749714593[/C][C]-10.5374971459317[/C][/ROW]
[ROW][C]8[/C][C]1155[/C][C]1194.12611313099[/C][C]-39.1261131309888[/C][/ROW]
[ROW][C]9[/C][C]1184[/C][C]1189.87129628408[/C][C]-5.87129628407832[/C][/ROW]
[ROW][C]10[/C][C]1363[/C][C]1283.78631055694[/C][C]79.2136894430572[/C][/ROW]
[ROW][C]11[/C][C]1339[/C][C]1372.92583348926[/C][C]-33.9258334892601[/C][/ROW]
[ROW][C]12[/C][C]1339[/C][C]1353.62571928945[/C][C]-14.6257192894517[/C][/ROW]
[/TABLE]
Source: https://freestatistics.org/blog/index.php?pk=109862&T=4

Globally Unique Identifier (entire table): ba.freestatistics.org/blog/index.php?pk=109862&T=4

As an alternative you can also use a QR Code:  

The GUIDs for individual cells are displayed in the table below:

Multiple Linear Regression - Actuals, Interpolation, and Residuals
Time or IndexActualsInterpolationForecastResidualsPrediction Error
114241460.25934622717-36.2593462271704
214451380.7145382557764.285461744226
313981385.8748287103912.1251712896113
413021314.95565077084-12.9556507708355
512321265.26165491074-33.2616549107406
612381207.0612112284430.9387887715626
711711181.53749714593-10.5374971459317
811551194.12611313099-39.1261131309888
911841189.87129628408-5.87129628407832
1013631283.7863105569479.2136894430572
1113391372.92583348926-33.9258334892601
1213391353.62571928945-14.6257192894517


Parameters (Session):
par1 = 1 ; par2 = Do not include Seasonal Dummies ; par3 = No Linear Trend ;
Parameters (R input):
par1 = 1 ; par2 = Do not include Seasonal Dummies ; par3 = No Linear Trend ;
R code (references can be found in the software module):
library(lattice)
library(lmtest)
n25 <- 25 #minimum number of obs. for Goldfeld-Quandt test
par1 <- as.numeric(par1)
x <- t(y)
k <- length(x[1,])
n <- length(x[,1])
x1 <- cbind(x[,par1], x[,1:k!=par1])
mycolnames <- c(colnames(x)[par1], colnames(x)[1:k!=par1])
colnames(x1) <- mycolnames #colnames(x)[par1]
x <- x1
if (par3 == 'First Differences'){
x2 <- array(0, dim=c(n-1,k), dimnames=list(1:(n-1), paste('(1-B)',colnames(x),sep='')))
for (i in 1:n-1) {
for (j in 1:k) {
x2[i,j] <- x[i+1,j] - x[i,j]
}
}
x <- x2
}
if (par2 == 'Include Monthly Dummies'){
x2 <- array(0, dim=c(n,11), dimnames=list(1:n, paste('M', seq(1:11), sep ='')))
for (i in 1:11){
x2[seq(i,n,12),i] <- 1
}
x <- cbind(x, x2)
}
if (par2 == 'Include Quarterly Dummies'){
x2 <- array(0, dim=c(n,3), dimnames=list(1:n, paste('Q', seq(1:3), sep ='')))
for (i in 1:3){
x2[seq(i,n,4),i] <- 1
}
x <- cbind(x, x2)
}
k <- length(x[1,])
if (par3 == 'Linear Trend'){
x <- cbind(x, c(1:n))
colnames(x)[k+1] <- 't'
}
x
k <- length(x[1,])
df <- as.data.frame(x)
(mylm <- lm(df))
(mysum <- summary(mylm))
if (n > n25) {
kp3 <- k + 3
nmkm3 <- n - k - 3
gqarr <- array(NA, dim=c(nmkm3-kp3+1,3))
numgqtests <- 0
numsignificant1 <- 0
numsignificant5 <- 0
numsignificant10 <- 0
for (mypoint in kp3:nmkm3) {
j <- 0
numgqtests <- numgqtests + 1
for (myalt in c('greater', 'two.sided', 'less')) {
j <- j + 1
gqarr[mypoint-kp3+1,j] <- gqtest(mylm, point=mypoint, alternative=myalt)$p.value
}
if (gqarr[mypoint-kp3+1,2] < 0.01) numsignificant1 <- numsignificant1 + 1
if (gqarr[mypoint-kp3+1,2] < 0.05) numsignificant5 <- numsignificant5 + 1
if (gqarr[mypoint-kp3+1,2] < 0.10) numsignificant10 <- numsignificant10 + 1
}
gqarr
}
bitmap(file='test0.png')
plot(x[,1], type='l', main='Actuals and Interpolation', ylab='value of Actuals and Interpolation (dots)', xlab='time or index')
points(x[,1]-mysum$resid)
grid()
dev.off()
bitmap(file='test1.png')
plot(mysum$resid, type='b', pch=19, main='Residuals', ylab='value of Residuals', xlab='time or index')
grid()
dev.off()
bitmap(file='test2.png')
hist(mysum$resid, main='Residual Histogram', xlab='values of Residuals')
grid()
dev.off()
bitmap(file='test3.png')
densityplot(~mysum$resid,col='black',main='Residual Density Plot', xlab='values of Residuals')
dev.off()
bitmap(file='test4.png')
qqnorm(mysum$resid, main='Residual Normal Q-Q Plot')
qqline(mysum$resid)
grid()
dev.off()
(myerror <- as.ts(mysum$resid))
bitmap(file='test5.png')
dum <- cbind(lag(myerror,k=1),myerror)
dum
dum1 <- dum[2:length(myerror),]
dum1
z <- as.data.frame(dum1)
z
plot(z,main=paste('Residual Lag plot, lowess, and regression line'), ylab='values of Residuals', xlab='lagged values of Residuals')
lines(lowess(z))
abline(lm(z))
grid()
dev.off()
bitmap(file='test6.png')
acf(mysum$resid, lag.max=length(mysum$resid)/2, main='Residual Autocorrelation Function')
grid()
dev.off()
bitmap(file='test7.png')
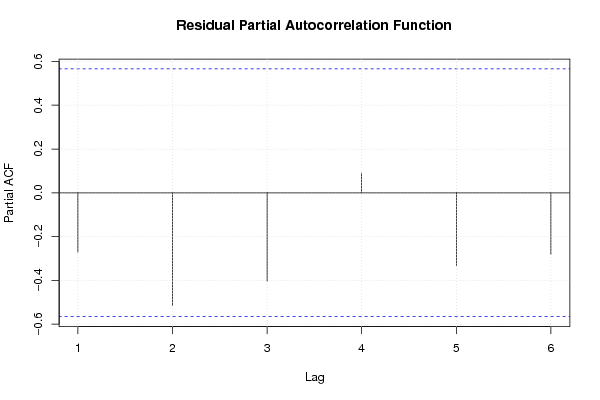
pacf(mysum$resid, lag.max=length(mysum$resid)/2, main='Residual Partial Autocorrelation Function')
grid()
dev.off()
bitmap(file='test8.png')
opar <- par(mfrow = c(2,2), oma = c(0, 0, 1.1, 0))
plot(mylm, las = 1, sub='Residual Diagnostics')
par(opar)
dev.off()
if (n > n25) {
bitmap(file='test9.png')
plot(kp3:nmkm3,gqarr[,2], main='Goldfeld-Quandt test',ylab='2-sided p-value',xlab='breakpoint')
grid()
dev.off()
}
load(file='createtable')
a<-table.start()
a<-table.row.start(a)
a<-table.element(a, 'Multiple Linear Regression - Estimated Regression Equation', 1, TRUE)
a<-table.row.end(a)
myeq <- colnames(x)[1]
myeq <- paste(myeq, '[t] = ', sep='')
for (i in 1:k){
if (mysum$coefficients[i,1] > 0) myeq <- paste(myeq, '+', '')
myeq <- paste(myeq, mysum$coefficients[i,1], sep=' ')
if (rownames(mysum$coefficients)[i] != '(Intercept)') {
myeq <- paste(myeq, rownames(mysum$coefficients)[i], sep='')
if (rownames(mysum$coefficients)[i] != 't') myeq <- paste(myeq, '[t]', sep='')
}
}
myeq <- paste(myeq, ' + e[t]')
a<-table.row.start(a)
a<-table.element(a, myeq)
a<-table.row.end(a)
a<-table.end(a)
table.save(a,file='mytable1.tab')
a<-table.start()
a<-table.row.start(a)
a<-table.element(a,hyperlink('ols1.htm','Multiple Linear Regression - Ordinary Least Squares',''), 6, TRUE)
a<-table.row.end(a)
a<-table.row.start(a)
a<-table.element(a,'Variable',header=TRUE)
a<-table.element(a,'Parameter',header=TRUE)
a<-table.element(a,'S.D.',header=TRUE)
a<-table.element(a,'T-STAT
H0: parameter = 0',header=TRUE)
a<-table.element(a,'2-tail p-value',header=TRUE)
a<-table.element(a,'1-tail p-value',header=TRUE)
a<-table.row.end(a)
for (i in 1:k){
a<-table.row.start(a)
a<-table.element(a,rownames(mysum$coefficients)[i],header=TRUE)
a<-table.element(a,mysum$coefficients[i,1])
a<-table.element(a, round(mysum$coefficients[i,2],6))
a<-table.element(a, round(mysum$coefficients[i,3],4))
a<-table.element(a, round(mysum$coefficients[i,4],6))
a<-table.element(a, round(mysum$coefficients[i,4]/2,6))
a<-table.row.end(a)
}
a<-table.end(a)
table.save(a,file='mytable2.tab')
a<-table.start()
a<-table.row.start(a)
a<-table.element(a, 'Multiple Linear Regression - Regression Statistics', 2, TRUE)
a<-table.row.end(a)
a<-table.row.start(a)
a<-table.element(a, 'Multiple R',1,TRUE)
a<-table.element(a, sqrt(mysum$r.squared))
a<-table.row.end(a)
a<-table.row.start(a)
a<-table.element(a, 'R-squared',1,TRUE)
a<-table.element(a, mysum$r.squared)
a<-table.row.end(a)
a<-table.row.start(a)
a<-table.element(a, 'Adjusted R-squared',1,TRUE)
a<-table.element(a, mysum$adj.r.squared)
a<-table.row.end(a)
a<-table.row.start(a)
a<-table.element(a, 'F-TEST (value)',1,TRUE)
a<-table.element(a, mysum$fstatistic[1])
a<-table.row.end(a)
a<-table.row.start(a)
a<-table.element(a, 'F-TEST (DF numerator)',1,TRUE)
a<-table.element(a, mysum$fstatistic[2])
a<-table.row.end(a)
a<-table.row.start(a)
a<-table.element(a, 'F-TEST (DF denominator)',1,TRUE)
a<-table.element(a, mysum$fstatistic[3])
a<-table.row.end(a)
a<-table.row.start(a)
a<-table.element(a, 'p-value',1,TRUE)
a<-table.element(a, 1-pf(mysum$fstatistic[1],mysum$fstatistic[2],mysum$fstatistic[3]))
a<-table.row.end(a)
a<-table.row.start(a)
a<-table.element(a, 'Multiple Linear Regression - Residual Statistics', 2, TRUE)
a<-table.row.end(a)
a<-table.row.start(a)
a<-table.element(a, 'Residual Standard Deviation',1,TRUE)
a<-table.element(a, mysum$sigma)
a<-table.row.end(a)
a<-table.row.start(a)
a<-table.element(a, 'Sum Squared Residuals',1,TRUE)
a<-table.element(a, sum(myerror*myerror))
a<-table.row.end(a)
a<-table.end(a)
table.save(a,file='mytable3.tab')
a<-table.start()
a<-table.row.start(a)
a<-table.element(a, 'Multiple Linear Regression - Actuals, Interpolation, and Residuals', 4, TRUE)
a<-table.row.end(a)
a<-table.row.start(a)
a<-table.element(a, 'Time or Index', 1, TRUE)
a<-table.element(a, 'Actuals', 1, TRUE)
a<-table.element(a, 'Interpolation
Forecast', 1, TRUE)
a<-table.element(a, 'Residuals
Prediction Error', 1, TRUE)
a<-table.row.end(a)
for (i in 1:n) {
a<-table.row.start(a)
a<-table.element(a,i, 1, TRUE)
a<-table.element(a,x[i])
a<-table.element(a,x[i]-mysum$resid[i])
a<-table.element(a,mysum$resid[i])
a<-table.row.end(a)
}
a<-table.end(a)
table.save(a,file='mytable4.tab')
if (n > n25) {
a<-table.start()
a<-table.row.start(a)
a<-table.element(a,'Goldfeld-Quandt test for Heteroskedasticity',4,TRUE)
a<-table.row.end(a)
a<-table.row.start(a)
a<-table.element(a,'p-values',header=TRUE)
a<-table.element(a,'Alternative Hypothesis',3,header=TRUE)
a<-table.row.end(a)
a<-table.row.start(a)
a<-table.element(a,'breakpoint index',header=TRUE)
a<-table.element(a,'greater',header=TRUE)
a<-table.element(a,'2-sided',header=TRUE)
a<-table.element(a,'less',header=TRUE)
a<-table.row.end(a)
for (mypoint in kp3:nmkm3) {
a<-table.row.start(a)
a<-table.element(a,mypoint,header=TRUE)
a<-table.element(a,gqarr[mypoint-kp3+1,1])
a<-table.element(a,gqarr[mypoint-kp3+1,2])
a<-table.element(a,gqarr[mypoint-kp3+1,3])
a<-table.row.end(a)
}
a<-table.end(a)
table.save(a,file='mytable5.tab')
a<-table.start()
a<-table.row.start(a)
a<-table.element(a,'Meta Analysis of Goldfeld-Quandt test for Heteroskedasticity',4,TRUE)
a<-table.row.end(a)
a<-table.row.start(a)
a<-table.element(a,'Description',header=TRUE)
a<-table.element(a,'# significant tests',header=TRUE)
a<-table.element(a,'% significant tests',header=TRUE)
a<-table.element(a,'OK/NOK',header=TRUE)
a<-table.row.end(a)
a<-table.row.start(a)
a<-table.element(a,'1% type I error level',header=TRUE)
a<-table.element(a,numsignificant1)
a<-table.element(a,numsignificant1/numgqtests)
if (numsignificant1/numgqtests < 0.01) dum <- 'OK' else dum <- 'NOK'
a<-table.element(a,dum)
a<-table.row.end(a)
a<-table.row.start(a)
a<-table.element(a,'5% type I error level',header=TRUE)
a<-table.element(a,numsignificant5)
a<-table.element(a,numsignificant5/numgqtests)
if (numsignificant5/numgqtests < 0.05) dum <- 'OK' else dum <- 'NOK'
a<-table.element(a,dum)
a<-table.row.end(a)
a<-table.row.start(a)
a<-table.element(a,'10% type I error level',header=TRUE)
a<-table.element(a,numsignificant10)
a<-table.element(a,numsignificant10/numgqtests)
if (numsignificant10/numgqtests < 0.1) dum <- 'OK' else dum <- 'NOK'
a<-table.element(a,dum)
a<-table.row.end(a)
a<-table.end(a)
table.save(a,file='mytable6.tab')
}