| Multiple Linear Regression - Estimated Regression Equation |
| PS[t] = + 3.1953114478424 + 0.090823714491886SWS[t] -0.00941744275009553L[t] + 0.00306860442319590BW[t] -0.000795427276824133BRW[t] -0.000926904983833428Tg[t] + 1.80501265303085P[t] + 0.374434799750786S[t] -2.89072374549107D[t] + e[t] |
| Multiple Linear Regression - Ordinary Least Squares | |||||
| Variable | Parameter | S.D. | T-STAT H0: parameter = 0 | 2-tail p-value | 1-tail p-value |
| (Intercept) | 3.1953114478424 | 1.84695 | 1.73 | 0.093899 | 0.046949 |
| SWS | 0.090823714491886 | 0.121899 | 0.7451 | 0.462026 | 0.231013 |
| L | -0.00941744275009553 | 0.036499 | -0.258 | 0.798153 | 0.399077 |
| BW | 0.00306860442319590 | 0.004331 | 0.7086 | 0.484065 | 0.242032 |
| BRW | -0.000795427276824133 | 0.002586 | -0.3075 | 0.760556 | 0.380278 |
| Tg | -0.000926904983833428 | 0.005299 | -0.1749 | 0.862313 | 0.431157 |
| P | 1.80501265303085 | 0.752305 | 2.3993 | 0.022842 | 0.011421 |
| S | 0.374434799750786 | 0.46588 | 0.8037 | 0.427884 | 0.213942 |
| D | -2.89072374549107 | 0.953311 | -3.0323 | 0.004969 | 0.002484 |
| Multiple Linear Regression - Regression Statistics | |
| Multiple R | 0.680451393267708 |
| R-squared | 0.463014098599965 |
| Adjusted R-squared | 0.319817858226622 |
| F-TEST (value) | 3.23342356889252 |
| F-TEST (DF numerator) | 8 |
| F-TEST (DF denominator) | 30 |
| p-value | 0.0090051591885767 |
| Multiple Linear Regression - Residual Statistics | |
| Residual Standard Deviation | 1.99725666621076 |
| Sum Squared Residuals | 119.6710257217 |
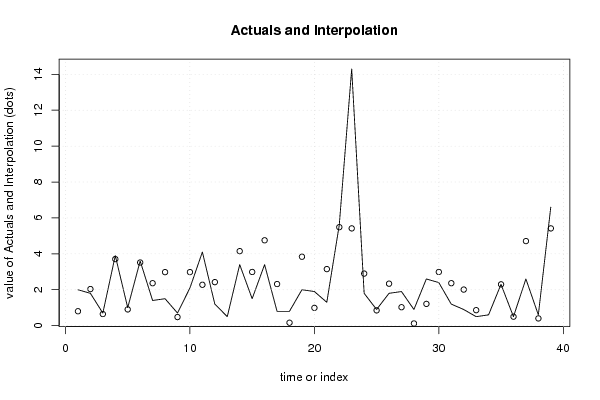
| Multiple Linear Regression - Actuals, Interpolation, and Residuals | |||
| Time or Index | Actuals | Interpolation Forecast | Residuals Prediction Error |
| 1 | 2 | 0.801312654211155 | 1.19868734578884 |
| 2 | 1.8 | 2.0365496751474 | -0.236549675147398 |
| 3 | 0.7 | 0.64518280801302 | 0.0548171919869793 |
| 4 | 3.9 | 3.70750870713747 | 0.192491292862533 |
| 5 | 1 | 0.903836876775719 | 0.0961631232242814 |
| 6 | 3.6 | 3.51612848817098 | 0.0838715118290233 |
| 7 | 1.4 | 2.36388210654043 | -0.963882106540434 |
| 8 | 1.5 | 2.98074241129233 | -1.48074241129233 |
| 9 | 0.7 | 0.477017606398694 | 0.222982393601306 |
| 10 | 2.1 | 2.98360913008506 | -0.883609130085062 |
| 11 | 4.1 | 2.27638557125173 | 1.82361442874827 |
| 12 | 1.2 | 2.42305073193597 | -1.22305073193597 |
| 13 | 0.5 | -0.393479088979977 | 0.893479088979977 |
| 14 | 3.4 | 4.1504118739016 | -0.750411873901599 |
| 15 | 1.5 | 2.98863802600793 | -1.48863802600793 |
| 16 | 3.4 | 4.7536228026311 | -1.3536228026311 |
| 17 | 0.8 | 2.31709401230088 | -1.51709401230088 |
| 18 | 0.8 | 0.162755381821027 | 0.637244618178973 |
| 19 | 2 | 3.83752377296687 | -1.83752377296687 |
| 20 | 1.9 | 0.989121376670687 | 0.910878623329313 |
| 21 | 1.3 | 3.15043322119469 | -1.85043322119469 |
| 22 | 5.6 | 5.48441043027081 | 0.115589569729190 |
| 23 | 14.3 | 5.41753445035364 | 8.88246554964636 |
| 24 | 1.8 | 2.89964711929473 | -1.09964711929473 |
| 25 | 0.9 | 0.8498491385171 | 0.0501508614829003 |
| 26 | 1.8 | 2.33684539285956 | -0.536845392859563 |
| 27 | 1.9 | 1.02569053323377 | 0.874309466766228 |
| 28 | 0.9 | 0.11990665999224 | 0.78009334000776 |
| 29 | 2.6 | 1.21096525565310 | 1.38903474434690 |
| 30 | 2.4 | 2.98854664924295 | -0.588546649242949 |
| 31 | 1.2 | 2.36347963433092 | -1.16347963433092 |
| 32 | 0.9 | 2.00849601222656 | -1.10849601222656 |
| 33 | 0.5 | 0.861368696220661 | -0.361368696220661 |
| 34 | 0.6 | -0.367637864848339 | 0.967637864848339 |
| 35 | 2.3 | 2.30008576373919 | -8.5763739192668e-05 |
| 36 | 0.5 | 0.497990807171823 | 0.00200919282817660 |
| 37 | 2.6 | 4.71067736583368 | -2.11067736583368 |
| 38 | 0.6 | 0.402815505695254 | 0.197184494304746 |
| 39 | 6.6 | 5.41800030473758 | 1.18199969526242 |
| Goldfeld-Quandt test for Heteroskedasticity | |||
| p-values | Alternative Hypothesis | ||
| breakpoint index | greater | 2-sided | less |
| 12 | 0.171626708098684 | 0.343253416197367 | 0.828373291901316 |
| 13 | 0.0750712231122462 | 0.150142446224492 | 0.924928776887754 |
| 14 | 0.0325524904675182 | 0.0651049809350363 | 0.967447509532482 |
| 15 | 0.0118644030997789 | 0.0237288061995578 | 0.988135596900221 |
| 16 | 0.00443858894792217 | 0.00887717789584434 | 0.995561411052078 |
| 17 | 0.00296665469916431 | 0.00593330939832863 | 0.997033345300836 |
| 18 | 0.000984371014804933 | 0.00196874202960987 | 0.999015628985195 |
| 19 | 0.000792581141189964 | 0.00158516228237993 | 0.99920741885881 |
| 20 | 0.000283170652607621 | 0.000566341305215242 | 0.999716829347392 |
| 21 | 0.000285519278133202 | 0.000571038556266405 | 0.999714480721867 |
| 22 | 0.000487861980646209 | 0.000975723961292417 | 0.999512138019354 |
| 23 | 0.993512987542587 | 0.0129740249148252 | 0.00648701245741258 |
| 24 | 0.982793106938453 | 0.0344137861230949 | 0.0172068930615475 |
| 25 | 0.957719644480838 | 0.0845607110383247 | 0.0422803555191624 |
| 26 | 0.916859815779786 | 0.166280368440427 | 0.0831401842202136 |
| 27 | 0.86868591397197 | 0.262628172056058 | 0.131314086028029 |
| Meta Analysis of Goldfeld-Quandt test for Heteroskedasticity | |||
| Description | # significant tests | % significant tests | OK/NOK |
| 1% type I error level | 7 | 0.4375 | NOK |
| 5% type I error level | 10 | 0.625 | NOK |
| 10% type I error level | 12 | 0.75 | NOK |