| Multiple Linear Regression - Estimated Regression Equation |
| SWS[t] = + 12.4319980342554 + 0.200038040758839PS[t] + 0.024059718682544L[t] + 0.00461153695562584BW[t] -0.00223748296960261BRW[t] -0.0157012219099834Tg[t] + 1.05475328972621P[t] + 0.0473050358890488S[t] -2.10330720124165D[t] + e[t] |
| Multiple Linear Regression - Ordinary Least Squares | |||||
| Variable | Parameter | S.D. | T-STAT H0: parameter = 0 | 2-tail p-value | 1-tail p-value |
| (Intercept) | 12.4319980342554 | 1.763786 | 7.0485 | 0 | 0 |
| PS | 0.200038040758839 | 0.268482 | 0.7451 | 0.462026 | 0.231013 |
| L | 0.024059718682544 | 0.054049 | 0.4451 | 0.65941 | 0.329705 |
| BW | 0.00461153695562584 | 0.006426 | 0.7177 | 0.478517 | 0.239259 |
| BRW | -0.00223748296960261 | 0.003823 | -0.5853 | 0.562715 | 0.281357 |
| Tg | -0.0157012219099834 | 0.007327 | -2.1429 | 0.040353 | 0.020176 |
| P | 1.05475328972621 | 1.203594 | 0.8763 | 0.38781 | 0.193905 |
| S | 0.0473050358890488 | 0.698752 | 0.0677 | 0.946474 | 0.473237 |
| D | -2.10330720124165 | 1.570874 | -1.3389 | 0.190648 | 0.095324 |
| Multiple Linear Regression - Regression Statistics | |
| Multiple R | 0.748022923857518 |
| R-squared | 0.55953829461635 |
| Adjusted R-squared | 0.442081839847376 |
| F-TEST (value) | 4.7637934902506 |
| F-TEST (DF numerator) | 8 |
| F-TEST (DF denominator) | 30 |
| p-value | 0.000756758746634056 |
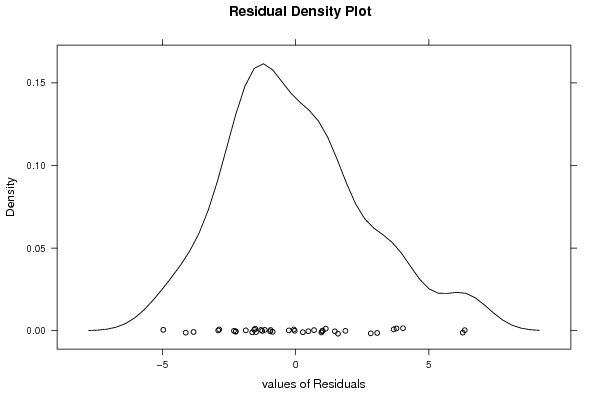
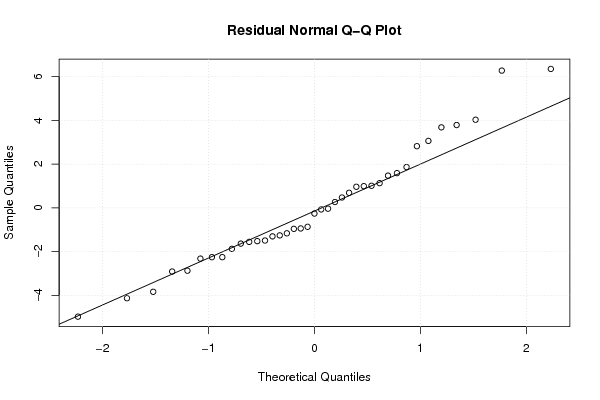
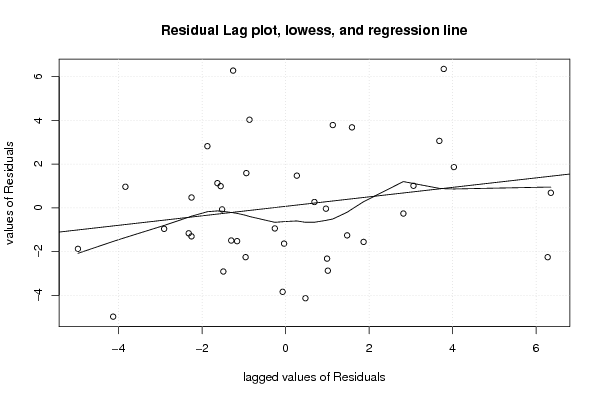
| Multiple Linear Regression - Residual Statistics | |
| Residual Standard Deviation | 2.96408426356922 |
| Sum Squared Residuals | 263.57386564616 |
| Multiple Linear Regression - Actuals, Interpolation, and Residuals | |||
| Time or Index | Actuals | Interpolation Forecast | Residuals Prediction Error |
| 1 | 6.3 | 9.17237898032424 | -2.87237898032424 |
| 2 | 2.1 | 1.08863138544277 | 1.01136861455723 |
| 3 | 9.1 | 6.03744514275093 | 3.06255485724907 |
| 4 | 15.8 | 12.1179242261665 | 3.68207577383348 |
| 5 | 5.2 | 3.61059335867092 | 1.58940664132908 |
| 6 | 10.9 | 11.8406247919639 | -0.94062479196392 |
| 7 | 8.3 | 8.55855257150273 | -0.258552571502733 |
| 8 | 11 | 8.17931101398992 | 2.82068898601008 |
| 9 | 3.2 | 5.07343787664979 | -1.87343787664979 |
| 10 | 6.3 | 11.2732476251003 | -4.97324762510034 |
| 11 | 6.6 | 10.7303521081064 | -4.13035210810641 |
| 12 | 9.5 | 9.02535526955682 | 0.474644730443181 |
| 13 | 3.3 | 5.55343077816456 | -2.25343077816456 |
| 14 | 11 | 11.9580071291871 | -0.958007129187125 |
| 15 | 4.7 | 7.6092846415422 | -2.9092846415422 |
| 16 | 10.4 | 11.8916963416481 | -1.49169634164811 |
| 17 | 7.4 | 8.70214183240361 | -1.30214183240361 |
| 18 | 2.1 | 4.35397999516453 | -2.25397999516453 |
| 19 | 17.9 | 11.6230991759818 | 6.27690082401824 |
| 20 | 6.1 | 7.35700482573303 | -1.25700482573303 |
| 21 | 11.9 | 10.4263230339675 | 1.47367696603254 |
| 22 | 13.8 | 13.5313428772137 | 0.268657122786269 |
| 23 | 14.3 | 13.6102635367182 | 0.689736463281843 |
| 24 | 15.2 | 8.84764686487128 | 6.35235313512872 |
| 25 | 10 | 6.212640189175 | 3.78735981082499 |
| 26 | 11.9 | 10.7700826748975 | 1.12991732510249 |
| 27 | 6.5 | 8.13371485492396 | -1.63371485492396 |
| 28 | 7.5 | 7.53658024833963 | -0.0365802483396253 |
| 29 | 10.6 | 9.63413527197478 | 0.965864728025219 |
| 30 | 7.4 | 11.2369228775591 | -3.83692287755915 |
| 31 | 8.4 | 8.4704314160982 | -0.0704314160981964 |
| 32 | 5.7 | 7.22111523290776 | -1.52111523290776 |
| 33 | 4.9 | 6.06216316489424 | -1.16216316489424 |
| 34 | 3.2 | 5.52046712717896 | -2.32046712717896 |
| 35 | 11 | 10.0068110878705 | 0.99318891212953 |
| 36 | 4.9 | 6.45556589748513 | -1.55556589748513 |
| 37 | 13.2 | 11.3323195162318 | 1.86768048376816 |
| 38 | 9.7 | 5.6694452952078 | 4.0305547047922 |
| 39 | 12.8 | 13.6655297624347 | -0.865529762434688 |
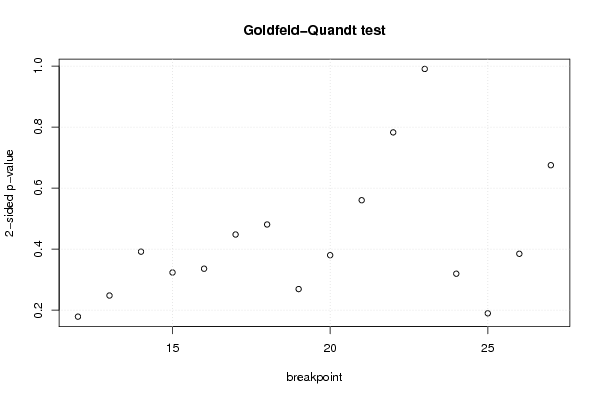
| Goldfeld-Quandt test for Heteroskedasticity | |||
| p-values | Alternative Hypothesis | ||
| breakpoint index | greater | 2-sided | less |
| 12 | 0.910585197314088 | 0.178829605371824 | 0.0894148026859119 |
| 13 | 0.87599694802226 | 0.248006103955478 | 0.124003051977739 |
| 14 | 0.804101056809505 | 0.39179788638099 | 0.195898943190495 |
| 15 | 0.838255008962977 | 0.323489982074045 | 0.161744991037023 |
| 16 | 0.83204402354619 | 0.335911952907621 | 0.167955976453811 |
| 17 | 0.776016479229085 | 0.44796704154183 | 0.223983520770915 |
| 18 | 0.759567525467047 | 0.480864949065906 | 0.240432474532953 |
| 19 | 0.865410481205666 | 0.269179037588669 | 0.134589518794334 |
| 20 | 0.809909832813822 | 0.380180334372355 | 0.190090167186178 |
| 21 | 0.71983353883865 | 0.5603329223227 | 0.28016646116135 |
| 22 | 0.608650837662065 | 0.78269832467587 | 0.391349162337935 |
| 23 | 0.504746642589472 | 0.990506714821056 | 0.495253357410528 |
| 24 | 0.84022112555253 | 0.319557748894938 | 0.159778874447469 |
| 25 | 0.90510681532131 | 0.189786369357379 | 0.0948931846786896 |
| 26 | 0.807579936542118 | 0.384840126915764 | 0.192420063457882 |
| 27 | 0.662476150410617 | 0.675047699178765 | 0.337523849589383 |
| Meta Analysis of Goldfeld-Quandt test for Heteroskedasticity | |||
| Description | # significant tests | % significant tests | OK/NOK |
| 1% type I error level | 0 | 0 | OK |
| 5% type I error level | 0 | 0 | OK |
| 10% type I error level | 0 | 0 | OK |