| Multiple Linear Regression - Estimated Regression Equation |
| Vruchtesappen[t] = + 0.779774004422962 + 0.546101358198386Mineraalwater[t] + 0.020559397509594Jonagold[t] -0.0531403430145952Sinaasappelen[t] + 0.0514045587408016Citroenen[t] + 0.00879691427214595Pompelmoezen[t] -0.0290627050312829Bananen[t] + 0.00304698650932119M1[t] + 0.00415091425424844M2[t] + 0.0177519317642119M3[t] + 0.0255370161567975M4[t] + 0.0263002308460657M5[t] + 0.0250378353896985M6[t] + 0.0201921664759066M7[t] + 0.0107364495530763M8[t] -0.00110314307674761M9[t] + 0.00187196514910997M10[t] + 0.00263498573687797M11[t] + e[t] |
| Multiple Linear Regression - Ordinary Least Squares | |||||
| Variable | Parameter | S.D. | T-STAT H0: parameter = 0 | 2-tail p-value | 1-tail p-value |
| (Intercept) | 0.779774004422962 | 0.053146 | 14.6724 | 0 | 0 |
| Mineraalwater | 0.546101358198386 | 0.09754 | 5.5988 | 1e-06 | 0 |
| Jonagold | 0.020559397509594 | 0.010587 | 1.9419 | 0.057377 | 0.028688 |
| Sinaasappelen | -0.0531403430145952 | 0.021163 | -2.511 | 0.015063 | 0.007532 |
| Citroenen | 0.0514045587408016 | 0.040179 | 1.2794 | 0.206233 | 0.103117 |
| Pompelmoezen | 0.00879691427214595 | 0.016926 | 0.5197 | 0.605384 | 0.302692 |
| Bananen | -0.0290627050312829 | 0.0256 | -1.1353 | 0.261271 | 0.130636 |
| M1 | 0.00304698650932119 | 0.007838 | 0.3887 | 0.699003 | 0.349502 |
| M2 | 0.00415091425424844 | 0.007931 | 0.5234 | 0.60285 | 0.301425 |
| M3 | 0.0177519317642119 | 0.008686 | 2.0437 | 0.045876 | 0.022938 |
| M4 | 0.0255370161567975 | 0.009652 | 2.6457 | 0.010657 | 0.005329 |
| M5 | 0.0263002308460657 | 0.010111 | 2.601 | 0.011967 | 0.005984 |
| M6 | 0.0250378353896985 | 0.010324 | 2.4253 | 0.018671 | 0.009336 |
| M7 | 0.0201921664759066 | 0.009607 | 2.1018 | 0.040254 | 0.020127 |
| M8 | 0.0107364495530763 | 0.008733 | 1.2294 | 0.224248 | 0.112124 |
| M9 | -0.00110314307674761 | 0.008563 | -0.1288 | 0.897969 | 0.448984 |
| M10 | 0.00187196514910997 | 0.007765 | 0.2411 | 0.81042 | 0.40521 |
| M11 | 0.00263498573687797 | 0.008019 | 0.3286 | 0.743726 | 0.371863 |
| Multiple Linear Regression - Regression Statistics | |
| Multiple R | 0.788425925938382 |
| R-squared | 0.621615440691795 |
| Adjusted R-squared | 0.502494375724397 |
| F-TEST (value) | 5.21835026291886 |
| F-TEST (DF numerator) | 17 |
| F-TEST (DF denominator) | 54 |
| p-value | 1.53782326195451e-06 |
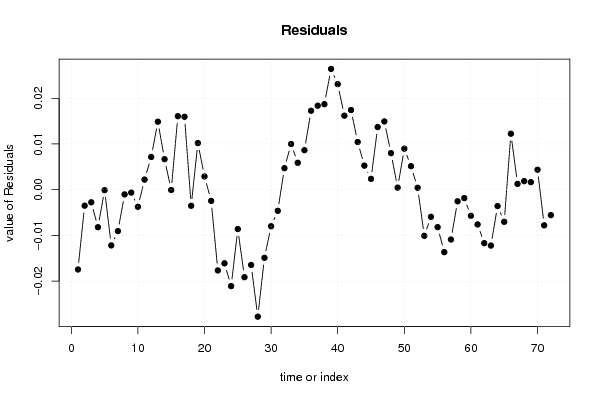
| Multiple Linear Regression - Residual Statistics | |
| Residual Standard Deviation | 0.0131791131493992 |
| Sum Squared Residuals | 0.00937920726385202 |
| Multiple Linear Regression - Actuals, Interpolation, and Residuals | |||
| Time or Index | Actuals | Interpolation Forecast | Residuals Prediction Error |
| 1 | 1.08 | 1.09746363698664 | -0.0174636369866352 |
| 2 | 1.09 | 1.09350113641945 | -0.00350113641945134 |
| 3 | 1.1 | 1.10277110096995 | -0.00277110096994645 |
| 4 | 1.1 | 1.10821325965859 | -0.008213259658591 |
| 5 | 1.11 | 1.11010930448954 | -0.000109304489537039 |
| 6 | 1.1 | 1.11219762392932 | -0.0121976239293199 |
| 7 | 1.1 | 1.10906672620585 | -0.00906672620584494 |
| 8 | 1.11 | 1.1110363966685 | -0.00103639666849946 |
| 9 | 1.11 | 1.11063650804308 | -0.000636508043082194 |
| 10 | 1.11 | 1.11374545986302 | -0.00374545986302495 |
| 11 | 1.11 | 1.10778987892554 | 0.00221012107445575 |
| 12 | 1.11 | 1.10284294703529 | 0.00715705296470941 |
| 13 | 1.12 | 1.10512868586546 | 0.0148713141345353 |
| 14 | 1.11 | 1.10332979830996 | 0.00667020169003581 |
| 15 | 1.11 | 1.11007460207703 | -7.46020770304142e-05 |
| 16 | 1.12 | 1.10392543696413 | 0.0160745630358663 |
| 17 | 1.12 | 1.10405288771458 | 0.015947112285417 |
| 18 | 1.11 | 1.1135222021483 | -0.0035222021483003 |
| 19 | 1.12 | 1.10980614788749 | 0.0101938521125119 |
| 20 | 1.11 | 1.10711030736598 | 0.00288969263401576 |
| 21 | 1.11 | 1.11245551107757 | -0.00245551107757197 |
| 22 | 1.1 | 1.11766543240017 | -0.0176654324001702 |
| 23 | 1.1 | 1.11612035386309 | -0.0161203538630898 |
| 24 | 1.1 | 1.12111071989385 | -0.0211107198938528 |
| 25 | 1.11 | 1.11861593915964 | -0.00861593915964032 |
| 26 | 1.1 | 1.11915105821195 | -0.0191510582119503 |
| 27 | 1.1 | 1.11647273613244 | -0.0164727361324386 |
| 28 | 1.09 | 1.11778464636738 | -0.0277846463673784 |
| 29 | 1.1 | 1.11491014612512 | -0.0149101461251176 |
| 30 | 1.1 | 1.10800360512865 | -0.00800360512865321 |
| 31 | 1.11 | 1.11462420031612 | -0.00462420031612207 |
| 32 | 1.13 | 1.12529997230783 | 0.00470002769216908 |
| 33 | 1.13 | 1.12000927087847 | 0.00999072912153351 |
| 34 | 1.13 | 1.12411369529289 | 0.00588630470710852 |
| 35 | 1.13 | 1.12135937076668 | 0.00864062923331539 |
| 36 | 1.14 | 1.12273337885911 | 0.0172666211408879 |
| 37 | 1.14 | 1.12162700823632 | 0.0183729917636822 |
| 38 | 1.14 | 1.12128878538403 | 0.0187112146159731 |
| 39 | 1.15 | 1.12358640449399 | 0.0264135955060138 |
| 40 | 1.15 | 1.12691162217525 | 0.0230883778247523 |
| 41 | 1.15 | 1.13380662975382 | 0.0161933702461836 |
| 42 | 1.15 | 1.13257799568550 | 0.0174220043145016 |
| 43 | 1.15 | 1.13957093305875 | 0.0104290669412504 |
| 44 | 1.15 | 1.14474158940619 | 0.00525841059381253 |
| 45 | 1.14 | 1.13763725662358 | 0.00236274337641909 |
| 46 | 1.14 | 1.12630394557236 | 0.0136960544276440 |
| 47 | 1.14 | 1.12507315406766 | 0.0149268459323446 |
| 48 | 1.13 | 1.1220117988821 | 0.00798820111789947 |
| 49 | 1.12 | 1.11955169104657 | 0.000448308953429246 |
| 50 | 1.13 | 1.12102747011446 | 0.00897252988554142 |
| 51 | 1.13 | 1.12486354226767 | 0.00513645773233391 |
| 52 | 1.13 | 1.12958289090757 | 0.000417109092426707 |
| 53 | 1.12 | 1.13009216977519 | -0.0100921697751864 |
| 54 | 1.13 | 1.13594424897467 | -0.0059442489746687 |
| 55 | 1.12 | 1.12819853156594 | -0.00819853156593815 |
| 56 | 1.12 | 1.13367206724672 | -0.0136720672467200 |
| 57 | 1.11 | 1.12090537865551 | -0.0109053786555067 |
| 58 | 1.11 | 1.1125430757038 | -0.00254307570379909 |
| 59 | 1.11 | 1.11185492155119 | -0.00185492155119041 |
| 60 | 1.11 | 1.11572882358367 | -0.00572882358367172 |
| 61 | 1.14 | 1.14761303870537 | -0.00761303870537125 |
| 62 | 1.15 | 1.16170175156015 | -0.0117017515601486 |
| 63 | 1.15 | 1.16223161405893 | -0.0122316140589322 |
| 64 | 1.16 | 1.16358214392708 | -0.00358214392707593 |
| 65 | 1.15 | 1.15702886214176 | -0.00702886214175953 |
| 66 | 1.16 | 1.14775432413356 | 0.0122456758664405 |
| 67 | 1.13 | 1.12873346096586 | 0.00126653903414282 |
| 68 | 1.13 | 1.12813966700478 | 0.00186033299522211 |
| 69 | 1.12 | 1.11835607472179 | 0.00164392527820829 |
| 70 | 1.12 | 1.11562839116776 | 0.00437160883224174 |
| 71 | 1.11 | 1.11780232082584 | -0.0078023208258355 |
| 72 | 1.11 | 1.11557233174597 | -0.00557233174597229 |
| Goldfeld-Quandt test for Heteroskedasticity | |||
| p-values | Alternative Hypothesis | ||
| breakpoint index | greater | 2-sided | less |
| 21 | 0.242500833199019 | 0.485001666398037 | 0.757499166800981 |
| 22 | 0.311820448319106 | 0.623640896638212 | 0.688179551680894 |
| 23 | 0.364286473756926 | 0.728572947513852 | 0.635713526243074 |
| 24 | 0.361057318988073 | 0.722114637976147 | 0.638942681011927 |
| 25 | 0.375686860201585 | 0.75137372040317 | 0.624313139798415 |
| 26 | 0.362683142200023 | 0.725366284400046 | 0.637316857799977 |
| 27 | 0.314008251633891 | 0.628016503267782 | 0.685991748366109 |
| 28 | 0.461520316103963 | 0.923040632207927 | 0.538479683896037 |
| 29 | 0.406569562061594 | 0.813139124123188 | 0.593430437938406 |
| 30 | 0.554869802353559 | 0.890260395292882 | 0.445130197646441 |
| 31 | 0.527238856000023 | 0.945522287999954 | 0.472761143999977 |
| 32 | 0.469724853148815 | 0.93944970629763 | 0.530275146851185 |
| 33 | 0.415525381332801 | 0.831050762665603 | 0.584474618667199 |
| 34 | 0.362150646124602 | 0.724301292249204 | 0.637849353875398 |
| 35 | 0.293509195449257 | 0.587018390898514 | 0.706490804550743 |
| 36 | 0.590117075936303 | 0.819765848127393 | 0.409882924063697 |
| 37 | 0.625811731530852 | 0.748376536938296 | 0.374188268469148 |
| 38 | 0.718358897413144 | 0.563282205173712 | 0.281641102586856 |
| 39 | 0.89218605549867 | 0.215627889002658 | 0.107813944501329 |
| 40 | 0.977703629259932 | 0.0445927414801356 | 0.0222963707400678 |
| 41 | 0.987702301060152 | 0.0245953978796962 | 0.0122976989398481 |
| 42 | 0.984632917487315 | 0.0307341650253697 | 0.0153670825126849 |
| 43 | 0.987896445693875 | 0.0242071086122505 | 0.0121035543061252 |
| 44 | 0.979118671916982 | 0.0417626561660367 | 0.0208813280830184 |
| 45 | 0.969146205140613 | 0.0617075897187749 | 0.0308537948593875 |
| 46 | 0.953873469338778 | 0.0922530613224438 | 0.0461265306612219 |
| 47 | 0.916374229609445 | 0.167251540781110 | 0.0836257703905552 |
| 48 | 0.986537358343332 | 0.0269252833133354 | 0.0134626416566677 |
| 49 | 0.97716345262788 | 0.0456730947442384 | 0.0228365473721192 |
| 50 | 0.938313116310257 | 0.123373767379487 | 0.0616868836897434 |
| 51 | 0.960408619875657 | 0.0791827602486869 | 0.0395913801243434 |
| Meta Analysis of Goldfeld-Quandt test for Heteroskedasticity | |||
| Description | # significant tests | % significant tests | OK/NOK |
| 1% type I error level | 0 | 0 | OK |
| 5% type I error level | 7 | 0.225806451612903 | NOK |
| 10% type I error level | 10 | 0.32258064516129 | NOK |