Free Statistics
of Irreproducible Research!
Description of Statistical Computation | |||||||||||||||||||||||||||||||||||||||||||||||||||||||||||||||||
|---|---|---|---|---|---|---|---|---|---|---|---|---|---|---|---|---|---|---|---|---|---|---|---|---|---|---|---|---|---|---|---|---|---|---|---|---|---|---|---|---|---|---|---|---|---|---|---|---|---|---|---|---|---|---|---|---|---|---|---|---|---|---|---|---|---|
| Author's title | |||||||||||||||||||||||||||||||||||||||||||||||||||||||||||||||||
| Author | *The author of this computation has been verified* | ||||||||||||||||||||||||||||||||||||||||||||||||||||||||||||||||
| R Software Module | rwasp_regression_trees1.wasp | ||||||||||||||||||||||||||||||||||||||||||||||||||||||||||||||||
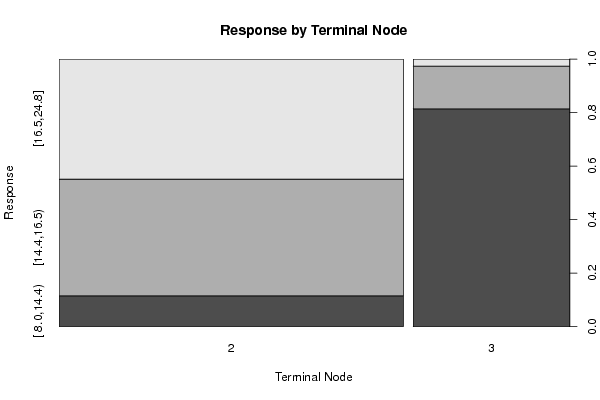
| Title produced by software | Recursive Partitioning (Regression Trees) | ||||||||||||||||||||||||||||||||||||||||||||||||||||||||||||||||
| Date of computation | Tue, 14 Dec 2010 15:13:52 +0000 | ||||||||||||||||||||||||||||||||||||||||||||||||||||||||||||||||
| Cite this page as follows | Statistical Computations at FreeStatistics.org, Office for Research Development and Education, URL https://freestatistics.org/blog/index.php?v=date/2010/Dec/14/t1292339546lrd4ugle568ugtr.htm/, Retrieved Thu, 02 May 2024 21:46:32 +0000 | ||||||||||||||||||||||||||||||||||||||||||||||||||||||||||||||||
| Statistical Computations at FreeStatistics.org, Office for Research Development and Education, URL https://freestatistics.org/blog/index.php?pk=109722, Retrieved Thu, 02 May 2024 21:46:32 +0000 | |||||||||||||||||||||||||||||||||||||||||||||||||||||||||||||||||
| QR Codes: | |||||||||||||||||||||||||||||||||||||||||||||||||||||||||||||||||
|
| |||||||||||||||||||||||||||||||||||||||||||||||||||||||||||||||||
| Original text written by user: | |||||||||||||||||||||||||||||||||||||||||||||||||||||||||||||||||
| IsPrivate? | No (this computation is public) | ||||||||||||||||||||||||||||||||||||||||||||||||||||||||||||||||
| User-defined keywords | |||||||||||||||||||||||||||||||||||||||||||||||||||||||||||||||||
| Estimated Impact | 112 | ||||||||||||||||||||||||||||||||||||||||||||||||||||||||||||||||
Tree of Dependent Computations | |||||||||||||||||||||||||||||||||||||||||||||||||||||||||||||||||
| Family? (F = Feedback message, R = changed R code, M = changed R Module, P = changed Parameters, D = changed Data) | |||||||||||||||||||||||||||||||||||||||||||||||||||||||||||||||||
| - [Recursive Partitioning (Regression Trees)] [] [2010-12-05 18:59:57] [b98453cac15ba1066b407e146608df68] F PD [Recursive Partitioning (Regression Trees)] [] [2010-12-14 14:48:39] [de55ccbf69577500a5f46ed42a101114] - P [Recursive Partitioning (Regression Trees)] [] [2010-12-14 15:13:52] [6b31f806e9ccc1f74a26091056f791cb] [Current] F P [Recursive Partitioning (Regression Trees)] [] [2010-12-14 17:44:43] [de55ccbf69577500a5f46ed42a101114] | |||||||||||||||||||||||||||||||||||||||||||||||||||||||||||||||||
| Feedback Forum | |||||||||||||||||||||||||||||||||||||||||||||||||||||||||||||||||
Post a new message | |||||||||||||||||||||||||||||||||||||||||||||||||||||||||||||||||
Dataset | |||||||||||||||||||||||||||||||||||||||||||||||||||||||||||||||||
| Dataseries X: | |||||||||||||||||||||||||||||||||||||||||||||||||||||||||||||||||
8 350 165 3693 11.5 8 318 150 3436 11 8 302 140 3449 10.5 8 429 198 4341 10 8 440 215 4312 8.5 8 455 225 4425 10 8 383 170 3563 10 8 340 160 3609 8 8 455 225 3086 10 4 113 95 2372 15 6 199 97 2774 15.5 4 97 46 1835 20.5 4 110 87 2672 17.5 4 104 95 2375 17.5 4 121 113 2234 12.5 8 360 215 4615 14 8 307 200 4376 15 8 304 193 4732 18.5 4 97 88 2130 14.5 4 113 95 2228 14 6 250 100 3329 15.5 6 232 100 3288 15.5 8 350 165 4209 12 8 318 150 4096 13 8 400 170 4746 12 8 400 175 5140 12 4 140 72 2408 19 6 250 100 3282 15 4 122 86 2220 14 4 116 90 2123 14 4 88 76 2065 14.5 4 71 65 1773 19 4 97 60 1834 19 4 91 70 1955 20.5 4 97.5 80 2126 17 4 122 86 2226 16.5 8 350 165 4274 12 8 318 150 4135 13.5 8 351 153 4129 13 8 429 208 4633 11 8 350 155 4502 13.5 8 400 190 4422 12.5 3 70 97 2330 13.5 8 307 130 4098 14 8 302 140 4294 16 4 121 112 2933 14.5 4 121 76 2511 18 4 122 86 2395 16 4 120 97 2506 14.5 4 98 80 2164 15 8 350 175 4100 13 8 304 150 3672 11.5 8 302 137 4042 14.5 8 318 150 3777 12.5 8 400 150 4464 12 8 351 158 4363 13 8 440 215 4735 11 8 455 225 4951 11 6 225 105 3121 16.5 6 250 100 3278 18 6 250 88 3021 16.5 6 198 95 2904 16 8 400 150 4997 14 8 350 180 4499 12.5 6 232 100 2789 15 4 140 72 2401 19.5 4 108 94 2379 16.5 4 122 85 2310 18.5 6 155 107 2472 14 8 350 145 4082 13 8 400 230 4278 9.5 4 116 75 2158 15.5 4 114 91 2582 14 8 318 150 3399 11 4 121 110 2660 14 8 350 180 3664 11 6 198 95 3102 16.5 6 232 100 2901 16 4 122 80 2451 16.5 4 71 65 1836 21 6 250 100 3781 17 6 258 110 3632 18 8 302 140 4141 14 8 350 150 4699 14.5 8 302 140 4638 16 8 304 150 4257 15.5 4 79 67 1963 15.5 4 97 78 2300 14.5 4 83 61 2003 19 4 90 75 2125 14.5 4 116 75 2246 14 4 120 97 2489 15 4 79 67 2000 16 6 225 95 3264 16 6 250 72 3158 19.5 8 400 170 4668 11.5 8 350 145 4440 14 8 351 148 4657 13.5 6 231 110 3907 21 6 258 110 3730 19 6 225 95 3785 19 8 262 110 3221 13.5 8 302 129 3169 12 4 140 83 2639 17 6 232 100 2914 16 4 134 96 2702 13.5 4 90 71 2223 16.5 6 171 97 2984 14.5 4 115 95 2694 15 4 120 88 2957 17 4 121 115 2671 13.5 4 91 53 1795 17.5 4 116 81 2220 16.9 4 140 92 2572 14.9 4 101 83 2202 15.3 8 305 140 4215 13 8 304 120 3962 13.9 8 351 152 4215 12.8 6 250 105 3353 14.5 6 200 81 3012 17.6 4 85 52 2035 22.2 4 98 60 2164 22.1 6 225 100 3651 17.7 6 250 110 3645 16.2 6 258 95 3193 17.8 4 85 70 1990 17 4 97 75 2155 16.4 4 130 102 3150 15.7 8 318 150 3940 13.2 6 168 120 3820 16.7 8 350 180 4380 12.1 8 302 130 3870 15 8 318 150 3755 14 4 111 80 2155 14.8 4 79 58 1825 18.6 4 85 70 1945 16.8 8 305 145 3880 12.5 8 318 145 4140 13.7 6 231 105 3425 16.9 6 225 100 3630 17.7 8 400 180 4220 11.1 8 350 170 4165 11.4 8 351 149 4335 14.5 4 97 78 1940 14.5 4 97 75 2265 18.2 4 140 89 2755 15.8 4 98 83 2075 15.9 4 97 67 1985 16.4 6 146 97 2815 14.5 4 121 110 2600 12.8 4 90 48 1985 21.5 4 98 66 1800 14.4 4 85 70 2070 18.6 8 318 140 3735 13.2 8 302 139 3570 12.8 6 200 95 3155 18.2 6 200 85 2965 15.8 6 225 100 3430 17.2 6 232 90 3210 17.2 6 200 85 3070 16.7 6 225 110 3620 18.7 8 305 145 3425 13.2 6 231 165 3445 13.4 8 318 140 4080 13.7 4 98 68 2155 16.5 4 119 97 2300 14.7 4 105 75 2230 14.5 4 151 85 2855 17.6 5 131 103 2830 15.9 6 163 125 3140 13.6 6 163 133 3410 15.8 4 89 71 1990 14.9 4 98 68 2135 16.6 6 200 85 2990 18.2 4 140 88 2890 17.3 6 225 110 3360 16.6 8 305 130 3840 15.4 8 351 138 3955 13.2 8 318 135 3830 15.2 8 351 142 4054 14.3 8 267 125 3605 15 4 89 71 1925 14 4 86 65 1975 15.2 4 121 80 2670 15 4 141 71 3190 24.8 8 260 90 3420 22.2 4 105 70 2150 14.9 4 85 65 2020 19.2 4 151 90 2670 16 6 173 115 2595 11.3 4 151 90 2556 13.2 4 98 76 2144 14.7 4 98 70 2120 15.5 4 86 65 2019 16.4 4 140 88 2870 18.1 4 151 90 3003 20.1 4 97 78 2188 15.8 4 134 90 2711 15.5 4 119 92 2434 15 4 108 75 2265 15.2 4 156 105 2800 14.4 4 85 65 2110 19.2 5 121 67 2950 19.9 4 91 67 1850 13.8 4 89 62 1845 15.3 4 122 88 2500 15.1 4 135 84 2490 15.7 4 151 84 2635 16.4 6 173 110 2725 12.6 4 135 84 2385 12.9 4 86 64 1875 16.4 4 81 60 1760 16.1 4 85 65 1975 19.4 4 89 62 2050 17.3 4 105 63 2215 14.9 4 98 65 2045 16.2 4 105 74 2190 14.2 4 119 100 2615 14.8 4 141 80 3230 20.4 6 146 120 2930 13.8 6 231 110 3415 15.8 6 200 88 3060 17.1 6 225 85 3465 16.6 4 112 88 2640 18.6 4 112 88 2395 18 4 135 84 2525 16 4 151 90 2735 18 4 105 74 1980 15.3 4 91 68 1970 17.6 4 105 63 2125 14.7 4 120 88 2160 14.5 4 107 75 2205 14.5 4 91 67 1965 15.7 6 181 110 2945 16.4 6 262 85 3015 17 4 144 96 2665 13.9 4 151 90 2950 17.3 4 140 86 2790 15.6 4 135 84 2295 11.6 4 120 79 2625 18.6 | |||||||||||||||||||||||||||||||||||||||||||||||||||||||||||||||||
Tables (Output of Computation) | |||||||||||||||||||||||||||||||||||||||||||||||||||||||||||||||||
| |||||||||||||||||||||||||||||||||||||||||||||||||||||||||||||||||
Figures (Output of Computation) | |||||||||||||||||||||||||||||||||||||||||||||||||||||||||||||||||
Input Parameters & R Code | |||||||||||||||||||||||||||||||||||||||||||||||||||||||||||||||||
| Parameters (Session): | |||||||||||||||||||||||||||||||||||||||||||||||||||||||||||||||||
| par1 = 5 ; par2 = quantiles ; par3 = 3 ; par4 = no ; | |||||||||||||||||||||||||||||||||||||||||||||||||||||||||||||||||
| Parameters (R input): | |||||||||||||||||||||||||||||||||||||||||||||||||||||||||||||||||
| par1 = 5 ; par2 = quantiles ; par3 = 3 ; par4 = no ; | |||||||||||||||||||||||||||||||||||||||||||||||||||||||||||||||||
| R code (references can be found in the software module): | |||||||||||||||||||||||||||||||||||||||||||||||||||||||||||||||||
library(party) | |||||||||||||||||||||||||||||||||||||||||||||||||||||||||||||||||