Free Statistics

of Irreproducible Research!

Author's title

Author*The author of this computation has been verified*
R Software Modulerwasp_autocorrelation.wasp
Title produced by software(Partial) Autocorrelation Function
Date of computationTue, 14 Dec 2010 14:35:40 +0000
Cite this page as followsStatistical Computations at FreeStatistics.org, Office for Research Development and Education, URL https://freestatistics.org/blog/index.php?v=date/2010/Dec/14/t1292337332fr7q99kpv3y973q.htm/, Retrieved Thu, 02 May 2024 20:23:53 +0000
Statistical Computations at FreeStatistics.org, Office for Research Development and Education, URL https://freestatistics.org/blog/index.php?pk=109696, Retrieved Thu, 02 May 2024 20:23:53 +0000
QR Codes:

Original text written by user:
IsPrivate?No (this computation is public)
User-defined keywords
Estimated Impact108
Family? (F = Feedback message, R = changed R code, M = changed R Module, P = changed Parameters, D = changed Data)
-     [(Partial) Autocorrelation Function] [] [2010-12-14 14:15:36] [acfa3f91ce5598ec4ba98aad4cfba2f0]
-   P     [(Partial) Autocorrelation Function] [] [2010-12-14 14:35:40] [c474a97a96075919a678ad3d2290b00b] [Current]
Feedback Forum

Post a new message
Dataseries X:
1145.11
1176.86
1206.41
1192.72
1214.82
1199.07
1157.47
1100.1
1095.63
1105.63
1137.79
1124.72
1152.6
1211.85
1239.62
1244.13
1198.42
1227.99
1304.92
1340.26
1307.32
1356.51
1383.29
1437.87
1494.56
1521.42
1498.76
1488.75
1524.62
1439.27
1423.11
1466.85
1425.83
1363.45
1389.18
1395.89
1368.43
1349.03
1299.88
1365.41
1451.04
1433.75
1464.65
1475.57
1471.16
1429.12
1452.46
1538.09
1631.59
1665.5
1690.6
1711.74
1734.1
1748.09
1703.45
1745.74
1751.01
1795.65
1852.13
1877.1
1989.31
2097.76
2154.87
2152.18
2250.27
2346.9
2525.56
2409.36
2394.36
2401.33
2354.32
2450.41
2504.67
2661.39
2880.4
3064.42
3141.12
3327.7
3564.95
3403.13
3149.9
3006.84
3230.66
3361.13
3484.74
3411.13
3288.18
3280.37
3173.95
3165.26
3092.71
3053.05
3181.96
2999.93
3249.57
3210.52
3030.29
2803.47
2767.63
2882.6
2863.36
2897.06
3012.61
3142.95
3032.93
3045.78
3110.52
3013.24
2987.1
2995.55
2833.18
2848.96
2794.83
2845.26
2915.02
2892.63
2604.42
2641.65
2659.81
2638.53
2720.25
2745.88
2735.7
2811.7
2799.43
2555.28
2304.98
2214.95
2065.81
1940.49
2042
1995.37
1946.81
1765.9
1635.25
1833.42
1910.43
1959.67
1969.6
2061.41
2093.48
2120.88
2174.56
2196.72
2350.44
2440.25
2408.64
2472.81
2407.6
2454.62
2448.05
2497.84
2645.64
2756.76
2849.27
2921.44
2981.85
3080.58
3106.22
3119.31
3061.26
3097.31
3161.69
3257.16
3277.01
3295.32
3363.99
3494.17
3667.03
3813.06
3917.96
3895.51
3801.06
3570.12
3701.61
3862.27
3970.1
4138.52
4199.75
4290.89
4443.91
4502.64
4356.98
4591.27
4696.96
4621.4
4562.84
4202.52
4296.49
4435.23
4105.18
4116.68
3844.49
3720.98
3674.4
3857.62
3801.06
3504.37
3032.6
3047.03
2962.34
2197.82
2014.45
1862.83
1905.41
1810.99
1670.07
1864.44
2052.02
2029.6
2070.83
2293.41
2443.27
2513.17
2466.92
2502.66


Summary of computational transaction
Raw Inputview raw input (R code)
Raw Outputview raw output of R engine
Computing time2 seconds
R Server'Sir Ronald Aylmer Fisher' @ 193.190.124.24

\begin{tabular}{lllllllll}
\hline
Summary of computational transaction \tabularnewline
Raw Input & view raw input (R code)  \tabularnewline
Raw Output & view raw output of R engine  \tabularnewline
Computing time & 2 seconds \tabularnewline
R Server & 'Sir Ronald Aylmer Fisher' @ 193.190.124.24 \tabularnewline
\hline
\end{tabular}
%Source: https://freestatistics.org/blog/index.php?pk=109696&T=0

[TABLE]
[ROW][C]Summary of computational transaction[/C][/ROW]
[ROW][C]Raw Input[/C][C]view raw input (R code) [/C][/ROW]
[ROW][C]Raw Output[/C][C]view raw output of R engine [/C][/ROW]
[ROW][C]Computing time[/C][C]2 seconds[/C][/ROW]
[ROW][C]R Server[/C][C]'Sir Ronald Aylmer Fisher' @ 193.190.124.24[/C][/ROW]
[/TABLE]
Source: https://freestatistics.org/blog/index.php?pk=109696&T=0

Globally Unique Identifier (entire table): ba.freestatistics.org/blog/index.php?pk=109696&T=0

As an alternative you can also use a QR Code:  

The GUIDs for individual cells are displayed in the table below:

Summary of computational transaction
Raw Inputview raw input (R code)
Raw Outputview raw output of R engine
Computing time2 seconds
R Server'Sir Ronald Aylmer Fisher' @ 193.190.124.24


Autocorrelation Function
Time lag kACF(k)T-STATP-value
10.2862184.19682e-05
20.0618630.90710.182687
30.1348291.9770.024661
40.1451952.1290.017197
50.177332.60020.004982
6-0.016258-0.23840.405905
70.0099270.14560.442204
80.1307011.91650.028317
90.0962541.41140.079791
10-0.056391-0.82690.204617
110.0913231.33910.090984
120.0591860.86780.193224
13-0.038473-0.56410.286631
140.0079840.11710.453458
15-0.049209-0.72160.235677
160.0797631.16960.121738
170.0213970.31370.37701
18-0.062043-0.90970.181992
19-0.006771-0.09930.460502
20-0.091443-1.34080.090696
21-0.078341-1.14870.125978
22-0.120492-1.76680.039344
23-0.103529-1.5180.065238

\begin{tabular}{lllllllll}
\hline
Autocorrelation Function \tabularnewline
Time lag k & ACF(k) & T-STAT & P-value \tabularnewline
1 & 0.286218 & 4.1968 & 2e-05 \tabularnewline
2 & 0.061863 & 0.9071 & 0.182687 \tabularnewline
3 & 0.134829 & 1.977 & 0.024661 \tabularnewline
4 & 0.145195 & 2.129 & 0.017197 \tabularnewline
5 & 0.17733 & 2.6002 & 0.004982 \tabularnewline
6 & -0.016258 & -0.2384 & 0.405905 \tabularnewline
7 & 0.009927 & 0.1456 & 0.442204 \tabularnewline
8 & 0.130701 & 1.9165 & 0.028317 \tabularnewline
9 & 0.096254 & 1.4114 & 0.079791 \tabularnewline
10 & -0.056391 & -0.8269 & 0.204617 \tabularnewline
11 & 0.091323 & 1.3391 & 0.090984 \tabularnewline
12 & 0.059186 & 0.8678 & 0.193224 \tabularnewline
13 & -0.038473 & -0.5641 & 0.286631 \tabularnewline
14 & 0.007984 & 0.1171 & 0.453458 \tabularnewline
15 & -0.049209 & -0.7216 & 0.235677 \tabularnewline
16 & 0.079763 & 1.1696 & 0.121738 \tabularnewline
17 & 0.021397 & 0.3137 & 0.37701 \tabularnewline
18 & -0.062043 & -0.9097 & 0.181992 \tabularnewline
19 & -0.006771 & -0.0993 & 0.460502 \tabularnewline
20 & -0.091443 & -1.3408 & 0.090696 \tabularnewline
21 & -0.078341 & -1.1487 & 0.125978 \tabularnewline
22 & -0.120492 & -1.7668 & 0.039344 \tabularnewline
23 & -0.103529 & -1.518 & 0.065238 \tabularnewline
\hline
\end{tabular}
%Source: https://freestatistics.org/blog/index.php?pk=109696&T=1

[TABLE]
[ROW][C]Autocorrelation Function[/C][/ROW]
[ROW][C]Time lag k[/C][C]ACF(k)[/C][C]T-STAT[/C][C]P-value[/C][/ROW]
[ROW][C]1[/C][C]0.286218[/C][C]4.1968[/C][C]2e-05[/C][/ROW]
[ROW][C]2[/C][C]0.061863[/C][C]0.9071[/C][C]0.182687[/C][/ROW]
[ROW][C]3[/C][C]0.134829[/C][C]1.977[/C][C]0.024661[/C][/ROW]
[ROW][C]4[/C][C]0.145195[/C][C]2.129[/C][C]0.017197[/C][/ROW]
[ROW][C]5[/C][C]0.17733[/C][C]2.6002[/C][C]0.004982[/C][/ROW]
[ROW][C]6[/C][C]-0.016258[/C][C]-0.2384[/C][C]0.405905[/C][/ROW]
[ROW][C]7[/C][C]0.009927[/C][C]0.1456[/C][C]0.442204[/C][/ROW]
[ROW][C]8[/C][C]0.130701[/C][C]1.9165[/C][C]0.028317[/C][/ROW]
[ROW][C]9[/C][C]0.096254[/C][C]1.4114[/C][C]0.079791[/C][/ROW]
[ROW][C]10[/C][C]-0.056391[/C][C]-0.8269[/C][C]0.204617[/C][/ROW]
[ROW][C]11[/C][C]0.091323[/C][C]1.3391[/C][C]0.090984[/C][/ROW]
[ROW][C]12[/C][C]0.059186[/C][C]0.8678[/C][C]0.193224[/C][/ROW]
[ROW][C]13[/C][C]-0.038473[/C][C]-0.5641[/C][C]0.286631[/C][/ROW]
[ROW][C]14[/C][C]0.007984[/C][C]0.1171[/C][C]0.453458[/C][/ROW]
[ROW][C]15[/C][C]-0.049209[/C][C]-0.7216[/C][C]0.235677[/C][/ROW]
[ROW][C]16[/C][C]0.079763[/C][C]1.1696[/C][C]0.121738[/C][/ROW]
[ROW][C]17[/C][C]0.021397[/C][C]0.3137[/C][C]0.37701[/C][/ROW]
[ROW][C]18[/C][C]-0.062043[/C][C]-0.9097[/C][C]0.181992[/C][/ROW]
[ROW][C]19[/C][C]-0.006771[/C][C]-0.0993[/C][C]0.460502[/C][/ROW]
[ROW][C]20[/C][C]-0.091443[/C][C]-1.3408[/C][C]0.090696[/C][/ROW]
[ROW][C]21[/C][C]-0.078341[/C][C]-1.1487[/C][C]0.125978[/C][/ROW]
[ROW][C]22[/C][C]-0.120492[/C][C]-1.7668[/C][C]0.039344[/C][/ROW]
[ROW][C]23[/C][C]-0.103529[/C][C]-1.518[/C][C]0.065238[/C][/ROW]
[/TABLE]
Source: https://freestatistics.org/blog/index.php?pk=109696&T=1

Globally Unique Identifier (entire table): ba.freestatistics.org/blog/index.php?pk=109696&T=1

As an alternative you can also use a QR Code:  

The GUIDs for individual cells are displayed in the table below:

Autocorrelation Function
Time lag kACF(k)T-STATP-value
10.2862184.19682e-05
20.0618630.90710.182687
30.1348291.9770.024661
40.1451952.1290.017197
50.177332.60020.004982
6-0.016258-0.23840.405905
70.0099270.14560.442204
80.1307011.91650.028317
90.0962541.41140.079791
10-0.056391-0.82690.204617
110.0913231.33910.090984
120.0591860.86780.193224
13-0.038473-0.56410.286631
140.0079840.11710.453458
15-0.049209-0.72160.235677
160.0797631.16960.121738
170.0213970.31370.37701
18-0.062043-0.90970.181992
19-0.006771-0.09930.460502
20-0.091443-1.34080.090696
21-0.078341-1.14870.125978
22-0.120492-1.76680.039344
23-0.103529-1.5180.065238


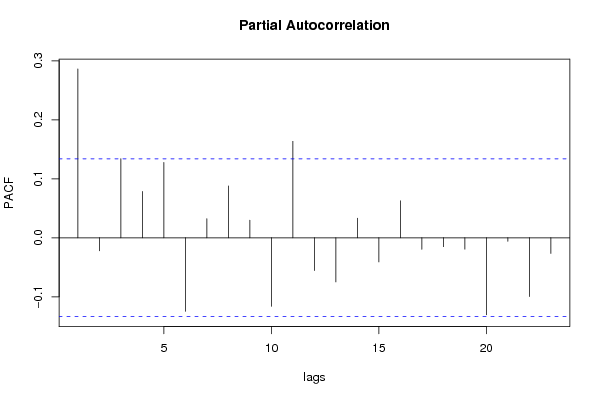
Partial Autocorrelation Function
Time lag kPACF(k)T-STATP-value
10.2862184.19682e-05
2-0.021847-0.32030.37451
30.1340271.96520.025338
40.0785461.15170.125359
50.1275291.86990.031425
6-0.124627-1.82740.034514
70.0323820.47480.3177
80.0876981.28590.099929
90.0296420.43460.332134
10-0.116055-1.70170.045129
110.1634462.39660.008702
12-0.055441-0.81290.208581
13-0.074759-1.09620.137113
140.0331490.48610.313708
15-0.040848-0.5990.274918
160.0625990.91790.179853
17-0.019624-0.28770.38691
18-0.015052-0.22070.412766
19-0.019266-0.28250.388917
20-0.130485-1.91330.02852
21-0.006037-0.08850.464774
22-0.09957-1.460.072877
23-0.026421-0.38740.349416

\begin{tabular}{lllllllll}
\hline
Partial Autocorrelation Function \tabularnewline
Time lag k & PACF(k) & T-STAT & P-value \tabularnewline
1 & 0.286218 & 4.1968 & 2e-05 \tabularnewline
2 & -0.021847 & -0.3203 & 0.37451 \tabularnewline
3 & 0.134027 & 1.9652 & 0.025338 \tabularnewline
4 & 0.078546 & 1.1517 & 0.125359 \tabularnewline
5 & 0.127529 & 1.8699 & 0.031425 \tabularnewline
6 & -0.124627 & -1.8274 & 0.034514 \tabularnewline
7 & 0.032382 & 0.4748 & 0.3177 \tabularnewline
8 & 0.087698 & 1.2859 & 0.099929 \tabularnewline
9 & 0.029642 & 0.4346 & 0.332134 \tabularnewline
10 & -0.116055 & -1.7017 & 0.045129 \tabularnewline
11 & 0.163446 & 2.3966 & 0.008702 \tabularnewline
12 & -0.055441 & -0.8129 & 0.208581 \tabularnewline
13 & -0.074759 & -1.0962 & 0.137113 \tabularnewline
14 & 0.033149 & 0.4861 & 0.313708 \tabularnewline
15 & -0.040848 & -0.599 & 0.274918 \tabularnewline
16 & 0.062599 & 0.9179 & 0.179853 \tabularnewline
17 & -0.019624 & -0.2877 & 0.38691 \tabularnewline
18 & -0.015052 & -0.2207 & 0.412766 \tabularnewline
19 & -0.019266 & -0.2825 & 0.388917 \tabularnewline
20 & -0.130485 & -1.9133 & 0.02852 \tabularnewline
21 & -0.006037 & -0.0885 & 0.464774 \tabularnewline
22 & -0.09957 & -1.46 & 0.072877 \tabularnewline
23 & -0.026421 & -0.3874 & 0.349416 \tabularnewline
\hline
\end{tabular}
%Source: https://freestatistics.org/blog/index.php?pk=109696&T=2

[TABLE]
[ROW][C]Partial Autocorrelation Function[/C][/ROW]
[ROW][C]Time lag k[/C][C]PACF(k)[/C][C]T-STAT[/C][C]P-value[/C][/ROW]
[ROW][C]1[/C][C]0.286218[/C][C]4.1968[/C][C]2e-05[/C][/ROW]
[ROW][C]2[/C][C]-0.021847[/C][C]-0.3203[/C][C]0.37451[/C][/ROW]
[ROW][C]3[/C][C]0.134027[/C][C]1.9652[/C][C]0.025338[/C][/ROW]
[ROW][C]4[/C][C]0.078546[/C][C]1.1517[/C][C]0.125359[/C][/ROW]
[ROW][C]5[/C][C]0.127529[/C][C]1.8699[/C][C]0.031425[/C][/ROW]
[ROW][C]6[/C][C]-0.124627[/C][C]-1.8274[/C][C]0.034514[/C][/ROW]
[ROW][C]7[/C][C]0.032382[/C][C]0.4748[/C][C]0.3177[/C][/ROW]
[ROW][C]8[/C][C]0.087698[/C][C]1.2859[/C][C]0.099929[/C][/ROW]
[ROW][C]9[/C][C]0.029642[/C][C]0.4346[/C][C]0.332134[/C][/ROW]
[ROW][C]10[/C][C]-0.116055[/C][C]-1.7017[/C][C]0.045129[/C][/ROW]
[ROW][C]11[/C][C]0.163446[/C][C]2.3966[/C][C]0.008702[/C][/ROW]
[ROW][C]12[/C][C]-0.055441[/C][C]-0.8129[/C][C]0.208581[/C][/ROW]
[ROW][C]13[/C][C]-0.074759[/C][C]-1.0962[/C][C]0.137113[/C][/ROW]
[ROW][C]14[/C][C]0.033149[/C][C]0.4861[/C][C]0.313708[/C][/ROW]
[ROW][C]15[/C][C]-0.040848[/C][C]-0.599[/C][C]0.274918[/C][/ROW]
[ROW][C]16[/C][C]0.062599[/C][C]0.9179[/C][C]0.179853[/C][/ROW]
[ROW][C]17[/C][C]-0.019624[/C][C]-0.2877[/C][C]0.38691[/C][/ROW]
[ROW][C]18[/C][C]-0.015052[/C][C]-0.2207[/C][C]0.412766[/C][/ROW]
[ROW][C]19[/C][C]-0.019266[/C][C]-0.2825[/C][C]0.388917[/C][/ROW]
[ROW][C]20[/C][C]-0.130485[/C][C]-1.9133[/C][C]0.02852[/C][/ROW]
[ROW][C]21[/C][C]-0.006037[/C][C]-0.0885[/C][C]0.464774[/C][/ROW]
[ROW][C]22[/C][C]-0.09957[/C][C]-1.46[/C][C]0.072877[/C][/ROW]
[ROW][C]23[/C][C]-0.026421[/C][C]-0.3874[/C][C]0.349416[/C][/ROW]
[/TABLE]
Source: https://freestatistics.org/blog/index.php?pk=109696&T=2

Globally Unique Identifier (entire table): ba.freestatistics.org/blog/index.php?pk=109696&T=2

As an alternative you can also use a QR Code:  

The GUIDs for individual cells are displayed in the table below:

Partial Autocorrelation Function
Time lag kPACF(k)T-STATP-value
10.2862184.19682e-05
2-0.021847-0.32030.37451
30.1340271.96520.025338
40.0785461.15170.125359
50.1275291.86990.031425
6-0.124627-1.82740.034514
70.0323820.47480.3177
80.0876981.28590.099929
90.0296420.43460.332134
10-0.116055-1.70170.045129
110.1634462.39660.008702
12-0.055441-0.81290.208581
13-0.074759-1.09620.137113
140.0331490.48610.313708
15-0.040848-0.5990.274918
160.0625990.91790.179853
17-0.019624-0.28770.38691
18-0.015052-0.22070.412766
19-0.019266-0.28250.388917
20-0.130485-1.91330.02852
21-0.006037-0.08850.464774
22-0.09957-1.460.072877
23-0.026421-0.38740.349416


Parameters (Session):
par1 = Default ; par2 = 1 ; par3 = 1 ; par4 = 0 ; par5 = 12 ; par6 = White Noise ; par7 = 0.95 ;
Parameters (R input):
par1 = Default ; par2 = 1 ; par3 = 1 ; par4 = 0 ; par5 = 12 ; par6 = White Noise ; par7 = 0.95 ;
R code (references can be found in the software module):
if (par1 == 'Default') {
par1 = 10*log10(length(x))
} else {
par1 <- as.numeric(par1)
}
par2 <- as.numeric(par2)
par3 <- as.numeric(par3)
par4 <- as.numeric(par4)
par5 <- as.numeric(par5)
if (par6 == 'White Noise') par6 <- 'white' else par6 <- 'ma'
par7 <- as.numeric(par7)
if (par2 == 0) {
x <- log(x)
} else {
x <- (x ^ par2 - 1) / par2
}
if (par3 > 0) x <- diff(x,lag=1,difference=par3)
if (par4 > 0) x <- diff(x,lag=par5,difference=par4)
bitmap(file='pic1.png')
racf <- acf(x, par1, main='Autocorrelation', xlab='time lag', ylab='ACF', ci.type=par6, ci=par7, sub=paste('(lambda=',par2,', d=',par3,', D=',par4,', CI=', par7, ', CI type=',par6,')',sep=''))
dev.off()
bitmap(file='pic2.png')
rpacf <- pacf(x,par1,main='Partial Autocorrelation',xlab='lags',ylab='PACF')
dev.off()
(myacf <- c(racf$acf))
(mypacf <- c(rpacf$acf))
lengthx <- length(x)
sqrtn <- sqrt(lengthx)
load(file='createtable')
a<-table.start()
a<-table.row.start(a)
a<-table.element(a,'Autocorrelation Function',4,TRUE)
a<-table.row.end(a)
a<-table.row.start(a)
a<-table.element(a,'Time lag k',header=TRUE)
a<-table.element(a,hyperlink('basics.htm','ACF(k)','click here for more information about the Autocorrelation Function'),header=TRUE)
a<-table.element(a,'T-STAT',header=TRUE)
a<-table.element(a,'P-value',header=TRUE)
a<-table.row.end(a)
for (i in 2:(par1+1)) {
a<-table.row.start(a)
a<-table.element(a,i-1,header=TRUE)
a<-table.element(a,round(myacf[i],6))
mytstat <- myacf[i]*sqrtn
a<-table.element(a,round(mytstat,4))
a<-table.element(a,round(1-pt(abs(mytstat),lengthx),6))
a<-table.row.end(a)
}
a<-table.end(a)
table.save(a,file='mytable.tab')
a<-table.start()
a<-table.row.start(a)
a<-table.element(a,'Partial Autocorrelation Function',4,TRUE)
a<-table.row.end(a)
a<-table.row.start(a)
a<-table.element(a,'Time lag k',header=TRUE)
a<-table.element(a,hyperlink('basics.htm','PACF(k)','click here for more information about the Partial Autocorrelation Function'),header=TRUE)
a<-table.element(a,'T-STAT',header=TRUE)
a<-table.element(a,'P-value',header=TRUE)
a<-table.row.end(a)
for (i in 1:par1) {
a<-table.row.start(a)
a<-table.element(a,i,header=TRUE)
a<-table.element(a,round(mypacf[i],6))
mytstat <- mypacf[i]*sqrtn
a<-table.element(a,round(mytstat,4))
a<-table.element(a,round(1-pt(abs(mytstat),lengthx),6))
a<-table.row.end(a)
}
a<-table.end(a)
table.save(a,file='mytable1.tab')