Free Statistics

of Irreproducible Research!

Author's title

Author*The author of this computation has been verified*
R Software Modulerwasp_autocorrelation.wasp
Title produced by software(Partial) Autocorrelation Function
Date of computationTue, 14 Dec 2010 12:37:34 +0000
Cite this page as followsStatistical Computations at FreeStatistics.org, Office for Research Development and Education, URL https://freestatistics.org/blog/index.php?v=date/2010/Dec/14/t1292330132ihp3e2eh7dxm4bk.htm/, Retrieved Thu, 02 May 2024 19:36:34 +0000
Statistical Computations at FreeStatistics.org, Office for Research Development and Education, URL https://freestatistics.org/blog/index.php?pk=109502, Retrieved Thu, 02 May 2024 19:36:34 +0000
QR Codes:

Original text written by user:
IsPrivate?No (this computation is public)
User-defined keywords
Estimated Impact127
Family? (F = Feedback message, R = changed R code, M = changed R Module, P = changed Parameters, D = changed Data)
-     [Univariate Data Series] [] [2008-12-08 19:22:39] [d2d412c7f4d35ffbf5ee5ee89db327d4]
- RMPD    [(Partial) Autocorrelation Function] [] [2010-12-14 12:37:34] [ef8aba939446289dd59b403ac33ef077] [Current]
Feedback Forum

Post a new message
Dataseries X:
19876
45335
48674
156392
100837
101605
532850
294189
80763
105995
25045
90474
48481
50730
68694
207716
99132
104012
422632
364974
82687
66834
28408
97073
40284
24421
116346
72120
108751
91738
402216
390070
106045
110070
70668
167841
28607
95371
30605
131063
81214
85451
455196
454570
63114
74287
42350
113375


Summary of computational transaction
Raw Inputview raw input (R code)
Raw Outputview raw output of R engine
Computing time2 seconds
R Server'Sir Ronald Aylmer Fisher' @ 193.190.124.24

\begin{tabular}{lllllllll}
\hline
Summary of computational transaction \tabularnewline
Raw Input & view raw input (R code)  \tabularnewline
Raw Output & view raw output of R engine  \tabularnewline
Computing time & 2 seconds \tabularnewline
R Server & 'Sir Ronald Aylmer Fisher' @ 193.190.124.24 \tabularnewline
\hline
\end{tabular}
%Source: https://freestatistics.org/blog/index.php?pk=109502&T=0

[TABLE]
[ROW][C]Summary of computational transaction[/C][/ROW]
[ROW][C]Raw Input[/C][C]view raw input (R code) [/C][/ROW]
[ROW][C]Raw Output[/C][C]view raw output of R engine [/C][/ROW]
[ROW][C]Computing time[/C][C]2 seconds[/C][/ROW]
[ROW][C]R Server[/C][C]'Sir Ronald Aylmer Fisher' @ 193.190.124.24[/C][/ROW]
[/TABLE]
Source: https://freestatistics.org/blog/index.php?pk=109502&T=0

Globally Unique Identifier (entire table): ba.freestatistics.org/blog/index.php?pk=109502&T=0

As an alternative you can also use a QR Code:  

The GUIDs for individual cells are displayed in the table below:

Summary of computational transaction
Raw Inputview raw input (R code)
Raw Outputview raw output of R engine
Computing time2 seconds
R Server'Sir Ronald Aylmer Fisher' @ 193.190.124.24


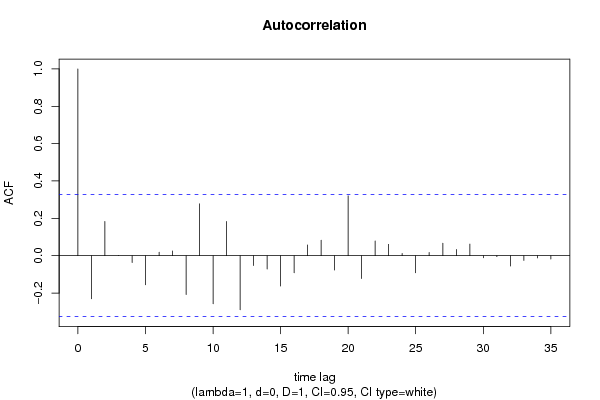
Autocorrelation Function
Time lag kACF(k)T-STATP-value
1-0.231351-1.38810.086818
20.1829431.09770.139821
30.0005940.00360.498588
4-0.037048-0.22230.412674
5-0.155807-0.93480.178048
60.0183860.11030.456385
70.0256160.15370.439354
8-0.208645-1.25190.109345
90.2775051.6650.052294
10-0.258095-1.54860.065116
110.1826211.09570.140237
12-0.289607-1.73760.045412
13-0.053347-0.32010.375378
14-0.071834-0.4310.334519
15-0.162476-0.97490.168068
16-0.09194-0.55160.292302
170.0567520.34050.367726
180.083050.49830.310651
19-0.076557-0.45930.324374
200.3204281.92260.031237
21-0.12228-0.73370.233948
220.0782380.46940.320797
230.0604590.36280.359455
240.0119180.07150.471694
25-0.091549-0.54930.293098
260.0172280.10340.459123
270.0669370.40160.345168
280.0333170.19990.421341
290.0620880.37250.355843
30-0.011675-0.070.472272
31-0.005432-0.03260.487091
32-0.055112-0.33070.371404
33-0.02543-0.15260.439791
34-0.012069-0.07240.471336
35-0.017827-0.1070.457707
36NANANA
37NANANA
38NANANA
39NANANA
40NANANA
41NANANA
42NANANA
43NANANA
44NANANA
45NANANA
46NANANA
47NANANA
48NANANA

\begin{tabular}{lllllllll}
\hline
Autocorrelation Function \tabularnewline
Time lag k & ACF(k) & T-STAT & P-value \tabularnewline
1 & -0.231351 & -1.3881 & 0.086818 \tabularnewline
2 & 0.182943 & 1.0977 & 0.139821 \tabularnewline
3 & 0.000594 & 0.0036 & 0.498588 \tabularnewline
4 & -0.037048 & -0.2223 & 0.412674 \tabularnewline
5 & -0.155807 & -0.9348 & 0.178048 \tabularnewline
6 & 0.018386 & 0.1103 & 0.456385 \tabularnewline
7 & 0.025616 & 0.1537 & 0.439354 \tabularnewline
8 & -0.208645 & -1.2519 & 0.109345 \tabularnewline
9 & 0.277505 & 1.665 & 0.052294 \tabularnewline
10 & -0.258095 & -1.5486 & 0.065116 \tabularnewline
11 & 0.182621 & 1.0957 & 0.140237 \tabularnewline
12 & -0.289607 & -1.7376 & 0.045412 \tabularnewline
13 & -0.053347 & -0.3201 & 0.375378 \tabularnewline
14 & -0.071834 & -0.431 & 0.334519 \tabularnewline
15 & -0.162476 & -0.9749 & 0.168068 \tabularnewline
16 & -0.09194 & -0.5516 & 0.292302 \tabularnewline
17 & 0.056752 & 0.3405 & 0.367726 \tabularnewline
18 & 0.08305 & 0.4983 & 0.310651 \tabularnewline
19 & -0.076557 & -0.4593 & 0.324374 \tabularnewline
20 & 0.320428 & 1.9226 & 0.031237 \tabularnewline
21 & -0.12228 & -0.7337 & 0.233948 \tabularnewline
22 & 0.078238 & 0.4694 & 0.320797 \tabularnewline
23 & 0.060459 & 0.3628 & 0.359455 \tabularnewline
24 & 0.011918 & 0.0715 & 0.471694 \tabularnewline
25 & -0.091549 & -0.5493 & 0.293098 \tabularnewline
26 & 0.017228 & 0.1034 & 0.459123 \tabularnewline
27 & 0.066937 & 0.4016 & 0.345168 \tabularnewline
28 & 0.033317 & 0.1999 & 0.421341 \tabularnewline
29 & 0.062088 & 0.3725 & 0.355843 \tabularnewline
30 & -0.011675 & -0.07 & 0.472272 \tabularnewline
31 & -0.005432 & -0.0326 & 0.487091 \tabularnewline
32 & -0.055112 & -0.3307 & 0.371404 \tabularnewline
33 & -0.02543 & -0.1526 & 0.439791 \tabularnewline
34 & -0.012069 & -0.0724 & 0.471336 \tabularnewline
35 & -0.017827 & -0.107 & 0.457707 \tabularnewline
36 & NA & NA & NA \tabularnewline
37 & NA & NA & NA \tabularnewline
38 & NA & NA & NA \tabularnewline
39 & NA & NA & NA \tabularnewline
40 & NA & NA & NA \tabularnewline
41 & NA & NA & NA \tabularnewline
42 & NA & NA & NA \tabularnewline
43 & NA & NA & NA \tabularnewline
44 & NA & NA & NA \tabularnewline
45 & NA & NA & NA \tabularnewline
46 & NA & NA & NA \tabularnewline
47 & NA & NA & NA \tabularnewline
48 & NA & NA & NA \tabularnewline
\hline
\end{tabular}
%Source: https://freestatistics.org/blog/index.php?pk=109502&T=1

[TABLE]
[ROW][C]Autocorrelation Function[/C][/ROW]
[ROW][C]Time lag k[/C][C]ACF(k)[/C][C]T-STAT[/C][C]P-value[/C][/ROW]
[ROW][C]1[/C][C]-0.231351[/C][C]-1.3881[/C][C]0.086818[/C][/ROW]
[ROW][C]2[/C][C]0.182943[/C][C]1.0977[/C][C]0.139821[/C][/ROW]
[ROW][C]3[/C][C]0.000594[/C][C]0.0036[/C][C]0.498588[/C][/ROW]
[ROW][C]4[/C][C]-0.037048[/C][C]-0.2223[/C][C]0.412674[/C][/ROW]
[ROW][C]5[/C][C]-0.155807[/C][C]-0.9348[/C][C]0.178048[/C][/ROW]
[ROW][C]6[/C][C]0.018386[/C][C]0.1103[/C][C]0.456385[/C][/ROW]
[ROW][C]7[/C][C]0.025616[/C][C]0.1537[/C][C]0.439354[/C][/ROW]
[ROW][C]8[/C][C]-0.208645[/C][C]-1.2519[/C][C]0.109345[/C][/ROW]
[ROW][C]9[/C][C]0.277505[/C][C]1.665[/C][C]0.052294[/C][/ROW]
[ROW][C]10[/C][C]-0.258095[/C][C]-1.5486[/C][C]0.065116[/C][/ROW]
[ROW][C]11[/C][C]0.182621[/C][C]1.0957[/C][C]0.140237[/C][/ROW]
[ROW][C]12[/C][C]-0.289607[/C][C]-1.7376[/C][C]0.045412[/C][/ROW]
[ROW][C]13[/C][C]-0.053347[/C][C]-0.3201[/C][C]0.375378[/C][/ROW]
[ROW][C]14[/C][C]-0.071834[/C][C]-0.431[/C][C]0.334519[/C][/ROW]
[ROW][C]15[/C][C]-0.162476[/C][C]-0.9749[/C][C]0.168068[/C][/ROW]
[ROW][C]16[/C][C]-0.09194[/C][C]-0.5516[/C][C]0.292302[/C][/ROW]
[ROW][C]17[/C][C]0.056752[/C][C]0.3405[/C][C]0.367726[/C][/ROW]
[ROW][C]18[/C][C]0.08305[/C][C]0.4983[/C][C]0.310651[/C][/ROW]
[ROW][C]19[/C][C]-0.076557[/C][C]-0.4593[/C][C]0.324374[/C][/ROW]
[ROW][C]20[/C][C]0.320428[/C][C]1.9226[/C][C]0.031237[/C][/ROW]
[ROW][C]21[/C][C]-0.12228[/C][C]-0.7337[/C][C]0.233948[/C][/ROW]
[ROW][C]22[/C][C]0.078238[/C][C]0.4694[/C][C]0.320797[/C][/ROW]
[ROW][C]23[/C][C]0.060459[/C][C]0.3628[/C][C]0.359455[/C][/ROW]
[ROW][C]24[/C][C]0.011918[/C][C]0.0715[/C][C]0.471694[/C][/ROW]
[ROW][C]25[/C][C]-0.091549[/C][C]-0.5493[/C][C]0.293098[/C][/ROW]
[ROW][C]26[/C][C]0.017228[/C][C]0.1034[/C][C]0.459123[/C][/ROW]
[ROW][C]27[/C][C]0.066937[/C][C]0.4016[/C][C]0.345168[/C][/ROW]
[ROW][C]28[/C][C]0.033317[/C][C]0.1999[/C][C]0.421341[/C][/ROW]
[ROW][C]29[/C][C]0.062088[/C][C]0.3725[/C][C]0.355843[/C][/ROW]
[ROW][C]30[/C][C]-0.011675[/C][C]-0.07[/C][C]0.472272[/C][/ROW]
[ROW][C]31[/C][C]-0.005432[/C][C]-0.0326[/C][C]0.487091[/C][/ROW]
[ROW][C]32[/C][C]-0.055112[/C][C]-0.3307[/C][C]0.371404[/C][/ROW]
[ROW][C]33[/C][C]-0.02543[/C][C]-0.1526[/C][C]0.439791[/C][/ROW]
[ROW][C]34[/C][C]-0.012069[/C][C]-0.0724[/C][C]0.471336[/C][/ROW]
[ROW][C]35[/C][C]-0.017827[/C][C]-0.107[/C][C]0.457707[/C][/ROW]
[ROW][C]36[/C][C]NA[/C][C]NA[/C][C]NA[/C][/ROW]
[ROW][C]37[/C][C]NA[/C][C]NA[/C][C]NA[/C][/ROW]
[ROW][C]38[/C][C]NA[/C][C]NA[/C][C]NA[/C][/ROW]
[ROW][C]39[/C][C]NA[/C][C]NA[/C][C]NA[/C][/ROW]
[ROW][C]40[/C][C]NA[/C][C]NA[/C][C]NA[/C][/ROW]
[ROW][C]41[/C][C]NA[/C][C]NA[/C][C]NA[/C][/ROW]
[ROW][C]42[/C][C]NA[/C][C]NA[/C][C]NA[/C][/ROW]
[ROW][C]43[/C][C]NA[/C][C]NA[/C][C]NA[/C][/ROW]
[ROW][C]44[/C][C]NA[/C][C]NA[/C][C]NA[/C][/ROW]
[ROW][C]45[/C][C]NA[/C][C]NA[/C][C]NA[/C][/ROW]
[ROW][C]46[/C][C]NA[/C][C]NA[/C][C]NA[/C][/ROW]
[ROW][C]47[/C][C]NA[/C][C]NA[/C][C]NA[/C][/ROW]
[ROW][C]48[/C][C]NA[/C][C]NA[/C][C]NA[/C][/ROW]
[/TABLE]
Source: https://freestatistics.org/blog/index.php?pk=109502&T=1

Globally Unique Identifier (entire table): ba.freestatistics.org/blog/index.php?pk=109502&T=1

As an alternative you can also use a QR Code:  

The GUIDs for individual cells are displayed in the table below:

Autocorrelation Function
Time lag kACF(k)T-STATP-value
1-0.231351-1.38810.086818
20.1829431.09770.139821
30.0005940.00360.498588
4-0.037048-0.22230.412674
5-0.155807-0.93480.178048
60.0183860.11030.456385
70.0256160.15370.439354
8-0.208645-1.25190.109345
90.2775051.6650.052294
10-0.258095-1.54860.065116
110.1826211.09570.140237
12-0.289607-1.73760.045412
13-0.053347-0.32010.375378
14-0.071834-0.4310.334519
15-0.162476-0.97490.168068
16-0.09194-0.55160.292302
170.0567520.34050.367726
180.083050.49830.310651
19-0.076557-0.45930.324374
200.3204281.92260.031237
21-0.12228-0.73370.233948
220.0782380.46940.320797
230.0604590.36280.359455
240.0119180.07150.471694
25-0.091549-0.54930.293098
260.0172280.10340.459123
270.0669370.40160.345168
280.0333170.19990.421341
290.0620880.37250.355843
30-0.011675-0.070.472272
31-0.005432-0.03260.487091
32-0.055112-0.33070.371404
33-0.02543-0.15260.439791
34-0.012069-0.07240.471336
35-0.017827-0.1070.457707
36NANANA
37NANANA
38NANANA
39NANANA
40NANANA
41NANANA
42NANANA
43NANANA
44NANANA
45NANANA
46NANANA
47NANANA
48NANANA


Partial Autocorrelation Function
Time lag kPACF(k)T-STATP-value
1-0.231351-1.38810.086818
20.1367380.82040.208685
30.0740380.44420.329768
4-0.05144-0.30860.379687
5-0.202993-1.2180.115582
6-0.044064-0.26440.396495
70.1002510.60150.275635
8-0.190059-1.14040.130834
90.1775131.06510.146966
10-0.165834-0.9950.163187
110.0749180.44950.32788
12-0.273649-1.64190.054661
13-0.235891-1.41530.08278
140.0054910.03290.48695
15-0.236505-1.4190.082246
16-0.233919-1.40350.084515
17-0.010958-0.06580.47397
18-0.057461-0.34480.366139
19-0.015634-0.09380.462892
200.0224930.1350.446698
21-0.020744-0.12450.450821
22-0.026065-0.15640.4383
230.0043340.0260.489698
240.0045550.02730.489174
25-0.15975-0.95850.172101
26-0.184104-1.10460.138326
27-0.047726-0.28640.388123
280.00980.05880.476719
29-0.138982-0.83390.204921
30-0.059132-0.35480.362408
31-0.17563-1.05380.149503
32-0.006886-0.04130.483637
33-0.021864-0.13120.448181
34-0.046343-0.27810.391278
350.0978490.58710.280402
36NANANA
37NANANA
38NANANA
39NANANA
40NANANA
41NANANA
42NANANA
43NANANA
44NANANA
45NANANA
46NANANA
47NANANA
48NANANA

\begin{tabular}{lllllllll}
\hline
Partial Autocorrelation Function \tabularnewline
Time lag k & PACF(k) & T-STAT & P-value \tabularnewline
1 & -0.231351 & -1.3881 & 0.086818 \tabularnewline
2 & 0.136738 & 0.8204 & 0.208685 \tabularnewline
3 & 0.074038 & 0.4442 & 0.329768 \tabularnewline
4 & -0.05144 & -0.3086 & 0.379687 \tabularnewline
5 & -0.202993 & -1.218 & 0.115582 \tabularnewline
6 & -0.044064 & -0.2644 & 0.396495 \tabularnewline
7 & 0.100251 & 0.6015 & 0.275635 \tabularnewline
8 & -0.190059 & -1.1404 & 0.130834 \tabularnewline
9 & 0.177513 & 1.0651 & 0.146966 \tabularnewline
10 & -0.165834 & -0.995 & 0.163187 \tabularnewline
11 & 0.074918 & 0.4495 & 0.32788 \tabularnewline
12 & -0.273649 & -1.6419 & 0.054661 \tabularnewline
13 & -0.235891 & -1.4153 & 0.08278 \tabularnewline
14 & 0.005491 & 0.0329 & 0.48695 \tabularnewline
15 & -0.236505 & -1.419 & 0.082246 \tabularnewline
16 & -0.233919 & -1.4035 & 0.084515 \tabularnewline
17 & -0.010958 & -0.0658 & 0.47397 \tabularnewline
18 & -0.057461 & -0.3448 & 0.366139 \tabularnewline
19 & -0.015634 & -0.0938 & 0.462892 \tabularnewline
20 & 0.022493 & 0.135 & 0.446698 \tabularnewline
21 & -0.020744 & -0.1245 & 0.450821 \tabularnewline
22 & -0.026065 & -0.1564 & 0.4383 \tabularnewline
23 & 0.004334 & 0.026 & 0.489698 \tabularnewline
24 & 0.004555 & 0.0273 & 0.489174 \tabularnewline
25 & -0.15975 & -0.9585 & 0.172101 \tabularnewline
26 & -0.184104 & -1.1046 & 0.138326 \tabularnewline
27 & -0.047726 & -0.2864 & 0.388123 \tabularnewline
28 & 0.0098 & 0.0588 & 0.476719 \tabularnewline
29 & -0.138982 & -0.8339 & 0.204921 \tabularnewline
30 & -0.059132 & -0.3548 & 0.362408 \tabularnewline
31 & -0.17563 & -1.0538 & 0.149503 \tabularnewline
32 & -0.006886 & -0.0413 & 0.483637 \tabularnewline
33 & -0.021864 & -0.1312 & 0.448181 \tabularnewline
34 & -0.046343 & -0.2781 & 0.391278 \tabularnewline
35 & 0.097849 & 0.5871 & 0.280402 \tabularnewline
36 & NA & NA & NA \tabularnewline
37 & NA & NA & NA \tabularnewline
38 & NA & NA & NA \tabularnewline
39 & NA & NA & NA \tabularnewline
40 & NA & NA & NA \tabularnewline
41 & NA & NA & NA \tabularnewline
42 & NA & NA & NA \tabularnewline
43 & NA & NA & NA \tabularnewline
44 & NA & NA & NA \tabularnewline
45 & NA & NA & NA \tabularnewline
46 & NA & NA & NA \tabularnewline
47 & NA & NA & NA \tabularnewline
48 & NA & NA & NA \tabularnewline
\hline
\end{tabular}
%Source: https://freestatistics.org/blog/index.php?pk=109502&T=2

[TABLE]
[ROW][C]Partial Autocorrelation Function[/C][/ROW]
[ROW][C]Time lag k[/C][C]PACF(k)[/C][C]T-STAT[/C][C]P-value[/C][/ROW]
[ROW][C]1[/C][C]-0.231351[/C][C]-1.3881[/C][C]0.086818[/C][/ROW]
[ROW][C]2[/C][C]0.136738[/C][C]0.8204[/C][C]0.208685[/C][/ROW]
[ROW][C]3[/C][C]0.074038[/C][C]0.4442[/C][C]0.329768[/C][/ROW]
[ROW][C]4[/C][C]-0.05144[/C][C]-0.3086[/C][C]0.379687[/C][/ROW]
[ROW][C]5[/C][C]-0.202993[/C][C]-1.218[/C][C]0.115582[/C][/ROW]
[ROW][C]6[/C][C]-0.044064[/C][C]-0.2644[/C][C]0.396495[/C][/ROW]
[ROW][C]7[/C][C]0.100251[/C][C]0.6015[/C][C]0.275635[/C][/ROW]
[ROW][C]8[/C][C]-0.190059[/C][C]-1.1404[/C][C]0.130834[/C][/ROW]
[ROW][C]9[/C][C]0.177513[/C][C]1.0651[/C][C]0.146966[/C][/ROW]
[ROW][C]10[/C][C]-0.165834[/C][C]-0.995[/C][C]0.163187[/C][/ROW]
[ROW][C]11[/C][C]0.074918[/C][C]0.4495[/C][C]0.32788[/C][/ROW]
[ROW][C]12[/C][C]-0.273649[/C][C]-1.6419[/C][C]0.054661[/C][/ROW]
[ROW][C]13[/C][C]-0.235891[/C][C]-1.4153[/C][C]0.08278[/C][/ROW]
[ROW][C]14[/C][C]0.005491[/C][C]0.0329[/C][C]0.48695[/C][/ROW]
[ROW][C]15[/C][C]-0.236505[/C][C]-1.419[/C][C]0.082246[/C][/ROW]
[ROW][C]16[/C][C]-0.233919[/C][C]-1.4035[/C][C]0.084515[/C][/ROW]
[ROW][C]17[/C][C]-0.010958[/C][C]-0.0658[/C][C]0.47397[/C][/ROW]
[ROW][C]18[/C][C]-0.057461[/C][C]-0.3448[/C][C]0.366139[/C][/ROW]
[ROW][C]19[/C][C]-0.015634[/C][C]-0.0938[/C][C]0.462892[/C][/ROW]
[ROW][C]20[/C][C]0.022493[/C][C]0.135[/C][C]0.446698[/C][/ROW]
[ROW][C]21[/C][C]-0.020744[/C][C]-0.1245[/C][C]0.450821[/C][/ROW]
[ROW][C]22[/C][C]-0.026065[/C][C]-0.1564[/C][C]0.4383[/C][/ROW]
[ROW][C]23[/C][C]0.004334[/C][C]0.026[/C][C]0.489698[/C][/ROW]
[ROW][C]24[/C][C]0.004555[/C][C]0.0273[/C][C]0.489174[/C][/ROW]
[ROW][C]25[/C][C]-0.15975[/C][C]-0.9585[/C][C]0.172101[/C][/ROW]
[ROW][C]26[/C][C]-0.184104[/C][C]-1.1046[/C][C]0.138326[/C][/ROW]
[ROW][C]27[/C][C]-0.047726[/C][C]-0.2864[/C][C]0.388123[/C][/ROW]
[ROW][C]28[/C][C]0.0098[/C][C]0.0588[/C][C]0.476719[/C][/ROW]
[ROW][C]29[/C][C]-0.138982[/C][C]-0.8339[/C][C]0.204921[/C][/ROW]
[ROW][C]30[/C][C]-0.059132[/C][C]-0.3548[/C][C]0.362408[/C][/ROW]
[ROW][C]31[/C][C]-0.17563[/C][C]-1.0538[/C][C]0.149503[/C][/ROW]
[ROW][C]32[/C][C]-0.006886[/C][C]-0.0413[/C][C]0.483637[/C][/ROW]
[ROW][C]33[/C][C]-0.021864[/C][C]-0.1312[/C][C]0.448181[/C][/ROW]
[ROW][C]34[/C][C]-0.046343[/C][C]-0.2781[/C][C]0.391278[/C][/ROW]
[ROW][C]35[/C][C]0.097849[/C][C]0.5871[/C][C]0.280402[/C][/ROW]
[ROW][C]36[/C][C]NA[/C][C]NA[/C][C]NA[/C][/ROW]
[ROW][C]37[/C][C]NA[/C][C]NA[/C][C]NA[/C][/ROW]
[ROW][C]38[/C][C]NA[/C][C]NA[/C][C]NA[/C][/ROW]
[ROW][C]39[/C][C]NA[/C][C]NA[/C][C]NA[/C][/ROW]
[ROW][C]40[/C][C]NA[/C][C]NA[/C][C]NA[/C][/ROW]
[ROW][C]41[/C][C]NA[/C][C]NA[/C][C]NA[/C][/ROW]
[ROW][C]42[/C][C]NA[/C][C]NA[/C][C]NA[/C][/ROW]
[ROW][C]43[/C][C]NA[/C][C]NA[/C][C]NA[/C][/ROW]
[ROW][C]44[/C][C]NA[/C][C]NA[/C][C]NA[/C][/ROW]
[ROW][C]45[/C][C]NA[/C][C]NA[/C][C]NA[/C][/ROW]
[ROW][C]46[/C][C]NA[/C][C]NA[/C][C]NA[/C][/ROW]
[ROW][C]47[/C][C]NA[/C][C]NA[/C][C]NA[/C][/ROW]
[ROW][C]48[/C][C]NA[/C][C]NA[/C][C]NA[/C][/ROW]
[/TABLE]
Source: https://freestatistics.org/blog/index.php?pk=109502&T=2

Globally Unique Identifier (entire table): ba.freestatistics.org/blog/index.php?pk=109502&T=2

As an alternative you can also use a QR Code:  

The GUIDs for individual cells are displayed in the table below:

Partial Autocorrelation Function
Time lag kPACF(k)T-STATP-value
1-0.231351-1.38810.086818
20.1367380.82040.208685
30.0740380.44420.329768
4-0.05144-0.30860.379687
5-0.202993-1.2180.115582
6-0.044064-0.26440.396495
70.1002510.60150.275635
8-0.190059-1.14040.130834
90.1775131.06510.146966
10-0.165834-0.9950.163187
110.0749180.44950.32788
12-0.273649-1.64190.054661
13-0.235891-1.41530.08278
140.0054910.03290.48695
15-0.236505-1.4190.082246
16-0.233919-1.40350.084515
17-0.010958-0.06580.47397
18-0.057461-0.34480.366139
19-0.015634-0.09380.462892
200.0224930.1350.446698
21-0.020744-0.12450.450821
22-0.026065-0.15640.4383
230.0043340.0260.489698
240.0045550.02730.489174
25-0.15975-0.95850.172101
26-0.184104-1.10460.138326
27-0.047726-0.28640.388123
280.00980.05880.476719
29-0.138982-0.83390.204921
30-0.059132-0.35480.362408
31-0.17563-1.05380.149503
32-0.006886-0.04130.483637
33-0.021864-0.13120.448181
34-0.046343-0.27810.391278
350.0978490.58710.280402
36NANANA
37NANANA
38NANANA
39NANANA
40NANANA
41NANANA
42NANANA
43NANANA
44NANANA
45NANANA
46NANANA
47NANANA
48NANANA


Parameters (Session):
par1 = 48 ; par2 = 1 ; par3 = 0 ; par4 = 1 ; par5 = 12 ; par6 = White Noise ; par7 = 0.95 ;
Parameters (R input):
par1 = 48 ; par2 = 1 ; par3 = 0 ; par4 = 1 ; par5 = 12 ; par6 = White Noise ; par7 = 0.95 ;
R code (references can be found in the software module):
if (par1 == 'Default') {
par1 = 10*log10(length(x))
} else {
par1 <- as.numeric(par1)
}
par2 <- as.numeric(par2)
par3 <- as.numeric(par3)
par4 <- as.numeric(par4)
par5 <- as.numeric(par5)
if (par6 == 'White Noise') par6 <- 'white' else par6 <- 'ma'
par7 <- as.numeric(par7)
if (par2 == 0) {
x <- log(x)
} else {
x <- (x ^ par2 - 1) / par2
}
if (par3 > 0) x <- diff(x,lag=1,difference=par3)
if (par4 > 0) x <- diff(x,lag=par5,difference=par4)
bitmap(file='pic1.png')
racf <- acf(x, par1, main='Autocorrelation', xlab='time lag', ylab='ACF', ci.type=par6, ci=par7, sub=paste('(lambda=',par2,', d=',par3,', D=',par4,', CI=', par7, ', CI type=',par6,')',sep=''))
dev.off()
bitmap(file='pic2.png')
rpacf <- pacf(x,par1,main='Partial Autocorrelation',xlab='lags',ylab='PACF')
dev.off()
(myacf <- c(racf$acf))
(mypacf <- c(rpacf$acf))
lengthx <- length(x)
sqrtn <- sqrt(lengthx)
load(file='createtable')
a<-table.start()
a<-table.row.start(a)
a<-table.element(a,'Autocorrelation Function',4,TRUE)
a<-table.row.end(a)
a<-table.row.start(a)
a<-table.element(a,'Time lag k',header=TRUE)
a<-table.element(a,hyperlink('basics.htm','ACF(k)','click here for more information about the Autocorrelation Function'),header=TRUE)
a<-table.element(a,'T-STAT',header=TRUE)
a<-table.element(a,'P-value',header=TRUE)
a<-table.row.end(a)
for (i in 2:(par1+1)) {
a<-table.row.start(a)
a<-table.element(a,i-1,header=TRUE)
a<-table.element(a,round(myacf[i],6))
mytstat <- myacf[i]*sqrtn
a<-table.element(a,round(mytstat,4))
a<-table.element(a,round(1-pt(abs(mytstat),lengthx),6))
a<-table.row.end(a)
}
a<-table.end(a)
table.save(a,file='mytable.tab')
a<-table.start()
a<-table.row.start(a)
a<-table.element(a,'Partial Autocorrelation Function',4,TRUE)
a<-table.row.end(a)
a<-table.row.start(a)
a<-table.element(a,'Time lag k',header=TRUE)
a<-table.element(a,hyperlink('basics.htm','PACF(k)','click here for more information about the Partial Autocorrelation Function'),header=TRUE)
a<-table.element(a,'T-STAT',header=TRUE)
a<-table.element(a,'P-value',header=TRUE)
a<-table.row.end(a)
for (i in 1:par1) {
a<-table.row.start(a)
a<-table.element(a,i,header=TRUE)
a<-table.element(a,round(mypacf[i],6))
mytstat <- mypacf[i]*sqrtn
a<-table.element(a,round(mytstat,4))
a<-table.element(a,round(1-pt(abs(mytstat),lengthx),6))
a<-table.row.end(a)
}
a<-table.end(a)
table.save(a,file='mytable1.tab')