Free Statistics

of Irreproducible Research!

Author's title

Author*The author of this computation has been verified*
R Software Modulerwasp_arimabackwardselection.wasp
Title produced by softwareARIMA Backward Selection
Date of computationTue, 14 Dec 2010 10:38:24 +0000
Cite this page as followsStatistical Computations at FreeStatistics.org, Office for Research Development and Education, URL https://freestatistics.org/blog/index.php?v=date/2010/Dec/14/t1292323021lmnxgzfl8yldu12.htm/, Retrieved Thu, 02 May 2024 20:04:56 +0000
Statistical Computations at FreeStatistics.org, Office for Research Development and Education, URL https://freestatistics.org/blog/index.php?pk=109369, Retrieved Thu, 02 May 2024 20:04:56 +0000
QR Codes:

Original text written by user:
IsPrivate?No (this computation is public)
User-defined keywords
Estimated Impact137
Family? (F = Feedback message, R = changed R code, M = changed R Module, P = changed Parameters, D = changed Data)
-     [(Partial) Autocorrelation Function] [Faillissementen V...] [2010-12-14 08:51:21] [13c73ac943380855a1c72833078e44d2]
-   P   [(Partial) Autocorrelation Function] [Faillissementen V...] [2010-12-14 09:09:28] [13c73ac943380855a1c72833078e44d2]
- RMP     [Spectral Analysis] [Faillissementen V...] [2010-12-14 09:27:52] [13c73ac943380855a1c72833078e44d2]
- RMPD      [(Partial) Autocorrelation Function] [Faillissementen W...] [2010-12-14 10:11:32] [049b50ae610f671f7417ed8e2d1295c1]
- RM          [Spectral Analysis] [Faillissementen W...] [2010-12-14 10:17:19] [049b50ae610f671f7417ed8e2d1295c1]
- RM              [ARIMA Backward Selection] [Faillissementen W...] [2010-12-14 10:38:24] [9003764b6a75599accb6eea9154ba195] [Current]
-   PD              [ARIMA Backward Selection] [] [2010-12-17 10:29:12] [13c73ac943380855a1c72833078e44d2]
Feedback Forum

Post a new message
Dataseries X:
182
213
227
209
219
221
114
97
205
215
224
189
182
201
198
173
238
258
122
101
259
243
188
173
224
215
196
159
187
208
131
93
210
228
176
195
188
188
190
188
176
225
93
79
235
247
195
197
211
156
209
180
185
303
129
85
249
231
212
240
234
217
287
221
208
241
156
96
320
242
227
200


Summary of computational transaction
Raw Inputview raw input (R code)
Raw Outputview raw output of R engine
Computing time18 seconds
R Server'Gwilym Jenkins' @ 72.249.127.135

\begin{tabular}{lllllllll}
\hline
Summary of computational transaction \tabularnewline
Raw Input & view raw input (R code)  \tabularnewline
Raw Output & view raw output of R engine  \tabularnewline
Computing time & 18 seconds \tabularnewline
R Server & 'Gwilym Jenkins' @ 72.249.127.135 \tabularnewline
\hline
\end{tabular}
%Source: https://freestatistics.org/blog/index.php?pk=109369&T=0

[TABLE]
[ROW][C]Summary of computational transaction[/C][/ROW]
[ROW][C]Raw Input[/C][C]view raw input (R code) [/C][/ROW]
[ROW][C]Raw Output[/C][C]view raw output of R engine [/C][/ROW]
[ROW][C]Computing time[/C][C]18 seconds[/C][/ROW]
[ROW][C]R Server[/C][C]'Gwilym Jenkins' @ 72.249.127.135[/C][/ROW]
[/TABLE]
Source: https://freestatistics.org/blog/index.php?pk=109369&T=0

Globally Unique Identifier (entire table): ba.freestatistics.org/blog/index.php?pk=109369&T=0

As an alternative you can also use a QR Code:  

The GUIDs for individual cells are displayed in the table below:

Summary of computational transaction
Raw Inputview raw input (R code)
Raw Outputview raw output of R engine
Computing time18 seconds
R Server'Gwilym Jenkins' @ 72.249.127.135


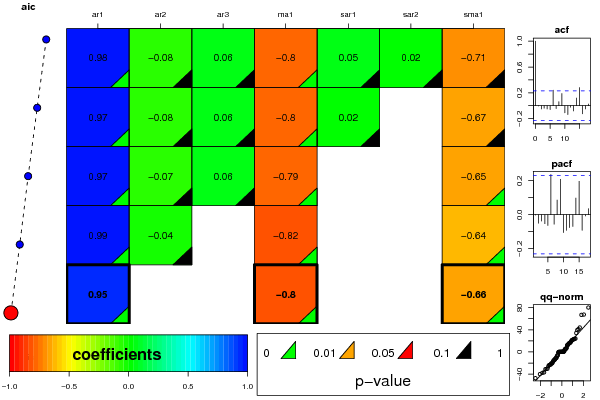
ARIMA Parameter Estimation and Backward Selection
Iterationar1ar2ar3ma1sar1sar2sma1
Estimates ( 1 )0.9761-0.07940.057-0.79750.05450.0206-0.7083
(p-val)(0 )(0.6951 )(0.7023 )(0 )(0.9453 )(0.9642 )(0.4567 )
Estimates ( 2 )0.9738-0.0790.0579-0.79580.0240-0.6725
(p-val)(0 )(0.6954 )(0.6954 )(0 )(0.9466 )(NA )(0.1092 )
Estimates ( 3 )0.9704-0.07490.0563-0.793800-0.6495
(p-val)(0 )(0.6947 )(0.6993 )(0 )(NA )(NA )(0.0037 )
Estimates ( 4 )0.9935-0.03760-0.815200-0.6378
(p-val)(0 )(0.8166 )(NA )(0 )(NA )(NA )(0.0027 )
Estimates ( 5 )0.95400-0.803500-0.6558
(p-val)(0 )(NA )(NA )(0 )(NA )(NA )(0.0014 )
Estimates ( 6 )NANANANANANANA
(p-val)(NA )(NA )(NA )(NA )(NA )(NA )(NA )
Estimates ( 7 )NANANANANANANA
(p-val)(NA )(NA )(NA )(NA )(NA )(NA )(NA )
Estimates ( 8 )NANANANANANANA
(p-val)(NA )(NA )(NA )(NA )(NA )(NA )(NA )
Estimates ( 9 )NANANANANANANA
(p-val)(NA )(NA )(NA )(NA )(NA )(NA )(NA )
Estimates ( 10 )NANANANANANANA
(p-val)(NA )(NA )(NA )(NA )(NA )(NA )(NA )
Estimates ( 11 )NANANANANANANA
(p-val)(NA )(NA )(NA )(NA )(NA )(NA )(NA )
Estimates ( 12 )NANANANANANANA
(p-val)(NA )(NA )(NA )(NA )(NA )(NA )(NA )
Estimates ( 13 )NANANANANANANA
(p-val)(NA )(NA )(NA )(NA )(NA )(NA )(NA )

\begin{tabular}{lllllllll}
\hline
ARIMA Parameter Estimation and Backward Selection \tabularnewline
Iteration & ar1 & ar2 & ar3 & ma1 & sar1 & sar2 & sma1 \tabularnewline
Estimates ( 1 ) & 0.9761 & -0.0794 & 0.057 & -0.7975 & 0.0545 & 0.0206 & -0.7083 \tabularnewline
(p-val) & (0 ) & (0.6951 ) & (0.7023 ) & (0 ) & (0.9453 ) & (0.9642 ) & (0.4567 ) \tabularnewline
Estimates ( 2 ) & 0.9738 & -0.079 & 0.0579 & -0.7958 & 0.024 & 0 & -0.6725 \tabularnewline
(p-val) & (0 ) & (0.6954 ) & (0.6954 ) & (0 ) & (0.9466 ) & (NA ) & (0.1092 ) \tabularnewline
Estimates ( 3 ) & 0.9704 & -0.0749 & 0.0563 & -0.7938 & 0 & 0 & -0.6495 \tabularnewline
(p-val) & (0 ) & (0.6947 ) & (0.6993 ) & (0 ) & (NA ) & (NA ) & (0.0037 ) \tabularnewline
Estimates ( 4 ) & 0.9935 & -0.0376 & 0 & -0.8152 & 0 & 0 & -0.6378 \tabularnewline
(p-val) & (0 ) & (0.8166 ) & (NA ) & (0 ) & (NA ) & (NA ) & (0.0027 ) \tabularnewline
Estimates ( 5 ) & 0.954 & 0 & 0 & -0.8035 & 0 & 0 & -0.6558 \tabularnewline
(p-val) & (0 ) & (NA ) & (NA ) & (0 ) & (NA ) & (NA ) & (0.0014 ) \tabularnewline
Estimates ( 6 ) & NA & NA & NA & NA & NA & NA & NA \tabularnewline
(p-val) & (NA ) & (NA ) & (NA ) & (NA ) & (NA ) & (NA ) & (NA ) \tabularnewline
Estimates ( 7 ) & NA & NA & NA & NA & NA & NA & NA \tabularnewline
(p-val) & (NA ) & (NA ) & (NA ) & (NA ) & (NA ) & (NA ) & (NA ) \tabularnewline
Estimates ( 8 ) & NA & NA & NA & NA & NA & NA & NA \tabularnewline
(p-val) & (NA ) & (NA ) & (NA ) & (NA ) & (NA ) & (NA ) & (NA ) \tabularnewline
Estimates ( 9 ) & NA & NA & NA & NA & NA & NA & NA \tabularnewline
(p-val) & (NA ) & (NA ) & (NA ) & (NA ) & (NA ) & (NA ) & (NA ) \tabularnewline
Estimates ( 10 ) & NA & NA & NA & NA & NA & NA & NA \tabularnewline
(p-val) & (NA ) & (NA ) & (NA ) & (NA ) & (NA ) & (NA ) & (NA ) \tabularnewline
Estimates ( 11 ) & NA & NA & NA & NA & NA & NA & NA \tabularnewline
(p-val) & (NA ) & (NA ) & (NA ) & (NA ) & (NA ) & (NA ) & (NA ) \tabularnewline
Estimates ( 12 ) & NA & NA & NA & NA & NA & NA & NA \tabularnewline
(p-val) & (NA ) & (NA ) & (NA ) & (NA ) & (NA ) & (NA ) & (NA ) \tabularnewline
Estimates ( 13 ) & NA & NA & NA & NA & NA & NA & NA \tabularnewline
(p-val) & (NA ) & (NA ) & (NA ) & (NA ) & (NA ) & (NA ) & (NA ) \tabularnewline
\hline
\end{tabular}
%Source: https://freestatistics.org/blog/index.php?pk=109369&T=1

[TABLE]
[ROW][C]ARIMA Parameter Estimation and Backward Selection[/C][/ROW]
[ROW][C]Iteration[/C][C]ar1[/C][C]ar2[/C][C]ar3[/C][C]ma1[/C][C]sar1[/C][C]sar2[/C][C]sma1[/C][/ROW]
[ROW][C]Estimates ( 1 )[/C][C]0.9761[/C][C]-0.0794[/C][C]0.057[/C][C]-0.7975[/C][C]0.0545[/C][C]0.0206[/C][C]-0.7083[/C][/ROW]
[ROW][C](p-val)[/C][C](0 )[/C][C](0.6951 )[/C][C](0.7023 )[/C][C](0 )[/C][C](0.9453 )[/C][C](0.9642 )[/C][C](0.4567 )[/C][/ROW]
[ROW][C]Estimates ( 2 )[/C][C]0.9738[/C][C]-0.079[/C][C]0.0579[/C][C]-0.7958[/C][C]0.024[/C][C]0[/C][C]-0.6725[/C][/ROW]
[ROW][C](p-val)[/C][C](0 )[/C][C](0.6954 )[/C][C](0.6954 )[/C][C](0 )[/C][C](0.9466 )[/C][C](NA )[/C][C](0.1092 )[/C][/ROW]
[ROW][C]Estimates ( 3 )[/C][C]0.9704[/C][C]-0.0749[/C][C]0.0563[/C][C]-0.7938[/C][C]0[/C][C]0[/C][C]-0.6495[/C][/ROW]
[ROW][C](p-val)[/C][C](0 )[/C][C](0.6947 )[/C][C](0.6993 )[/C][C](0 )[/C][C](NA )[/C][C](NA )[/C][C](0.0037 )[/C][/ROW]
[ROW][C]Estimates ( 4 )[/C][C]0.9935[/C][C]-0.0376[/C][C]0[/C][C]-0.8152[/C][C]0[/C][C]0[/C][C]-0.6378[/C][/ROW]
[ROW][C](p-val)[/C][C](0 )[/C][C](0.8166 )[/C][C](NA )[/C][C](0 )[/C][C](NA )[/C][C](NA )[/C][C](0.0027 )[/C][/ROW]
[ROW][C]Estimates ( 5 )[/C][C]0.954[/C][C]0[/C][C]0[/C][C]-0.8035[/C][C]0[/C][C]0[/C][C]-0.6558[/C][/ROW]
[ROW][C](p-val)[/C][C](0 )[/C][C](NA )[/C][C](NA )[/C][C](0 )[/C][C](NA )[/C][C](NA )[/C][C](0.0014 )[/C][/ROW]
[ROW][C]Estimates ( 6 )[/C][C]NA[/C][C]NA[/C][C]NA[/C][C]NA[/C][C]NA[/C][C]NA[/C][C]NA[/C][/ROW]
[ROW][C](p-val)[/C][C](NA )[/C][C](NA )[/C][C](NA )[/C][C](NA )[/C][C](NA )[/C][C](NA )[/C][C](NA )[/C][/ROW]
[ROW][C]Estimates ( 7 )[/C][C]NA[/C][C]NA[/C][C]NA[/C][C]NA[/C][C]NA[/C][C]NA[/C][C]NA[/C][/ROW]
[ROW][C](p-val)[/C][C](NA )[/C][C](NA )[/C][C](NA )[/C][C](NA )[/C][C](NA )[/C][C](NA )[/C][C](NA )[/C][/ROW]
[ROW][C]Estimates ( 8 )[/C][C]NA[/C][C]NA[/C][C]NA[/C][C]NA[/C][C]NA[/C][C]NA[/C][C]NA[/C][/ROW]
[ROW][C](p-val)[/C][C](NA )[/C][C](NA )[/C][C](NA )[/C][C](NA )[/C][C](NA )[/C][C](NA )[/C][C](NA )[/C][/ROW]
[ROW][C]Estimates ( 9 )[/C][C]NA[/C][C]NA[/C][C]NA[/C][C]NA[/C][C]NA[/C][C]NA[/C][C]NA[/C][/ROW]
[ROW][C](p-val)[/C][C](NA )[/C][C](NA )[/C][C](NA )[/C][C](NA )[/C][C](NA )[/C][C](NA )[/C][C](NA )[/C][/ROW]
[ROW][C]Estimates ( 10 )[/C][C]NA[/C][C]NA[/C][C]NA[/C][C]NA[/C][C]NA[/C][C]NA[/C][C]NA[/C][/ROW]
[ROW][C](p-val)[/C][C](NA )[/C][C](NA )[/C][C](NA )[/C][C](NA )[/C][C](NA )[/C][C](NA )[/C][C](NA )[/C][/ROW]
[ROW][C]Estimates ( 11 )[/C][C]NA[/C][C]NA[/C][C]NA[/C][C]NA[/C][C]NA[/C][C]NA[/C][C]NA[/C][/ROW]
[ROW][C](p-val)[/C][C](NA )[/C][C](NA )[/C][C](NA )[/C][C](NA )[/C][C](NA )[/C][C](NA )[/C][C](NA )[/C][/ROW]
[ROW][C]Estimates ( 12 )[/C][C]NA[/C][C]NA[/C][C]NA[/C][C]NA[/C][C]NA[/C][C]NA[/C][C]NA[/C][/ROW]
[ROW][C](p-val)[/C][C](NA )[/C][C](NA )[/C][C](NA )[/C][C](NA )[/C][C](NA )[/C][C](NA )[/C][C](NA )[/C][/ROW]
[ROW][C]Estimates ( 13 )[/C][C]NA[/C][C]NA[/C][C]NA[/C][C]NA[/C][C]NA[/C][C]NA[/C][C]NA[/C][/ROW]
[ROW][C](p-val)[/C][C](NA )[/C][C](NA )[/C][C](NA )[/C][C](NA )[/C][C](NA )[/C][C](NA )[/C][C](NA )[/C][/ROW]
[/TABLE]
Source: https://freestatistics.org/blog/index.php?pk=109369&T=1

Globally Unique Identifier (entire table): ba.freestatistics.org/blog/index.php?pk=109369&T=1

As an alternative you can also use a QR Code:  

The GUIDs for individual cells are displayed in the table below:

ARIMA Parameter Estimation and Backward Selection
Iterationar1ar2ar3ma1sar1sar2sma1
Estimates ( 1 )0.9761-0.07940.057-0.79750.05450.0206-0.7083
(p-val)(0 )(0.6951 )(0.7023 )(0 )(0.9453 )(0.9642 )(0.4567 )
Estimates ( 2 )0.9738-0.0790.0579-0.79580.0240-0.6725
(p-val)(0 )(0.6954 )(0.6954 )(0 )(0.9466 )(NA )(0.1092 )
Estimates ( 3 )0.9704-0.07490.0563-0.793800-0.6495
(p-val)(0 )(0.6947 )(0.6993 )(0 )(NA )(NA )(0.0037 )
Estimates ( 4 )0.9935-0.03760-0.815200-0.6378
(p-val)(0 )(0.8166 )(NA )(0 )(NA )(NA )(0.0027 )
Estimates ( 5 )0.95400-0.803500-0.6558
(p-val)(0 )(NA )(NA )(0 )(NA )(NA )(0.0014 )
Estimates ( 6 )NANANANANANANA
(p-val)(NA )(NA )(NA )(NA )(NA )(NA )(NA )
Estimates ( 7 )NANANANANANANA
(p-val)(NA )(NA )(NA )(NA )(NA )(NA )(NA )
Estimates ( 8 )NANANANANANANA
(p-val)(NA )(NA )(NA )(NA )(NA )(NA )(NA )
Estimates ( 9 )NANANANANANANA
(p-val)(NA )(NA )(NA )(NA )(NA )(NA )(NA )
Estimates ( 10 )NANANANANANANA
(p-val)(NA )(NA )(NA )(NA )(NA )(NA )(NA )
Estimates ( 11 )NANANANANANANA
(p-val)(NA )(NA )(NA )(NA )(NA )(NA )(NA )
Estimates ( 12 )NANANANANANANA
(p-val)(NA )(NA )(NA )(NA )(NA )(NA )(NA )
Estimates ( 13 )NANANANANANANA
(p-val)(NA )(NA )(NA )(NA )(NA )(NA )(NA )


Estimated ARIMA Residuals
Value
0.188999600970890
-0.000127511330870686
-10.1004350065454
-22.8030659082565
-25.56253759958
24.1140212945812
34.1405337866493
4.45524471064276
1.43682939460702
44.0641931231076
15.1557935424959
-39.9170431495348
-15.5796055402953
39.4578220422775
0.273629884666397
-20.5988476991078
-31.0026564734737
-37.6324324107737
-23.6394984836252
22.2819102300604
-0.752415537375013
-17.7192352777495
6.0276604956866
-20.7685026036412
23.6054164997769
-7.0084553324554
-15.2235300954010
-5.75261859206398
20.1380513867908
-30.0509422579471
8.13092798982818
-23.0317181585405
-6.20733639901611
21.5486596725180
23.4843148020203
5.0642898676328
12.2524915804739
15.9933526512207
-47.2039710491413
16.8732558676662
1.28302110931282
-10.2185344486943
80.1338872419998
6.22307505978263
-13.7030089755191
14.6448648952428
-13.8456150267523
13.1341382214414
41.0880999598667
18.5468186736008
16.7709325257104
66.7993147570317
12.5428632382861
-11.5945748327766
-36.7175532673636
21.9574323239293
-12.0026150624261
67.4103067053702
-20.1895861835733
5.68034002812862
-30.5207267624982

\begin{tabular}{lllllllll}
\hline
Estimated ARIMA Residuals \tabularnewline
Value \tabularnewline
0.188999600970890 \tabularnewline
-0.000127511330870686 \tabularnewline
-10.1004350065454 \tabularnewline
-22.8030659082565 \tabularnewline
-25.56253759958 \tabularnewline
24.1140212945812 \tabularnewline
34.1405337866493 \tabularnewline
4.45524471064276 \tabularnewline
1.43682939460702 \tabularnewline
44.0641931231076 \tabularnewline
15.1557935424959 \tabularnewline
-39.9170431495348 \tabularnewline
-15.5796055402953 \tabularnewline
39.4578220422775 \tabularnewline
0.273629884666397 \tabularnewline
-20.5988476991078 \tabularnewline
-31.0026564734737 \tabularnewline
-37.6324324107737 \tabularnewline
-23.6394984836252 \tabularnewline
22.2819102300604 \tabularnewline
-0.752415537375013 \tabularnewline
-17.7192352777495 \tabularnewline
6.0276604956866 \tabularnewline
-20.7685026036412 \tabularnewline
23.6054164997769 \tabularnewline
-7.0084553324554 \tabularnewline
-15.2235300954010 \tabularnewline
-5.75261859206398 \tabularnewline
20.1380513867908 \tabularnewline
-30.0509422579471 \tabularnewline
8.13092798982818 \tabularnewline
-23.0317181585405 \tabularnewline
-6.20733639901611 \tabularnewline
21.5486596725180 \tabularnewline
23.4843148020203 \tabularnewline
5.0642898676328 \tabularnewline
12.2524915804739 \tabularnewline
15.9933526512207 \tabularnewline
-47.2039710491413 \tabularnewline
16.8732558676662 \tabularnewline
1.28302110931282 \tabularnewline
-10.2185344486943 \tabularnewline
80.1338872419998 \tabularnewline
6.22307505978263 \tabularnewline
-13.7030089755191 \tabularnewline
14.6448648952428 \tabularnewline
-13.8456150267523 \tabularnewline
13.1341382214414 \tabularnewline
41.0880999598667 \tabularnewline
18.5468186736008 \tabularnewline
16.7709325257104 \tabularnewline
66.7993147570317 \tabularnewline
12.5428632382861 \tabularnewline
-11.5945748327766 \tabularnewline
-36.7175532673636 \tabularnewline
21.9574323239293 \tabularnewline
-12.0026150624261 \tabularnewline
67.4103067053702 \tabularnewline
-20.1895861835733 \tabularnewline
5.68034002812862 \tabularnewline
-30.5207267624982 \tabularnewline
\hline
\end{tabular}
%Source: https://freestatistics.org/blog/index.php?pk=109369&T=2

[TABLE]
[ROW][C]Estimated ARIMA Residuals[/C][/ROW]
[ROW][C]Value[/C][/ROW]
[ROW][C]0.188999600970890[/C][/ROW]
[ROW][C]-0.000127511330870686[/C][/ROW]
[ROW][C]-10.1004350065454[/C][/ROW]
[ROW][C]-22.8030659082565[/C][/ROW]
[ROW][C]-25.56253759958[/C][/ROW]
[ROW][C]24.1140212945812[/C][/ROW]
[ROW][C]34.1405337866493[/C][/ROW]
[ROW][C]4.45524471064276[/C][/ROW]
[ROW][C]1.43682939460702[/C][/ROW]
[ROW][C]44.0641931231076[/C][/ROW]
[ROW][C]15.1557935424959[/C][/ROW]
[ROW][C]-39.9170431495348[/C][/ROW]
[ROW][C]-15.5796055402953[/C][/ROW]
[ROW][C]39.4578220422775[/C][/ROW]
[ROW][C]0.273629884666397[/C][/ROW]
[ROW][C]-20.5988476991078[/C][/ROW]
[ROW][C]-31.0026564734737[/C][/ROW]
[ROW][C]-37.6324324107737[/C][/ROW]
[ROW][C]-23.6394984836252[/C][/ROW]
[ROW][C]22.2819102300604[/C][/ROW]
[ROW][C]-0.752415537375013[/C][/ROW]
[ROW][C]-17.7192352777495[/C][/ROW]
[ROW][C]6.0276604956866[/C][/ROW]
[ROW][C]-20.7685026036412[/C][/ROW]
[ROW][C]23.6054164997769[/C][/ROW]
[ROW][C]-7.0084553324554[/C][/ROW]
[ROW][C]-15.2235300954010[/C][/ROW]
[ROW][C]-5.75261859206398[/C][/ROW]
[ROW][C]20.1380513867908[/C][/ROW]
[ROW][C]-30.0509422579471[/C][/ROW]
[ROW][C]8.13092798982818[/C][/ROW]
[ROW][C]-23.0317181585405[/C][/ROW]
[ROW][C]-6.20733639901611[/C][/ROW]
[ROW][C]21.5486596725180[/C][/ROW]
[ROW][C]23.4843148020203[/C][/ROW]
[ROW][C]5.0642898676328[/C][/ROW]
[ROW][C]12.2524915804739[/C][/ROW]
[ROW][C]15.9933526512207[/C][/ROW]
[ROW][C]-47.2039710491413[/C][/ROW]
[ROW][C]16.8732558676662[/C][/ROW]
[ROW][C]1.28302110931282[/C][/ROW]
[ROW][C]-10.2185344486943[/C][/ROW]
[ROW][C]80.1338872419998[/C][/ROW]
[ROW][C]6.22307505978263[/C][/ROW]
[ROW][C]-13.7030089755191[/C][/ROW]
[ROW][C]14.6448648952428[/C][/ROW]
[ROW][C]-13.8456150267523[/C][/ROW]
[ROW][C]13.1341382214414[/C][/ROW]
[ROW][C]41.0880999598667[/C][/ROW]
[ROW][C]18.5468186736008[/C][/ROW]
[ROW][C]16.7709325257104[/C][/ROW]
[ROW][C]66.7993147570317[/C][/ROW]
[ROW][C]12.5428632382861[/C][/ROW]
[ROW][C]-11.5945748327766[/C][/ROW]
[ROW][C]-36.7175532673636[/C][/ROW]
[ROW][C]21.9574323239293[/C][/ROW]
[ROW][C]-12.0026150624261[/C][/ROW]
[ROW][C]67.4103067053702[/C][/ROW]
[ROW][C]-20.1895861835733[/C][/ROW]
[ROW][C]5.68034002812862[/C][/ROW]
[ROW][C]-30.5207267624982[/C][/ROW]
[/TABLE]
Source: https://freestatistics.org/blog/index.php?pk=109369&T=2

Globally Unique Identifier (entire table): ba.freestatistics.org/blog/index.php?pk=109369&T=2

As an alternative you can also use a QR Code:  

The GUIDs for individual cells are displayed in the table below:

Estimated ARIMA Residuals
Value
0.188999600970890
-0.000127511330870686
-10.1004350065454
-22.8030659082565
-25.56253759958
24.1140212945812
34.1405337866493
4.45524471064276
1.43682939460702
44.0641931231076
15.1557935424959
-39.9170431495348
-15.5796055402953
39.4578220422775
0.273629884666397
-20.5988476991078
-31.0026564734737
-37.6324324107737
-23.6394984836252
22.2819102300604
-0.752415537375013
-17.7192352777495
6.0276604956866
-20.7685026036412
23.6054164997769
-7.0084553324554
-15.2235300954010
-5.75261859206398
20.1380513867908
-30.0509422579471
8.13092798982818
-23.0317181585405
-6.20733639901611
21.5486596725180
23.4843148020203
5.0642898676328
12.2524915804739
15.9933526512207
-47.2039710491413
16.8732558676662
1.28302110931282
-10.2185344486943
80.1338872419998
6.22307505978263
-13.7030089755191
14.6448648952428
-13.8456150267523
13.1341382214414
41.0880999598667
18.5468186736008
16.7709325257104
66.7993147570317
12.5428632382861
-11.5945748327766
-36.7175532673636
21.9574323239293
-12.0026150624261
67.4103067053702
-20.1895861835733
5.68034002812862
-30.5207267624982


Parameters (Session):
par1 = 12 ;
Parameters (R input):
par1 = FALSE ; par2 = 1 ; par3 = 0 ; par4 = 1 ; par5 = 12 ; par6 = 3 ; par7 = 1 ; par8 = 2 ; par9 = 1 ;
R code (references can be found in the software module):
library(lattice)
if (par1 == 'TRUE') par1 <- TRUE
if (par1 == 'FALSE') par1 <- FALSE
par2 <- as.numeric(par2) #Box-Cox lambda transformation parameter
par3 <- as.numeric(par3) #degree of non-seasonal differencing
par4 <- as.numeric(par4) #degree of seasonal differencing
par5 <- as.numeric(par5) #seasonal period
par6 <- as.numeric(par6) #degree (p) of the non-seasonal AR(p) polynomial
par7 <- as.numeric(par7) #degree (q) of the non-seasonal MA(q) polynomial
par8 <- as.numeric(par8) #degree (P) of the seasonal AR(P) polynomial
par9 <- as.numeric(par9) #degree (Q) of the seasonal MA(Q) polynomial
armaGR <- function(arima.out, names, n){
try1 <- arima.out$coef
try2 <- sqrt(diag(arima.out$var.coef))
try.data.frame <- data.frame(matrix(NA,ncol=4,nrow=length(names)))
dimnames(try.data.frame) <- list(names,c('coef','std','tstat','pv'))
try.data.frame[,1] <- try1
for(i in 1:length(try2)) try.data.frame[which(rownames(try.data.frame)==names(try2)[i]),2] <- try2[i]
try.data.frame[,3] <- try.data.frame[,1] / try.data.frame[,2]
try.data.frame[,4] <- round((1-pt(abs(try.data.frame[,3]),df=n-(length(try2)+1)))*2,5)
vector <- rep(NA,length(names))
vector[is.na(try.data.frame[,4])] <- 0
maxi <- which.max(try.data.frame[,4])
continue <- max(try.data.frame[,4],na.rm=TRUE) > .05
vector[maxi] <- 0
list(summary=try.data.frame,next.vector=vector,continue=continue)
}
arimaSelect <- function(series, order=c(13,0,0), seasonal=list(order=c(2,0,0),period=12), include.mean=F){
nrc <- order[1]+order[3]+seasonal$order[1]+seasonal$order[3]
coeff <- matrix(NA, nrow=nrc*2, ncol=nrc)
pval <- matrix(NA, nrow=nrc*2, ncol=nrc)
mylist <- rep(list(NULL), nrc)
names <- NULL
if(order[1] > 0) names <- paste('ar',1:order[1],sep='')
if(order[3] > 0) names <- c( names , paste('ma',1:order[3],sep='') )
if(seasonal$order[1] > 0) names <- c(names, paste('sar',1:seasonal$order[1],sep=''))
if(seasonal$order[3] > 0) names <- c(names, paste('sma',1:seasonal$order[3],sep=''))
arima.out <- arima(series, order=order, seasonal=seasonal, include.mean=include.mean, method='ML')
mylist[[1]] <- arima.out
last.arma <- armaGR(arima.out, names, length(series))
mystop <- FALSE
i <- 1
coeff[i,] <- last.arma[[1]][,1]
pval [i,] <- last.arma[[1]][,4]
i <- 2
aic <- arima.out$aic
while(!mystop){
mylist[[i]] <- arima.out
arima.out <- arima(series, order=order, seasonal=seasonal, include.mean=include.mean, method='ML', fixed=last.arma$next.vector)
aic <- c(aic, arima.out$aic)
last.arma <- armaGR(arima.out, names, length(series))
mystop <- !last.arma$continue
coeff[i,] <- last.arma[[1]][,1]
pval [i,] <- last.arma[[1]][,4]
i <- i+1
}
list(coeff, pval, mylist, aic=aic)
}
arimaSelectplot <- function(arimaSelect.out,noms,choix){
noms <- names(arimaSelect.out[[3]][[1]]$coef)
coeff <- arimaSelect.out[[1]]
k <- min(which(is.na(coeff[,1])))-1
coeff <- coeff[1:k,]
pval <- arimaSelect.out[[2]][1:k,]
aic <- arimaSelect.out$aic[1:k]
coeff[coeff==0] <- NA
n <- ncol(coeff)
if(missing(choix)) choix <- k
layout(matrix(c(1,1,1,2,
3,3,3,2,
3,3,3,4,
5,6,7,7),nr=4),
widths=c(10,35,45,15),
heights=c(30,30,15,15))
couleurs <- rainbow(75)[1:50]#(50)
ticks <- pretty(coeff)
par(mar=c(1,1,3,1))
plot(aic,k:1-.5,type='o',pch=21,bg='blue',cex=2,axes=F,lty=2,xpd=NA)
points(aic[choix],k-choix+.5,pch=21,cex=4,bg=2,xpd=NA)
title('aic',line=2)
par(mar=c(3,0,0,0))
plot(0,axes=F,xlab='',ylab='',xlim=range(ticks),ylim=c(.1,1))
rect(xleft = min(ticks) + (0:49)/50*(max(ticks)-min(ticks)),
xright = min(ticks) + (1:50)/50*(max(ticks)-min(ticks)),
ytop = rep(1,50),
ybottom= rep(0,50),col=couleurs,border=NA)
axis(1,ticks)
rect(xleft=min(ticks),xright=max(ticks),ytop=1,ybottom=0)
text(mean(coeff,na.rm=T),.5,'coefficients',cex=2,font=2)
par(mar=c(1,1,3,1))
image(1:n,1:k,t(coeff[k:1,]),axes=F,col=couleurs,zlim=range(ticks))
for(i in 1:n) for(j in 1:k) if(!is.na(coeff[j,i])) {
if(pval[j,i]<.01) symb = 'green'
else if( (pval[j,i]<.05) & (pval[j,i]>=.01)) symb = 'orange'
else if( (pval[j,i]<.1) & (pval[j,i]>=.05)) symb = 'red'
else symb = 'black'
polygon(c(i+.5 ,i+.2 ,i+.5 ,i+.5),
c(k-j+0.5,k-j+0.5,k-j+0.8,k-j+0.5),
col=symb)
if(j==choix) {
rect(xleft=i-.5,
xright=i+.5,
ybottom=k-j+1.5,
ytop=k-j+.5,
lwd=4)
text(i,
k-j+1,
round(coeff[j,i],2),
cex=1.2,
font=2)
}
else{
rect(xleft=i-.5,xright=i+.5,ybottom=k-j+1.5,ytop=k-j+.5)
text(i,k-j+1,round(coeff[j,i],2),cex=1.2,font=1)
}
}
axis(3,1:n,noms)
par(mar=c(0.5,0,0,0.5))
plot(0,axes=F,xlab='',ylab='',type='n',xlim=c(0,8),ylim=c(-.2,.8))
cols <- c('green','orange','red','black')
niv <- c('0','0.01','0.05','0.1')
for(i in 0:3){
polygon(c(1+2*i ,1+2*i ,1+2*i-.5 ,1+2*i),
c(.4 ,.7 , .4 , .4),
col=cols[i+1])
text(2*i,0.5,niv[i+1],cex=1.5)
}
text(8,.5,1,cex=1.5)
text(4,0,'p-value',cex=2)
box()
residus <- arimaSelect.out[[3]][[choix]]$res
par(mar=c(1,2,4,1))
acf(residus,main='')
title('acf',line=.5)
par(mar=c(1,2,4,1))
pacf(residus,main='')
title('pacf',line=.5)
par(mar=c(2,2,4,1))
qqnorm(residus,main='')
title('qq-norm',line=.5)
qqline(residus)
residus
}
if (par2 == 0) x <- log(x)
if (par2 != 0) x <- x^par2
(selection <- arimaSelect(x, order=c(par6,par3,par7), seasonal=list(order=c(par8,par4,par9), period=par5)))
bitmap(file='test1.png')
resid <- arimaSelectplot(selection)
dev.off()
resid
bitmap(file='test2.png')
acf(resid,length(resid)/2, main='Residual Autocorrelation Function')
dev.off()
bitmap(file='test3.png')
pacf(resid,length(resid)/2, main='Residual Partial Autocorrelation Function')
dev.off()
bitmap(file='test4.png')
cpgram(resid, main='Residual Cumulative Periodogram')
dev.off()
bitmap(file='test5.png')
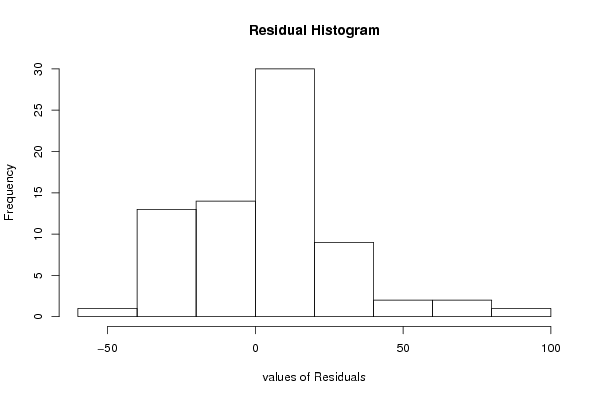
hist(resid, main='Residual Histogram', xlab='values of Residuals')
dev.off()
bitmap(file='test6.png')
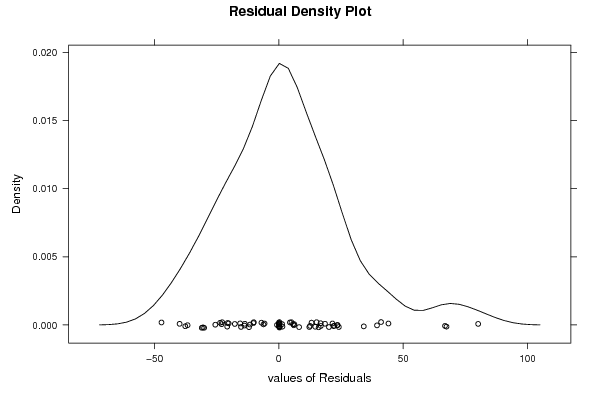
densityplot(~resid,col='black',main='Residual Density Plot', xlab='values of Residuals')
dev.off()
bitmap(file='test7.png')
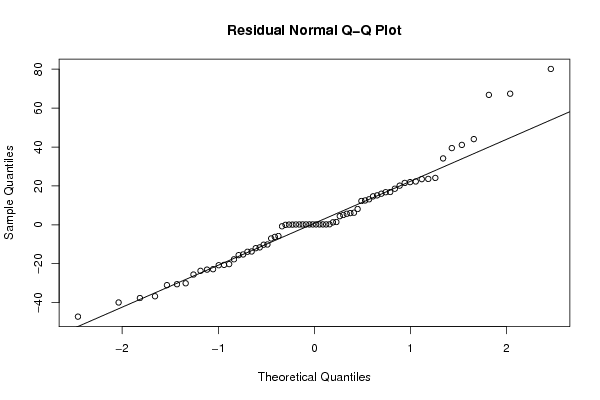
qqnorm(resid, main='Residual Normal Q-Q Plot')
qqline(resid)
dev.off()
ncols <- length(selection[[1]][1,])
nrows <- length(selection[[2]][,1])-1
load(file='createtable')
a<-table.start()
a<-table.row.start(a)
a<-table.element(a,'ARIMA Parameter Estimation and Backward Selection', ncols+1,TRUE)
a<-table.row.end(a)
a<-table.row.start(a)
a<-table.element(a,'Iteration', header=TRUE)
for (i in 1:ncols) {
a<-table.element(a,names(selection[[3]][[1]]$coef)[i],header=TRUE)
}
a<-table.row.end(a)
for (j in 1:nrows) {
a<-table.row.start(a)
mydum <- 'Estimates ('
mydum <- paste(mydum,j)
mydum <- paste(mydum,')')
a<-table.element(a,mydum, header=TRUE)
for (i in 1:ncols) {
a<-table.element(a,round(selection[[1]][j,i],4))
}
a<-table.row.end(a)
a<-table.row.start(a)
a<-table.element(a,'(p-val)', header=TRUE)
for (i in 1:ncols) {
mydum <- '('
mydum <- paste(mydum,round(selection[[2]][j,i],4),sep='')
mydum <- paste(mydum,')')
a<-table.element(a,mydum)
}
a<-table.row.end(a)
}
a<-table.end(a)
table.save(a,file='mytable.tab')
a<-table.start()
a<-table.row.start(a)
a<-table.element(a,'Estimated ARIMA Residuals', 1,TRUE)
a<-table.row.end(a)
a<-table.row.start(a)
a<-table.element(a,'Value', 1,TRUE)
a<-table.row.end(a)
for (i in (par4*par5+par3):length(resid)) {
a<-table.row.start(a)
a<-table.element(a,resid[i])
a<-table.row.end(a)
}
a<-table.end(a)
table.save(a,file='mytable1.tab')