Free Statistics

of Irreproducible Research!

Author's title

Author*The author of this computation has been verified*
R Software Modulerwasp_smp.wasp
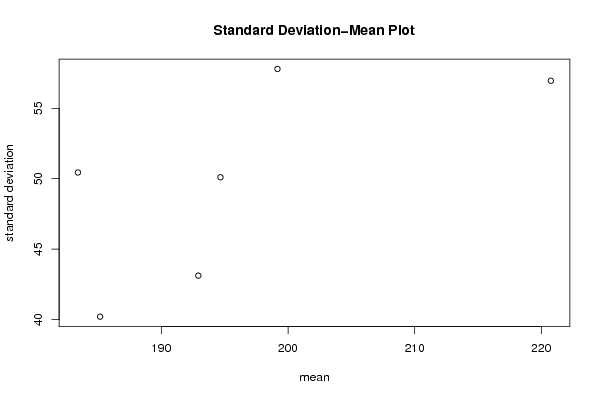
Title produced by softwareStandard Deviation-Mean Plot
Date of computationTue, 14 Dec 2010 10:34:22 +0000
Cite this page as followsStatistical Computations at FreeStatistics.org, Office for Research Development and Education, URL https://freestatistics.org/blog/index.php?v=date/2010/Dec/14/t1292322759t82aw0xo6nszd8d.htm/, Retrieved Thu, 02 May 2024 14:15:50 +0000
Statistical Computations at FreeStatistics.org, Office for Research Development and Education, URL https://freestatistics.org/blog/index.php?pk=109363, Retrieved Thu, 02 May 2024 14:15:50 +0000
QR Codes:

Original text written by user:
IsPrivate?No (this computation is public)
User-defined keywords
Estimated Impact145
Family? (F = Feedback message, R = changed R code, M = changed R Module, P = changed Parameters, D = changed Data)
-     [(Partial) Autocorrelation Function] [Faillissementen V...] [2010-12-14 08:51:21] [13c73ac943380855a1c72833078e44d2]
-   P   [(Partial) Autocorrelation Function] [Faillissementen V...] [2010-12-14 09:09:28] [13c73ac943380855a1c72833078e44d2]
- RMP     [Spectral Analysis] [Faillissementen V...] [2010-12-14 09:27:52] [13c73ac943380855a1c72833078e44d2]
- RMPD      [(Partial) Autocorrelation Function] [Faillissementen W...] [2010-12-14 10:11:32] [049b50ae610f671f7417ed8e2d1295c1]
- RM          [Spectral Analysis] [Faillissementen W...] [2010-12-14 10:17:19] [049b50ae610f671f7417ed8e2d1295c1]
- RM              [Standard Deviation-Mean Plot] [Faillissementen W...] [2010-12-14 10:34:22] [9003764b6a75599accb6eea9154ba195] [Current]
Feedback Forum

Post a new message
Dataseries X:
182
213
227
209
219
221
114
97
205
215
224
189
182
201
198
173
238
258
122
101
259
243
188
173
224
215
196
159
187
208
131
93
210
228
176
195
188
188
190
188
176
225
93
79
235
247
195
197
211
156
209
180
185
303
129
85
249
231
212
240
234
217
287
221
208
241
156
96
320
242
227
200


Summary of computational transaction
Raw Inputview raw input (R code)
Raw Outputview raw output of R engine
Computing time1 seconds
R Server'Gwilym Jenkins' @ 72.249.127.135

\begin{tabular}{lllllllll}
\hline
Summary of computational transaction \tabularnewline
Raw Input & view raw input (R code)  \tabularnewline
Raw Output & view raw output of R engine  \tabularnewline
Computing time & 1 seconds \tabularnewline
R Server & 'Gwilym Jenkins' @ 72.249.127.135 \tabularnewline
\hline
\end{tabular}
%Source: https://freestatistics.org/blog/index.php?pk=109363&T=0

[TABLE]
[ROW][C]Summary of computational transaction[/C][/ROW]
[ROW][C]Raw Input[/C][C]view raw input (R code) [/C][/ROW]
[ROW][C]Raw Output[/C][C]view raw output of R engine [/C][/ROW]
[ROW][C]Computing time[/C][C]1 seconds[/C][/ROW]
[ROW][C]R Server[/C][C]'Gwilym Jenkins' @ 72.249.127.135[/C][/ROW]
[/TABLE]
Source: https://freestatistics.org/blog/index.php?pk=109363&T=0

Globally Unique Identifier (entire table): ba.freestatistics.org/blog/index.php?pk=109363&T=0

As an alternative you can also use a QR Code:  

The GUIDs for individual cells are displayed in the table below:

Summary of computational transaction
Raw Inputview raw input (R code)
Raw Outputview raw output of R engine
Computing time1 seconds
R Server'Gwilym Jenkins' @ 72.249.127.135


Standard Deviation-Mean Plot
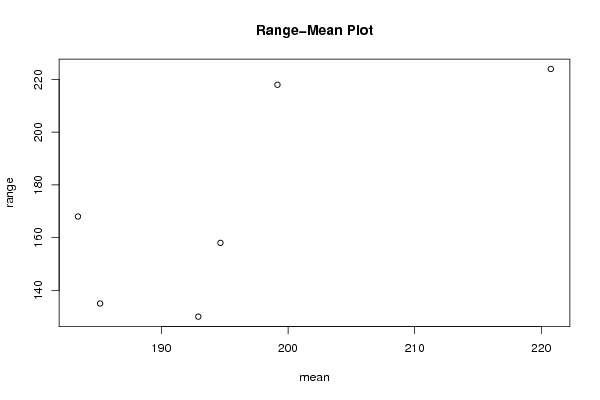
SectionMeanStandard DeviationRange
1192.91666666666743.1223593833626130
2194.66666666666750.1023195495221158
3185.16666666666740.210431331668135
4183.41666666666750.4443137318646168
5199.16666666666757.7893247979768218
6220.7556.9515344194278224

\begin{tabular}{lllllllll}
\hline
Standard Deviation-Mean Plot \tabularnewline
Section & Mean & Standard Deviation & Range \tabularnewline
1 & 192.916666666667 & 43.1223593833626 & 130 \tabularnewline
2 & 194.666666666667 & 50.1023195495221 & 158 \tabularnewline
3 & 185.166666666667 & 40.210431331668 & 135 \tabularnewline
4 & 183.416666666667 & 50.4443137318646 & 168 \tabularnewline
5 & 199.166666666667 & 57.7893247979768 & 218 \tabularnewline
6 & 220.75 & 56.9515344194278 & 224 \tabularnewline
\hline
\end{tabular}
%Source: https://freestatistics.org/blog/index.php?pk=109363&T=1

[TABLE]
[ROW][C]Standard Deviation-Mean Plot[/C][/ROW]
[ROW][C]Section[/C][C]Mean[/C][C]Standard Deviation[/C][C]Range[/C][/ROW]
[ROW][C]1[/C][C]192.916666666667[/C][C]43.1223593833626[/C][C]130[/C][/ROW]
[ROW][C]2[/C][C]194.666666666667[/C][C]50.1023195495221[/C][C]158[/C][/ROW]
[ROW][C]3[/C][C]185.166666666667[/C][C]40.210431331668[/C][C]135[/C][/ROW]
[ROW][C]4[/C][C]183.416666666667[/C][C]50.4443137318646[/C][C]168[/C][/ROW]
[ROW][C]5[/C][C]199.166666666667[/C][C]57.7893247979768[/C][C]218[/C][/ROW]
[ROW][C]6[/C][C]220.75[/C][C]56.9515344194278[/C][C]224[/C][/ROW]
[/TABLE]
Source: https://freestatistics.org/blog/index.php?pk=109363&T=1

Globally Unique Identifier (entire table): ba.freestatistics.org/blog/index.php?pk=109363&T=1

As an alternative you can also use a QR Code:  

The GUIDs for individual cells are displayed in the table below:

Standard Deviation-Mean Plot
SectionMeanStandard DeviationRange
1192.91666666666743.1223593833626130
2194.66666666666750.1023195495221158
3185.16666666666740.210431331668135
4183.41666666666750.4443137318646168
5199.16666666666757.7893247979768218
6220.7556.9515344194278224


Regression: S.E.(k) = alpha + beta * Mean(k)
alpha-18.8168948448242
beta0.349908582682152
S.D.0.196624356906031
T-STAT1.77957903175433
p-value0.149757734532485

\begin{tabular}{lllllllll}
\hline
Regression: S.E.(k) = alpha + beta * Mean(k) \tabularnewline
alpha & -18.8168948448242 \tabularnewline
beta & 0.349908582682152 \tabularnewline
S.D. & 0.196624356906031 \tabularnewline
T-STAT & 1.77957903175433 \tabularnewline
p-value & 0.149757734532485 \tabularnewline
\hline
\end{tabular}
%Source: https://freestatistics.org/blog/index.php?pk=109363&T=2

[TABLE]
[ROW][C]Regression: S.E.(k) = alpha + beta * Mean(k)[/C][/ROW]
[ROW][C]alpha[/C][C]-18.8168948448242[/C][/ROW]
[ROW][C]beta[/C][C]0.349908582682152[/C][/ROW]
[ROW][C]S.D.[/C][C]0.196624356906031[/C][/ROW]
[ROW][C]T-STAT[/C][C]1.77957903175433[/C][/ROW]
[ROW][C]p-value[/C][C]0.149757734532485[/C][/ROW]
[/TABLE]
Source: https://freestatistics.org/blog/index.php?pk=109363&T=2

Globally Unique Identifier (entire table): ba.freestatistics.org/blog/index.php?pk=109363&T=2

As an alternative you can also use a QR Code:  

The GUIDs for individual cells are displayed in the table below:

Regression: S.E.(k) = alpha + beta * Mean(k)
alpha-18.8168948448242
beta0.349908582682152
S.D.0.196624356906031
T-STAT1.77957903175433
p-value0.149757734532485


Regression: ln S.E.(k) = alpha + beta * ln Mean(k)
alpha-3.61886957216169
beta1.42478055617392
S.D.0.826789335473743
T-STAT1.72326915097125
p-value0.159936992696661
Lambda-0.42478055617392

\begin{tabular}{lllllllll}
\hline
Regression: ln S.E.(k) = alpha + beta * ln Mean(k) \tabularnewline
alpha & -3.61886957216169 \tabularnewline
beta & 1.42478055617392 \tabularnewline
S.D. & 0.826789335473743 \tabularnewline
T-STAT & 1.72326915097125 \tabularnewline
p-value & 0.159936992696661 \tabularnewline
Lambda & -0.42478055617392 \tabularnewline
\hline
\end{tabular}
%Source: https://freestatistics.org/blog/index.php?pk=109363&T=3

[TABLE]
[ROW][C]Regression: ln S.E.(k) = alpha + beta * ln Mean(k)[/C][/ROW]
[ROW][C]alpha[/C][C]-3.61886957216169[/C][/ROW]
[ROW][C]beta[/C][C]1.42478055617392[/C][/ROW]
[ROW][C]S.D.[/C][C]0.826789335473743[/C][/ROW]
[ROW][C]T-STAT[/C][C]1.72326915097125[/C][/ROW]
[ROW][C]p-value[/C][C]0.159936992696661[/C][/ROW]
[ROW][C]Lambda[/C][C]-0.42478055617392[/C][/ROW]
[/TABLE]
Source: https://freestatistics.org/blog/index.php?pk=109363&T=3

Globally Unique Identifier (entire table): ba.freestatistics.org/blog/index.php?pk=109363&T=3

As an alternative you can also use a QR Code:  

The GUIDs for individual cells are displayed in the table below:

Regression: ln S.E.(k) = alpha + beta * ln Mean(k)
alpha-3.61886957216169
beta1.42478055617392
S.D.0.826789335473743
T-STAT1.72326915097125
p-value0.159936992696661
Lambda-0.42478055617392


Parameters (Session):
par1 = 12 ;
Parameters (R input):
par1 = 12 ;
R code (references can be found in the software module):
par1 <- as.numeric(par1)
(n <- length(x))
(np <- floor(n / par1))
arr <- array(NA,dim=c(par1,np))
j <- 0
k <- 1
for (i in 1:(np*par1))
{
j = j + 1
arr[j,k] <- x[i]
if (j == par1) {
j = 0
k=k+1
}
}
arr
arr.mean <- array(NA,dim=np)
arr.sd <- array(NA,dim=np)
arr.range <- array(NA,dim=np)
for (j in 1:np)
{
arr.mean[j] <- mean(arr[,j],na.rm=TRUE)
arr.sd[j] <- sd(arr[,j],na.rm=TRUE)
arr.range[j] <- max(arr[,j],na.rm=TRUE) - min(arr[,j],na.rm=TRUE)
}
arr.mean
arr.sd
arr.range
(lm1 <- lm(arr.sd~arr.mean))
(lnlm1 <- lm(log(arr.sd)~log(arr.mean)))
(lm2 <- lm(arr.range~arr.mean))
bitmap(file='test1.png')
plot(arr.mean,arr.sd,main='Standard Deviation-Mean Plot',xlab='mean',ylab='standard deviation')
dev.off()
bitmap(file='test2.png')
plot(arr.mean,arr.range,main='Range-Mean Plot',xlab='mean',ylab='range')
dev.off()
load(file='createtable')
a<-table.start()
a<-table.row.start(a)
a<-table.element(a,'Standard Deviation-Mean Plot',4,TRUE)
a<-table.row.end(a)
a<-table.row.start(a)
a<-table.element(a,'Section',header=TRUE)
a<-table.element(a,'Mean',header=TRUE)
a<-table.element(a,'Standard Deviation',header=TRUE)
a<-table.element(a,'Range',header=TRUE)
a<-table.row.end(a)
for (j in 1:np) {
a<-table.row.start(a)
a<-table.element(a,j,header=TRUE)
a<-table.element(a,arr.mean[j])
a<-table.element(a,arr.sd[j] )
a<-table.element(a,arr.range[j] )
a<-table.row.end(a)
}
a<-table.end(a)
table.save(a,file='mytable.tab')
a<-table.start()
a<-table.row.start(a)
a<-table.element(a,'Regression: S.E.(k) = alpha + beta * Mean(k)',2,TRUE)
a<-table.row.end(a)
a<-table.row.start(a)
a<-table.element(a,'alpha',header=TRUE)
a<-table.element(a,lm1$coefficients[[1]])
a<-table.row.end(a)
a<-table.row.start(a)
a<-table.element(a,'beta',header=TRUE)
a<-table.element(a,lm1$coefficients[[2]])
a<-table.row.end(a)
a<-table.row.start(a)
a<-table.element(a,'S.D.',header=TRUE)
a<-table.element(a,summary(lm1)$coefficients[2,2])
a<-table.row.end(a)
a<-table.row.start(a)
a<-table.element(a,'T-STAT',header=TRUE)
a<-table.element(a,summary(lm1)$coefficients[2,3])
a<-table.row.end(a)
a<-table.row.start(a)
a<-table.element(a,'p-value',header=TRUE)
a<-table.element(a,summary(lm1)$coefficients[2,4])
a<-table.row.end(a)
a<-table.end(a)
table.save(a,file='mytable1.tab')
a<-table.start()
a<-table.row.start(a)
a<-table.element(a,'Regression: ln S.E.(k) = alpha + beta * ln Mean(k)',2,TRUE)
a<-table.row.end(a)
a<-table.row.start(a)
a<-table.element(a,'alpha',header=TRUE)
a<-table.element(a,lnlm1$coefficients[[1]])
a<-table.row.end(a)
a<-table.row.start(a)
a<-table.element(a,'beta',header=TRUE)
a<-table.element(a,lnlm1$coefficients[[2]])
a<-table.row.end(a)
a<-table.row.start(a)
a<-table.element(a,'S.D.',header=TRUE)
a<-table.element(a,summary(lnlm1)$coefficients[2,2])
a<-table.row.end(a)
a<-table.row.start(a)
a<-table.element(a,'T-STAT',header=TRUE)
a<-table.element(a,summary(lnlm1)$coefficients[2,3])
a<-table.row.end(a)
a<-table.row.start(a)
a<-table.element(a,'p-value',header=TRUE)
a<-table.element(a,summary(lnlm1)$coefficients[2,4])
a<-table.row.end(a)
a<-table.row.start(a)
a<-table.element(a,'Lambda',header=TRUE)
a<-table.element(a,1-lnlm1$coefficients[[2]])
a<-table.row.end(a)
a<-table.end(a)
table.save(a,file='mytable2.tab')