Free Statistics

of Irreproducible Research!

Author's title

Author*The author of this computation has been verified*
R Software Modulerwasp_regression_trees1.wasp
Title produced by softwareRecursive Partitioning (Regression Trees)
Date of computationTue, 14 Dec 2010 10:29:52 +0000
Cite this page as followsStatistical Computations at FreeStatistics.org, Office for Research Development and Education, URL https://freestatistics.org/blog/index.php?v=date/2010/Dec/14/t1292322618icaa2o9emw2164c.htm/, Retrieved Thu, 02 May 2024 16:02:51 +0000
Statistical Computations at FreeStatistics.org, Office for Research Development and Education, URL https://freestatistics.org/blog/index.php?pk=109361, Retrieved Thu, 02 May 2024 16:02:51 +0000
QR Codes:

Original text written by user:
IsPrivate?No (this computation is public)
User-defined keywords
Estimated Impact123
Family? (F = Feedback message, R = changed R code, M = changed R Module, P = changed Parameters, D = changed Data)
-     [Kendall tau Correlation Matrix] [Correlation scien...] [2010-12-13 18:47:35] [6bc4f9343b7ea3ef5a59412d1f72bb2b]
- RMPD  [Multiple Regression] [Multiple regressi...] [2010-12-14 10:04:25] [6bc4f9343b7ea3ef5a59412d1f72bb2b]
- RMPD      [Recursive Partitioning (Regression Trees)] [SWS Tree no categ...] [2010-12-14 10:29:52] [b6992a7b26e556359948e164e4227eba] [Current]
Feedback Forum

Post a new message
Dataseries X:
6,300000	0,301030	1,504077	0,000000	0,819544	1,623249	3,000000	1,000000	3,000000
2,100000	0,255273	4,234107	3,406029	3,663041	2,795185	3,000000	5,000000	4,000000
9,100000	-0,154902	3,295837	1,023252	2,254064	2,255273	4,000000	4,000000	4,000000
15,800000	0,591065	2,944439	-1,638272	-0,522879	1,544068	1,000000	1,000000	1,000000
5,200000	0,000000	3,414443	2,204120	2,227887	2,593286	4,000000	5,000000	4,000000
10,900000	0,556303	3,332205	0,518514	1,408240	1,799341	1,000000	2,000000	1,000000
8,300000	0,146128	3,912023	1,717338	2,643453	2,361728	1,000000	1,000000	1,000000
11,000000	0,176091	1,945910	-0,371611	0,806180	2,049218	5,000000	4,000000	4,000000
3,200000	-0,154902	3,401197	2,667453	2,626340	2,448706	5,000000	5,000000	5,000000
6,300000	0,322219	1,252763	-1,124939	0,079181	1,623249	1,000000	1,000000	1,000000
6,600000	0,612784	1,791759	-0,105130	0,544068	1,623249	2,000000	2,000000	2,000000
9,500000	0,079181	2,341806	-0,698970	0,698970	2,079181	2,000000	2,000000	2,000000
3,300000	-0,301030	2,995732	1,441852	2,060698	2,170262	5,000000	5,000000	5,000000
11,000000	0,531479	1,360977	-0,920819	0,000000	1,204120	3,000000	1,000000	2,000000
4,700000	0,176091	3,713572	1,929419	2,511883	2,491362	1,000000	3,000000	1,000000
10,400000	0,531479	2,197225	-0,995679	0,602060	1,447158	5,000000	1,000000	3,000000
7,400000	-0,096910	2,028148	0,017033	0,740363	1,832509	5,000000	3,000000	4,000000
2,100000	-0,096910	3,828641	2,716838	2,816241	2,526339	5,000000	5,000000	5,000000
17,900000	0,301030	3,178054	-2,000000	-0,602060	1,698970	1,000000	1,000000	1,000000
6,100000	0,278754	4,605170	1,792392	3,120574	2,426511	1,000000	1,000000	1,000000
11,900000	0,113943	1,163151	-1,638272	-0,397940	1,278754	4,000000	1,000000	3,000000
13,800000	0,748188	1,609438	0,230449	0,799341	1,079181	2,000000	1,000000	1,000000
14,300000	0,491362	1,871802	0,544068	1,033424	2,079181	2,000000	1,000000	1,000000
15,200000	0,255273	2,484907	-0,318759	1,190332	2,146128	2,000000	2,000000	2,000000
10,000000	-0,045757	3,005683	1,000000	2,060698	2,230449	4,000000	4,000000	4,000000
11,900000	0,255273	2,564949	0,209515	1,056905	1,230449	2,000000	1,000000	2,000000
6,500000	0,278754	3,295837	2,283301	2,255273	2,060698	4,000000	4,000000	4,000000
7,500000	-0,045757	2,890372	0,397940	1,082785	1,491362	5,000000	5,000000	5,000000
10,600000	0,414973	1,547563	-0,552842	0,278754	1,322219	3,000000	1,000000	3,000000
7,400000	0,380211	2,282382	0,626853	1,702431	1,716003	1,000000	1,000000	1,000000
8,400000	0,079181	3,367296	0,832509	2,252853	2,214844	2,000000	3,000000	2,000000
5,700000	-0,045757	1,945910	-0,124939	1,089905	2,352183	2,000000	2,000000	2,000000
4,900000	-0,301030	1,791759	0,556303	1,322219	2,352183	3,000000	2,000000	3,000000
3,200000	-0,221849	2,995732	1,744293	2,243038	2,178977	5,000000	5,000000	5,000000
11,000000	0,361728	1,504077	-0,045757	0,414973	1,778151	2,000000	1,000000	2,000000
4,900000	-0,301030	2,014903	0,301030	1,089905	2,301030	3,000000	1,000000	3,000000
13,200000	0,414973	0,832909	-0,982967	0,397940	1,662758	3,000000	2,000000	2,000000
9,700000	-0,221849	3,178054	0,622214	1,763428	2,322219	4,000000	3,000000	4,000000
12,800000	0,819544	1,098612	0,544068	0,591065	1,146128	2,000000	1,000000	1,000000


Summary of computational transaction
Raw Inputview raw input (R code)
Raw Outputview raw output of R engine
Computing time7 seconds
R Server'Gwilym Jenkins' @ 72.249.127.135

\begin{tabular}{lllllllll}
\hline
Summary of computational transaction \tabularnewline
Raw Input & view raw input (R code)  \tabularnewline
Raw Output & view raw output of R engine  \tabularnewline
Computing time & 7 seconds \tabularnewline
R Server & 'Gwilym Jenkins' @ 72.249.127.135 \tabularnewline
\hline
\end{tabular}
%Source: https://freestatistics.org/blog/index.php?pk=109361&T=0

[TABLE]
[ROW][C]Summary of computational transaction[/C][/ROW]
[ROW][C]Raw Input[/C][C]view raw input (R code) [/C][/ROW]
[ROW][C]Raw Output[/C][C]view raw output of R engine [/C][/ROW]
[ROW][C]Computing time[/C][C]7 seconds[/C][/ROW]
[ROW][C]R Server[/C][C]'Gwilym Jenkins' @ 72.249.127.135[/C][/ROW]
[/TABLE]
Source: https://freestatistics.org/blog/index.php?pk=109361&T=0

Globally Unique Identifier (entire table): ba.freestatistics.org/blog/index.php?pk=109361&T=0

As an alternative you can also use a QR Code:  

The GUIDs for individual cells are displayed in the table below:

Summary of computational transaction
Raw Inputview raw input (R code)
Raw Outputview raw output of R engine
Computing time7 seconds
R Server'Gwilym Jenkins' @ 72.249.127.135


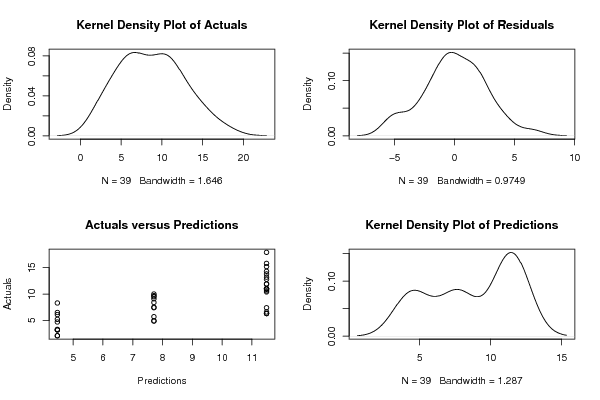
Goodness of Fit
Correlation0.7499
R-squared0.5624
RMSE2.5911

\begin{tabular}{lllllllll}
\hline
Goodness of Fit \tabularnewline
Correlation & 0.7499 \tabularnewline
R-squared & 0.5624 \tabularnewline
RMSE & 2.5911 \tabularnewline
\hline
\end{tabular}
%Source: https://freestatistics.org/blog/index.php?pk=109361&T=1

[TABLE]
[ROW][C]Goodness of Fit[/C][/ROW]
[ROW][C]Correlation[/C][C]0.7499[/C][/ROW]
[ROW][C]R-squared[/C][C]0.5624[/C][/ROW]
[ROW][C]RMSE[/C][C]2.5911[/C][/ROW]
[/TABLE]
Source: https://freestatistics.org/blog/index.php?pk=109361&T=1

Globally Unique Identifier (entire table): ba.freestatistics.org/blog/index.php?pk=109361&T=1

As an alternative you can also use a QR Code:  

The GUIDs for individual cells are displayed in the table below:

Goodness of Fit
Correlation0.7499
R-squared0.5624
RMSE2.5911


Actuals, Predictions, and Residuals
#ActualsForecastsResiduals
16.311.4894736842105-5.18947368421053
22.14.47-2.37
39.17.711.39
415.811.48947368421054.31052631578947
55.24.470.73
610.911.4894736842105-0.589473684210526
78.34.473.83
81111.4894736842105-0.489473684210527
93.24.47-1.27
106.311.4894736842105-5.18947368421053
116.611.4894736842105-4.88947368421053
129.57.711.79
133.34.47-1.17
141111.4894736842105-0.489473684210527
154.74.470.230000000000000
1610.411.4894736842105-1.08947368421053
177.47.71-0.310000000000000
182.14.47-2.37
1917.911.48947368421056.41052631578947
206.14.471.63
2111.911.48947368421050.410526315789474
2213.811.48947368421052.31052631578947
2314.311.48947368421052.81052631578947
2415.211.48947368421053.71052631578947
25107.712.29
2611.911.48947368421050.410526315789474
276.54.472.03
287.57.71-0.210000000000001
2910.611.4894736842105-0.889473684210527
307.411.4894736842105-4.08947368421053
318.47.710.69
325.77.71-2.01
334.97.71-2.81
343.24.47-1.27
351111.4894736842105-0.489473684210527
364.97.71-2.81
3713.211.48947368421051.71052631578947
389.77.711.99
3912.811.48947368421051.31052631578947

\begin{tabular}{lllllllll}
\hline
Actuals, Predictions, and Residuals \tabularnewline
# & Actuals & Forecasts & Residuals \tabularnewline
1 & 6.3 & 11.4894736842105 & -5.18947368421053 \tabularnewline
2 & 2.1 & 4.47 & -2.37 \tabularnewline
3 & 9.1 & 7.71 & 1.39 \tabularnewline
4 & 15.8 & 11.4894736842105 & 4.31052631578947 \tabularnewline
5 & 5.2 & 4.47 & 0.73 \tabularnewline
6 & 10.9 & 11.4894736842105 & -0.589473684210526 \tabularnewline
7 & 8.3 & 4.47 & 3.83 \tabularnewline
8 & 11 & 11.4894736842105 & -0.489473684210527 \tabularnewline
9 & 3.2 & 4.47 & -1.27 \tabularnewline
10 & 6.3 & 11.4894736842105 & -5.18947368421053 \tabularnewline
11 & 6.6 & 11.4894736842105 & -4.88947368421053 \tabularnewline
12 & 9.5 & 7.71 & 1.79 \tabularnewline
13 & 3.3 & 4.47 & -1.17 \tabularnewline
14 & 11 & 11.4894736842105 & -0.489473684210527 \tabularnewline
15 & 4.7 & 4.47 & 0.230000000000000 \tabularnewline
16 & 10.4 & 11.4894736842105 & -1.08947368421053 \tabularnewline
17 & 7.4 & 7.71 & -0.310000000000000 \tabularnewline
18 & 2.1 & 4.47 & -2.37 \tabularnewline
19 & 17.9 & 11.4894736842105 & 6.41052631578947 \tabularnewline
20 & 6.1 & 4.47 & 1.63 \tabularnewline
21 & 11.9 & 11.4894736842105 & 0.410526315789474 \tabularnewline
22 & 13.8 & 11.4894736842105 & 2.31052631578947 \tabularnewline
23 & 14.3 & 11.4894736842105 & 2.81052631578947 \tabularnewline
24 & 15.2 & 11.4894736842105 & 3.71052631578947 \tabularnewline
25 & 10 & 7.71 & 2.29 \tabularnewline
26 & 11.9 & 11.4894736842105 & 0.410526315789474 \tabularnewline
27 & 6.5 & 4.47 & 2.03 \tabularnewline
28 & 7.5 & 7.71 & -0.210000000000001 \tabularnewline
29 & 10.6 & 11.4894736842105 & -0.889473684210527 \tabularnewline
30 & 7.4 & 11.4894736842105 & -4.08947368421053 \tabularnewline
31 & 8.4 & 7.71 & 0.69 \tabularnewline
32 & 5.7 & 7.71 & -2.01 \tabularnewline
33 & 4.9 & 7.71 & -2.81 \tabularnewline
34 & 3.2 & 4.47 & -1.27 \tabularnewline
35 & 11 & 11.4894736842105 & -0.489473684210527 \tabularnewline
36 & 4.9 & 7.71 & -2.81 \tabularnewline
37 & 13.2 & 11.4894736842105 & 1.71052631578947 \tabularnewline
38 & 9.7 & 7.71 & 1.99 \tabularnewline
39 & 12.8 & 11.4894736842105 & 1.31052631578947 \tabularnewline
\hline
\end{tabular}
%Source: https://freestatistics.org/blog/index.php?pk=109361&T=2

[TABLE]
[ROW][C]Actuals, Predictions, and Residuals[/C][/ROW]
[ROW][C]#[/C][C]Actuals[/C][C]Forecasts[/C][C]Residuals[/C][/ROW]
[ROW][C]1[/C][C]6.3[/C][C]11.4894736842105[/C][C]-5.18947368421053[/C][/ROW]
[ROW][C]2[/C][C]2.1[/C][C]4.47[/C][C]-2.37[/C][/ROW]
[ROW][C]3[/C][C]9.1[/C][C]7.71[/C][C]1.39[/C][/ROW]
[ROW][C]4[/C][C]15.8[/C][C]11.4894736842105[/C][C]4.31052631578947[/C][/ROW]
[ROW][C]5[/C][C]5.2[/C][C]4.47[/C][C]0.73[/C][/ROW]
[ROW][C]6[/C][C]10.9[/C][C]11.4894736842105[/C][C]-0.589473684210526[/C][/ROW]
[ROW][C]7[/C][C]8.3[/C][C]4.47[/C][C]3.83[/C][/ROW]
[ROW][C]8[/C][C]11[/C][C]11.4894736842105[/C][C]-0.489473684210527[/C][/ROW]
[ROW][C]9[/C][C]3.2[/C][C]4.47[/C][C]-1.27[/C][/ROW]
[ROW][C]10[/C][C]6.3[/C][C]11.4894736842105[/C][C]-5.18947368421053[/C][/ROW]
[ROW][C]11[/C][C]6.6[/C][C]11.4894736842105[/C][C]-4.88947368421053[/C][/ROW]
[ROW][C]12[/C][C]9.5[/C][C]7.71[/C][C]1.79[/C][/ROW]
[ROW][C]13[/C][C]3.3[/C][C]4.47[/C][C]-1.17[/C][/ROW]
[ROW][C]14[/C][C]11[/C][C]11.4894736842105[/C][C]-0.489473684210527[/C][/ROW]
[ROW][C]15[/C][C]4.7[/C][C]4.47[/C][C]0.230000000000000[/C][/ROW]
[ROW][C]16[/C][C]10.4[/C][C]11.4894736842105[/C][C]-1.08947368421053[/C][/ROW]
[ROW][C]17[/C][C]7.4[/C][C]7.71[/C][C]-0.310000000000000[/C][/ROW]
[ROW][C]18[/C][C]2.1[/C][C]4.47[/C][C]-2.37[/C][/ROW]
[ROW][C]19[/C][C]17.9[/C][C]11.4894736842105[/C][C]6.41052631578947[/C][/ROW]
[ROW][C]20[/C][C]6.1[/C][C]4.47[/C][C]1.63[/C][/ROW]
[ROW][C]21[/C][C]11.9[/C][C]11.4894736842105[/C][C]0.410526315789474[/C][/ROW]
[ROW][C]22[/C][C]13.8[/C][C]11.4894736842105[/C][C]2.31052631578947[/C][/ROW]
[ROW][C]23[/C][C]14.3[/C][C]11.4894736842105[/C][C]2.81052631578947[/C][/ROW]
[ROW][C]24[/C][C]15.2[/C][C]11.4894736842105[/C][C]3.71052631578947[/C][/ROW]
[ROW][C]25[/C][C]10[/C][C]7.71[/C][C]2.29[/C][/ROW]
[ROW][C]26[/C][C]11.9[/C][C]11.4894736842105[/C][C]0.410526315789474[/C][/ROW]
[ROW][C]27[/C][C]6.5[/C][C]4.47[/C][C]2.03[/C][/ROW]
[ROW][C]28[/C][C]7.5[/C][C]7.71[/C][C]-0.210000000000001[/C][/ROW]
[ROW][C]29[/C][C]10.6[/C][C]11.4894736842105[/C][C]-0.889473684210527[/C][/ROW]
[ROW][C]30[/C][C]7.4[/C][C]11.4894736842105[/C][C]-4.08947368421053[/C][/ROW]
[ROW][C]31[/C][C]8.4[/C][C]7.71[/C][C]0.69[/C][/ROW]
[ROW][C]32[/C][C]5.7[/C][C]7.71[/C][C]-2.01[/C][/ROW]
[ROW][C]33[/C][C]4.9[/C][C]7.71[/C][C]-2.81[/C][/ROW]
[ROW][C]34[/C][C]3.2[/C][C]4.47[/C][C]-1.27[/C][/ROW]
[ROW][C]35[/C][C]11[/C][C]11.4894736842105[/C][C]-0.489473684210527[/C][/ROW]
[ROW][C]36[/C][C]4.9[/C][C]7.71[/C][C]-2.81[/C][/ROW]
[ROW][C]37[/C][C]13.2[/C][C]11.4894736842105[/C][C]1.71052631578947[/C][/ROW]
[ROW][C]38[/C][C]9.7[/C][C]7.71[/C][C]1.99[/C][/ROW]
[ROW][C]39[/C][C]12.8[/C][C]11.4894736842105[/C][C]1.31052631578947[/C][/ROW]
[/TABLE]
Source: https://freestatistics.org/blog/index.php?pk=109361&T=2

Globally Unique Identifier (entire table): ba.freestatistics.org/blog/index.php?pk=109361&T=2

As an alternative you can also use a QR Code:  

The GUIDs for individual cells are displayed in the table below:

Actuals, Predictions, and Residuals
#ActualsForecastsResiduals
16.311.4894736842105-5.18947368421053
22.14.47-2.37
39.17.711.39
415.811.48947368421054.31052631578947
55.24.470.73
610.911.4894736842105-0.589473684210526
78.34.473.83
81111.4894736842105-0.489473684210527
93.24.47-1.27
106.311.4894736842105-5.18947368421053
116.611.4894736842105-4.88947368421053
129.57.711.79
133.34.47-1.17
141111.4894736842105-0.489473684210527
154.74.470.230000000000000
1610.411.4894736842105-1.08947368421053
177.47.71-0.310000000000000
182.14.47-2.37
1917.911.48947368421056.41052631578947
206.14.471.63
2111.911.48947368421050.410526315789474
2213.811.48947368421052.31052631578947
2314.311.48947368421052.81052631578947
2415.211.48947368421053.71052631578947
25107.712.29
2611.911.48947368421050.410526315789474
276.54.472.03
287.57.71-0.210000000000001
2910.611.4894736842105-0.889473684210527
307.411.4894736842105-4.08947368421053
318.47.710.69
325.77.71-2.01
334.97.71-2.81
343.24.47-1.27
351111.4894736842105-0.489473684210527
364.97.71-2.81
3713.211.48947368421051.71052631578947
389.77.711.99
3912.811.48947368421051.31052631578947


Parameters (Session):
par1 = 1 ; par2 = quantiles ; par3 = 4 ; par4 = no ;
Parameters (R input):
par1 = 1 ; par2 = none ; par3 = 3 ; par4 = no ;
R code (references can be found in the software module):
library(party)
library(Hmisc)
par1 <- as.numeric(par1)
par3 <- as.numeric(par3)
x <- data.frame(t(y))
is.data.frame(x)
x <- x[!is.na(x[,par1]),]
k <- length(x[1,])
n <- length(x[,1])
colnames(x)[par1]
x[,par1]
if (par2 == 'kmeans') {
cl <- kmeans(x[,par1], par3)
print(cl)
clm <- matrix(cbind(cl$centers,1:par3),ncol=2)
clm <- clm[sort.list(clm[,1]),]
for (i in 1:par3) {
cl$cluster[cl$cluster==clm[i,2]] <- paste('C',i,sep='')
}
cl$cluster <- as.factor(cl$cluster)
print(cl$cluster)
x[,par1] <- cl$cluster
}
if (par2 == 'quantiles') {
x[,par1] <- cut2(x[,par1],g=par3)
}
if (par2 == 'hclust') {
hc <- hclust(dist(x[,par1])^2, 'cen')
print(hc)
memb <- cutree(hc, k = par3)
dum <- c(mean(x[memb==1,par1]))
for (i in 2:par3) {
dum <- c(dum, mean(x[memb==i,par1]))
}
hcm <- matrix(cbind(dum,1:par3),ncol=2)
hcm <- hcm[sort.list(hcm[,1]),]
for (i in 1:par3) {
memb[memb==hcm[i,2]] <- paste('C',i,sep='')
}
memb <- as.factor(memb)
print(memb)
x[,par1] <- memb
}
if (par2=='equal') {
ed <- cut(as.numeric(x[,par1]),par3,labels=paste('C',1:par3,sep=''))
x[,par1] <- as.factor(ed)
}
table(x[,par1])
colnames(x)
colnames(x)[par1]
x[,par1]
if (par2 == 'none') {
m <- ctree(as.formula(paste(colnames(x)[par1],' ~ .',sep='')),data = x)
}
load(file='createtable')
if (par2 != 'none') {
m <- ctree(as.formula(paste('as.factor(',colnames(x)[par1],') ~ .',sep='')),data = x)
if (par4=='yes') {
a<-table.start()
a<-table.row.start(a)
a<-table.element(a,'10-Fold Cross Validation',3+2*par3,TRUE)
a<-table.row.end(a)
a<-table.row.start(a)
a<-table.element(a,'',1,TRUE)
a<-table.element(a,'Prediction (training)',par3+1,TRUE)
a<-table.element(a,'Prediction (testing)',par3+1,TRUE)
a<-table.row.end(a)
a<-table.row.start(a)
a<-table.element(a,'Actual',1,TRUE)
for (jjj in 1:par3) a<-table.element(a,paste('C',jjj,sep=''),1,TRUE)
a<-table.element(a,'CV',1,TRUE)
for (jjj in 1:par3) a<-table.element(a,paste('C',jjj,sep=''),1,TRUE)
a<-table.element(a,'CV',1,TRUE)
a<-table.row.end(a)
for (i in 1:10) {
ind <- sample(2, nrow(x), replace=T, prob=c(0.9,0.1))
m.ct <- ctree(as.formula(paste('as.factor(',colnames(x)[par1],') ~ .',sep='')),data =x[ind==1,])
if (i==1) {
m.ct.i.pred <- predict(m.ct, newdata=x[ind==1,])
m.ct.i.actu <- x[ind==1,par1]
m.ct.x.pred <- predict(m.ct, newdata=x[ind==2,])
m.ct.x.actu <- x[ind==2,par1]
} else {
m.ct.i.pred <- c(m.ct.i.pred,predict(m.ct, newdata=x[ind==1,]))
m.ct.i.actu <- c(m.ct.i.actu,x[ind==1,par1])
m.ct.x.pred <- c(m.ct.x.pred,predict(m.ct, newdata=x[ind==2,]))
m.ct.x.actu <- c(m.ct.x.actu,x[ind==2,par1])
}
}
print(m.ct.i.tab <- table(m.ct.i.actu,m.ct.i.pred))
numer <- 0
for (i in 1:par3) {
print(m.ct.i.tab[i,i] / sum(m.ct.i.tab[i,]))
numer <- numer + m.ct.i.tab[i,i]
}
print(m.ct.i.cp <- numer / sum(m.ct.i.tab))
print(m.ct.x.tab <- table(m.ct.x.actu,m.ct.x.pred))
numer <- 0
for (i in 1:par3) {
print(m.ct.x.tab[i,i] / sum(m.ct.x.tab[i,]))
numer <- numer + m.ct.x.tab[i,i]
}
print(m.ct.x.cp <- numer / sum(m.ct.x.tab))
for (i in 1:par3) {
a<-table.row.start(a)
a<-table.element(a,paste('C',i,sep=''),1,TRUE)
for (jjj in 1:par3) a<-table.element(a,m.ct.i.tab[i,jjj])
a<-table.element(a,round(m.ct.i.tab[i,i]/sum(m.ct.i.tab[i,]),4))
for (jjj in 1:par3) a<-table.element(a,m.ct.x.tab[i,jjj])
a<-table.element(a,round(m.ct.x.tab[i,i]/sum(m.ct.x.tab[i,]),4))
a<-table.row.end(a)
}
a<-table.row.start(a)
a<-table.element(a,'Overall',1,TRUE)
for (jjj in 1:par3) a<-table.element(a,'-')
a<-table.element(a,round(m.ct.i.cp,4))
for (jjj in 1:par3) a<-table.element(a,'-')
a<-table.element(a,round(m.ct.x.cp,4))
a<-table.row.end(a)
a<-table.end(a)
table.save(a,file='mytable3.tab')
}
}
m
bitmap(file='test1.png')
plot(m)
dev.off()
bitmap(file='test1a.png')
plot(x[,par1] ~ as.factor(where(m)),main='Response by Terminal Node',xlab='Terminal Node',ylab='Response')
dev.off()
if (par2 == 'none') {
forec <- predict(m)
result <- as.data.frame(cbind(x[,par1],forec,x[,par1]-forec))
colnames(result) <- c('Actuals','Forecasts','Residuals')
print(result)
}
if (par2 != 'none') {
print(cbind(as.factor(x[,par1]),predict(m)))
myt <- table(as.factor(x[,par1]),predict(m))
print(myt)
}
bitmap(file='test2.png')
if(par2=='none') {
op <- par(mfrow=c(2,2))
plot(density(result$Actuals),main='Kernel Density Plot of Actuals')
plot(density(result$Residuals),main='Kernel Density Plot of Residuals')
plot(result$Forecasts,result$Actuals,main='Actuals versus Predictions',xlab='Predictions',ylab='Actuals')
plot(density(result$Forecasts),main='Kernel Density Plot of Predictions')
par(op)
}
if(par2!='none') {
plot(myt,main='Confusion Matrix',xlab='Actual',ylab='Predicted')
}
dev.off()
if (par2 == 'none') {
detcoef <- cor(result$Forecasts,result$Actuals)
a<-table.start()
a<-table.row.start(a)
a<-table.element(a,'Goodness of Fit',2,TRUE)
a<-table.row.end(a)
a<-table.row.start(a)
a<-table.element(a,'Correlation',1,TRUE)
a<-table.element(a,round(detcoef,4))
a<-table.row.end(a)
a<-table.row.start(a)
a<-table.element(a,'R-squared',1,TRUE)
a<-table.element(a,round(detcoef*detcoef,4))
a<-table.row.end(a)
a<-table.row.start(a)
a<-table.element(a,'RMSE',1,TRUE)
a<-table.element(a,round(sqrt(mean((result$Residuals)^2)),4))
a<-table.row.end(a)
a<-table.end(a)
table.save(a,file='mytable1.tab')
a<-table.start()
a<-table.row.start(a)
a<-table.element(a,'Actuals, Predictions, and Residuals',4,TRUE)
a<-table.row.end(a)
a<-table.row.start(a)
a<-table.element(a,'#',header=TRUE)
a<-table.element(a,'Actuals',header=TRUE)
a<-table.element(a,'Forecasts',header=TRUE)
a<-table.element(a,'Residuals',header=TRUE)
a<-table.row.end(a)
for (i in 1:length(result$Actuals)) {
a<-table.row.start(a)
a<-table.element(a,i,header=TRUE)
a<-table.element(a,result$Actuals[i])
a<-table.element(a,result$Forecasts[i])
a<-table.element(a,result$Residuals[i])
a<-table.row.end(a)
}
a<-table.end(a)
table.save(a,file='mytable.tab')
}
if (par2 != 'none') {
a<-table.start()
a<-table.row.start(a)
a<-table.element(a,'Confusion Matrix (predicted in columns / actuals in rows)',par3+1,TRUE)
a<-table.row.end(a)
a<-table.row.start(a)
a<-table.element(a,'',1,TRUE)
for (i in 1:par3) {
a<-table.element(a,paste('C',i,sep=''),1,TRUE)
}
a<-table.row.end(a)
for (i in 1:par3) {
a<-table.row.start(a)
a<-table.element(a,paste('C',i,sep=''),1,TRUE)
for (j in 1:par3) {
a<-table.element(a,myt[i,j])
}
a<-table.row.end(a)
}
a<-table.end(a)
table.save(a,file='mytable2.tab')
}