| Multiple Linear Regression - Estimated Regression Equation |
| Coffee[t] = + 68.0723686397847 + 0.304500792349745Tea[t] -1.25713504067567Sugar[t] -0.262795671803581Month[t] + e[t] |
| Multiple Linear Regression - Ordinary Least Squares | |||||
| Variable | Parameter | S.D. | T-STAT H0: parameter = 0 | 2-tail p-value | 1-tail p-value |
| (Intercept) | 68.0723686397847 | 8.810102 | 7.7266 | 0 | 0 |
| Tea | 0.304500792349745 | 0.053903 | 5.6491 | 1e-06 | 0 |
| Sugar | -1.25713504067567 | 0.637807 | -1.971 | 0.053671 | 0.026835 |
| Month | -0.262795671803581 | 0.432824 | -0.6072 | 0.546196 | 0.273098 |
| Multiple Linear Regression - Regression Statistics | |
| Multiple R | 0.690489041401806 |
| R-squared | 0.476775116295986 |
| Adjusted R-squared | 0.448745211811842 |
| F-TEST (value) | 17.0095162673742 |
| F-TEST (DF numerator) | 3 |
| F-TEST (DF denominator) | 56 |
| p-value | 5.65215638737016e-08 |
| Multiple Linear Regression - Residual Statistics | |
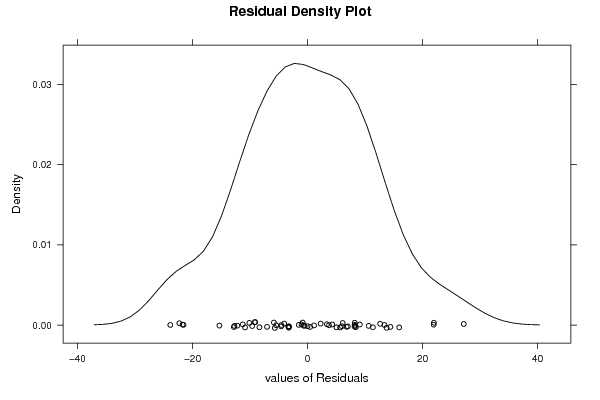
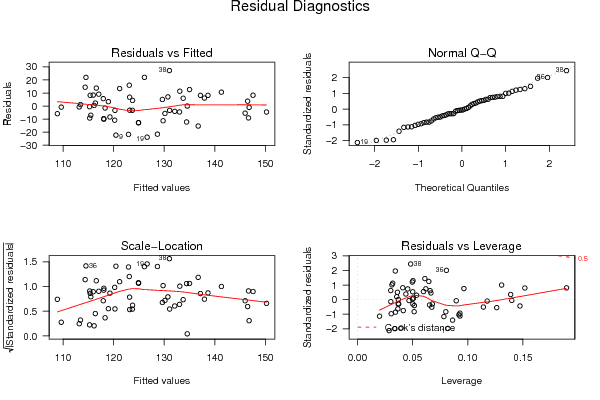
| Residual Standard Deviation | 11.3971446966654 |
| Sum Squared Residuals | 7274.11480525678 |
| Multiple Linear Regression - Actuals, Interpolation, and Residuals | |||
| Time or Index | Actuals | Interpolation Forecast | Residuals Prediction Error |
| 1 | 107.11 | 128.662130930568 | -21.5521309305683 |
| 2 | 122.23 | 134.421933222549 | -12.1919332225493 |
| 3 | 134.69 | 129.638511130671 | 5.05148886932928 |
| 4 | 128.79 | 114.369170164627 | 14.4208298353734 |
| 5 | 126.16 | 117.057769808118 | 9.10223019188241 |
| 6 | 119.98 | 123.172187210518 | -3.19218721051825 |
| 7 | 108.45 | 115.484672110065 | -7.03467211006466 |
| 8 | 108.43 | 118.051911906927 | -9.62191190692672 |
| 9 | 98.17 | 120.450600615055 | -22.2806006150546 |
| 10 | 106.09 | 115.272306736940 | -9.18230673693971 |
| 11 | 108.81 | 109.642470745525 | -0.832470745525286 |
| 12 | 103.03 | 108.873459405249 | -5.84345940524896 |
| 13 | 124.36 | 115.969234938134 | 8.39076506186558 |
| 14 | 118.52 | 129.780760798325 | -11.2607607983253 |
| 15 | 112.2 | 124.903150934556 | -12.7031509345560 |
| 16 | 114.71 | 115.243815739372 | -0.533815739371678 |
| 17 | 107.96 | 118.063166878598 | -10.1031668785980 |
| 18 | 101.21 | 122.938974019127 | -21.7289740191269 |
| 19 | 102.77 | 126.624991221830 | -23.8549912218295 |
| 20 | 112.13 | 124.931076322090 | -12.8010763220896 |
| 21 | 109.36 | 120.209202332730 | -10.8492023327297 |
| 22 | 110.91 | 119.265180303849 | -8.35518030384904 |
| 23 | 123.57 | 115.364126175556 | 8.20587382444437 |
| 24 | 129.95 | 123.159595425465 | 6.7904045745354 |
| 25 | 124.46 | 130.140648874347 | -5.68064887434744 |
| 26 | 122.34 | 118.965278290556 | 3.37472170944368 |
| 27 | 116.61 | 116.143367313500 | 0.466632686500259 |
| 28 | 114.59 | 113.444638083259 | 1.14536191674095 |
| 29 | 112.52 | 113.198363339170 | -0.67836333917032 |
| 30 | 118.67 | 116.378909226572 | 2.29109077342769 |
| 31 | 116.8 | 118.313924941305 | -1.51392494130478 |
| 32 | 123.63 | 117.952857226926 | 5.67714277307447 |
| 33 | 128.04 | 123.740235673775 | 4.29976432622453 |
| 34 | 134.57 | 121.185160589447 | 13.3848394105534 |
| 35 | 130.33 | 116.571525455457 | 13.7584745445435 |
| 36 | 136.47 | 114.524147666746 | 21.9458523332542 |
| 37 | 139.05 | 123.095210396439 | 15.954789603561 |
| 38 | 158.21 | 131.029394103788 | 27.1806058962115 |
| 39 | 148.07 | 126.087582448290 | 21.9824175517102 |
| 40 | 137.74 | 130.729156975283 | 7.01084302471727 |
| 41 | 139.74 | 133.753244369793 | 5.98675563020711 |
| 42 | 144.08 | 137.958540107357 | 6.12145989264292 |
| 43 | 145.35 | 137.163932834538 | 8.1860671654615 |
| 44 | 145.77 | 146.791200966296 | -1.02120096629554 |
| 45 | 140.56 | 146.006584135034 | -5.44658413503381 |
| 46 | 121.41 | 136.723910697488 | -15.3139106974878 |
| 47 | 120.44 | 123.694399675040 | -3.25439967504047 |
| 48 | 116.97 | 120.260392953763 | -3.29039295376268 |
| 49 | 128.03 | 132.076602340880 | -4.04660234088049 |
| 50 | 128.51 | 133.029523839215 | -4.5195238392153 |
| 51 | 127.76 | 131.070303825491 | -3.31030382549129 |
| 52 | 134.58 | 134.559141760412 | 0.0208582395883736 |
| 53 | 147.64 | 135.006739398240 | 12.6332606017595 |
| 54 | 144.46 | 133.086653149866 | 11.3733468501339 |
| 55 | 137.6 | 146.670487750024 | -9.07048775002383 |
| 56 | 146.87 | 138.657000373689 | 8.21299962631053 |
| 57 | 145.67 | 150.235532553376 | -4.56553255337574 |
| 58 | 151.95 | 141.311902558122 | 10.6380974418783 |
| 59 | 150.23 | 146.496662451635 | 3.73333754836456 |
| 60 | 155.86 | 147.566444578439 | 8.29355542156121 |
| Goldfeld-Quandt test for Heteroskedasticity | |||
| p-values | Alternative Hypothesis | ||
| breakpoint index | greater | 2-sided | less |
| 7 | 0.492819412119448 | 0.985638824238895 | 0.507180587880552 |
| 8 | 0.327401748037203 | 0.654803496074405 | 0.672598251962798 |
| 9 | 0.246338347730052 | 0.492676695460103 | 0.753661652269949 |
| 10 | 0.436106638655858 | 0.872213277311717 | 0.563893361344142 |
| 11 | 0.413357717133063 | 0.826715434266126 | 0.586642282866937 |
| 12 | 0.360547402766308 | 0.721094805532617 | 0.639452597233692 |
| 13 | 0.28505544278446 | 0.57011088556892 | 0.71494455721554 |
| 14 | 0.22284707198364 | 0.44569414396728 | 0.77715292801636 |
| 15 | 0.173999659923807 | 0.347999319847614 | 0.826000340076193 |
| 16 | 0.11701686345221 | 0.23403372690442 | 0.88298313654779 |
| 17 | 0.0916475481218257 | 0.183295096243651 | 0.908352451878174 |
| 18 | 0.123472237774764 | 0.246944475549528 | 0.876527762225236 |
| 19 | 0.184167390228665 | 0.36833478045733 | 0.815832609771335 |
| 20 | 0.212327151541828 | 0.424654303083655 | 0.787672848458172 |
| 21 | 0.221618736361898 | 0.443237472723795 | 0.778381263638102 |
| 22 | 0.23545520162277 | 0.47091040324554 | 0.76454479837723 |
| 23 | 0.393336704148834 | 0.786673408297669 | 0.606663295851166 |
| 24 | 0.661559690637616 | 0.676880618724767 | 0.338440309362384 |
| 25 | 0.618190533336343 | 0.763618933327315 | 0.381809466663657 |
| 26 | 0.552072595477339 | 0.895854809045321 | 0.447927404522661 |
| 27 | 0.52180053276918 | 0.95639893446164 | 0.47819946723082 |
| 28 | 0.506975900811411 | 0.986048198377178 | 0.493024099188589 |
| 29 | 0.530502234861866 | 0.938995530276268 | 0.469497765138134 |
| 30 | 0.495439298414284 | 0.990878596828568 | 0.504560701585716 |
| 31 | 0.50506067626588 | 0.98987864746824 | 0.49493932373412 |
| 32 | 0.478869731981294 | 0.957739463962588 | 0.521130268018706 |
| 33 | 0.472527116871636 | 0.94505423374327 | 0.527472883128364 |
| 34 | 0.560913192974876 | 0.878173614050248 | 0.439086807025124 |
| 35 | 0.567923329743687 | 0.864153340512626 | 0.432076670256313 |
| 36 | 0.73753420845092 | 0.524931583098160 | 0.262465791549080 |
| 37 | 0.766294744188872 | 0.467410511622256 | 0.233705255811128 |
| 38 | 0.968394732007656 | 0.0632105359846883 | 0.0316052679923442 |
| 39 | 0.99165774360572 | 0.0166845127885581 | 0.00834225639427904 |
| 40 | 0.988360923718264 | 0.0232781525634723 | 0.0116390762817362 |
| 41 | 0.986958905737095 | 0.0260821885258094 | 0.0130410942629047 |
| 42 | 0.988969905020134 | 0.0220601899597327 | 0.0110300949798664 |
| 43 | 0.99408001244173 | 0.0118399751165406 | 0.00591998755827029 |
| 44 | 0.99569715097159 | 0.00860569805682074 | 0.00430284902841037 |
| 45 | 0.997524003708532 | 0.00495199258293566 | 0.00247599629146783 |
| 46 | 0.994886608407866 | 0.0102267831842679 | 0.00511339159213394 |
| 47 | 0.988241252890633 | 0.0235174942187335 | 0.0117587471093668 |
| 48 | 0.998124094407419 | 0.00375181118516282 | 0.00187590559258141 |
| 49 | 0.994524481637325 | 0.0109510367253506 | 0.00547551836267531 |
| 50 | 0.985074422405388 | 0.0298511551892250 | 0.0149255775946125 |
| 51 | 0.990725625532677 | 0.0185487489346465 | 0.00927437446732326 |
| 52 | 0.982491824492996 | 0.0350163510140072 | 0.0175081755070036 |
| 53 | 0.996330687444683 | 0.00733862511063342 | 0.00366931255531671 |
| Meta Analysis of Goldfeld-Quandt test for Heteroskedasticity | |||
| Description | # significant tests | % significant tests | OK/NOK |
| 1% type I error level | 4 | 0.0851063829787234 | NOK |
| 5% type I error level | 15 | 0.319148936170213 | NOK |
| 10% type I error level | 16 | 0.340425531914894 | NOK |