| Multiple Linear Regression - Estimated Regression Equation |
| PS[t] = + 3.59872798429118 + 0.00168586791515148L[t] + 0.00505019021635358Wb[t] -0.00416766197027056Wbr[t] -0.00249985220101987Tg[t] + 0.76674401969889P[t] + 0.337375889226130S[t] -1.58803585821715D[t] + e[t] |
| Multiple Linear Regression - Ordinary Least Squares | |||||
| Variable | Parameter | S.D. | T-STAT H0: parameter = 0 | 2-tail p-value | 1-tail p-value |
| (Intercept) | 3.59872798429118 | 0.458456 | 7.8497 | 0 | 0 |
| L | 0.00168586791515148 | 0.01215 | 0.1388 | 0.890543 | 0.445272 |
| Wb | 0.00505019021635358 | 0.002685 | 1.881 | 0.069392 | 0.034696 |
| Wbr | -0.00416766197027056 | 0.002095 | -1.9891 | 0.055574 | 0.027787 |
| Tg | -0.00249985220101987 | 0.002119 | -1.1798 | 0.247043 | 0.123522 |
| P | 0.76674401969889 | 0.371081 | 2.0662 | 0.047248 | 0.023624 |
| S | 0.337375889226130 | 0.227942 | 1.4801 | 0.14894 | 0.07447 |
| D | -1.58803585821715 | 0.451945 | -3.5138 | 0.001381 | 0.000691 |
| Multiple Linear Regression - Regression Statistics | |
| Multiple R | 0.760192943827821 |
| R-squared | 0.577893311845608 |
| Adjusted R-squared | 0.482578898391391 |
| F-TEST (value) | 6.06302122525454 |
| F-TEST (DF numerator) | 7 |
| F-TEST (DF denominator) | 31 |
| p-value | 0.000164664347328203 |
| Multiple Linear Regression - Residual Statistics | |
| Residual Standard Deviation | 1.01105803783479 |
| Sum Squared Residuals | 31.6893890319806 |
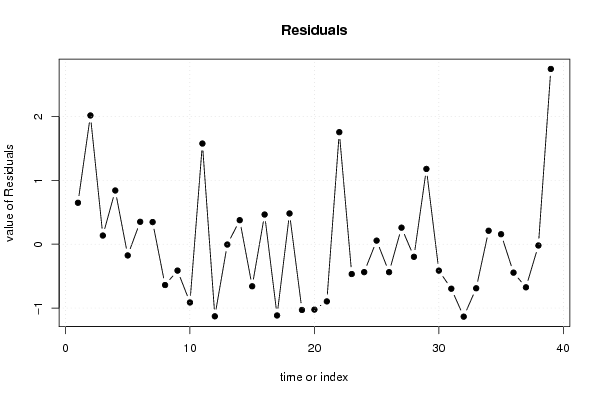
| Multiple Linear Regression - Actuals, Interpolation, and Residuals | |||
| Time or Index | Actuals | Interpolation Forecast | Residuals Prediction Error |
| 1 | 2 | 1.35069752756234 | 0.649302472437659 |
| 2 | 1.8 | -0.216207744209152 | 2.01620774420915 |
| 3 | 0.7 | 0.563982162379354 | 0.136017837620646 |
| 4 | 3.9 | 3.05821455413513 | 0.841785445864872 |
| 5 | 1 | 1.17544395981045 | -0.175443959810451 |
| 6 | 3.6 | 3.2486928966072 | 0.351307103392802 |
| 7 | 1.4 | 1.05297804885339 | 0.347021951146607 |
| 8 | 1.5 | 2.13876619473371 | -0.638766194733706 |
| 9 | 0.7 | 1.11268324397845 | -0.412683243978452 |
| 10 | 2.1 | 3.01192988255520 | -0.911929882555202 |
| 11 | 4.1 | 2.52331125219375 | 1.57668874780625 |
| 12 | 1.2 | 2.32861857609403 | -1.12861857609403 |
| 13 | 0.5 | 0.505011669859396 | -0.00501166985939576 |
| 14 | 3.4 | 3.02327982668814 | 0.376720173311857 |
| 15 | 1.5 | 2.15850624370848 | -0.658506243708485 |
| 16 | 3.4 | 2.93473276829888 | 0.465267231701118 |
| 17 | 0.8 | 1.91529918247594 | -1.11529918247594 |
| 18 | 0.8 | 0.318078334577814 | 0.481921665422186 |
| 19 | 2 | 3.02928884132129 | -1.02928884132129 |
| 20 | 1.9 | 2.92354876845506 | -1.02354876845506 |
| 21 | 1.3 | 2.19531905275739 | -0.89531905275739 |
| 22 | 5.6 | 3.84508157647254 | 1.75491842352746 |
| 23 | 3.1 | 3.56688841121648 | -0.46688841121648 |
| 24 | 1.8 | 2.23688869232548 | -0.436888692325475 |
| 25 | 0.9 | 0.843364620417757 | 0.0566353795822429 |
| 26 | 1.8 | 2.23719509072015 | -0.43719509072015 |
| 27 | 1.9 | 1.64055698460565 | 0.259443015394354 |
| 28 | 0.9 | 1.09713706907745 | -0.197137069077445 |
| 29 | 2.6 | 1.42073377026236 | 1.17926622973764 |
| 30 | 2.4 | 2.81315888846639 | -0.413158888466388 |
| 31 | 1.2 | 1.89652622234123 | -0.696526222341228 |
| 32 | 0.9 | 2.03400611490253 | -1.13400611490253 |
| 33 | 0.5 | 1.18993256893983 | -0.689932568939826 |
| 34 | 0.6 | 0.388857721098003 | 0.211142278901997 |
| 35 | 2.3 | 2.14315765532168 | 0.156842344678316 |
| 36 | 0.5 | 0.944990363911647 | -0.444990363911647 |
| 37 | 2.6 | 3.27454663423543 | -0.674546634235432 |
| 38 | 0.6 | 0.619656532235708 | -0.0196565322357083 |
| 39 | 6.6 | 3.85514584061345 | 2.74485415938655 |
| Goldfeld-Quandt test for Heteroskedasticity | |||
| p-values | Alternative Hypothesis | ||
| breakpoint index | greater | 2-sided | less |
| 11 | 0.672923508163732 | 0.654152983672536 | 0.327076491836268 |
| 12 | 0.703495726987896 | 0.593008546024208 | 0.296504273012104 |
| 13 | 0.589512707520595 | 0.82097458495881 | 0.410487292479405 |
| 14 | 0.470066717750977 | 0.940133435501953 | 0.529933282249023 |
| 15 | 0.340033762670261 | 0.680067525340523 | 0.659966237329739 |
| 16 | 0.227062090430669 | 0.454124180861338 | 0.772937909569331 |
| 17 | 0.298303720749728 | 0.596607441499455 | 0.701696279250272 |
| 18 | 0.221082243861389 | 0.442164487722778 | 0.778917756138611 |
| 19 | 0.361152509222240 | 0.722305018444481 | 0.63884749077776 |
| 20 | 0.392827392664717 | 0.785654785329433 | 0.607172607335283 |
| 21 | 0.59839973469537 | 0.80320053060926 | 0.40160026530463 |
| 22 | 0.714849093511422 | 0.570301812977155 | 0.285150906488578 |
| 23 | 0.668462616916172 | 0.663074766167655 | 0.331537383083828 |
| 24 | 0.568769685981136 | 0.862460628037729 | 0.431230314018864 |
| 25 | 0.44699722652661 | 0.89399445305322 | 0.55300277347339 |
| 26 | 0.387893336191455 | 0.775786672382911 | 0.612106663808545 |
| 27 | 0.420817458966094 | 0.841634917932187 | 0.579182541033906 |
| 28 | 0.281468940040543 | 0.562937880081086 | 0.718531059959457 |
| Meta Analysis of Goldfeld-Quandt test for Heteroskedasticity | |||
| Description | # significant tests | % significant tests | OK/NOK |
| 1% type I error level | 0 | 0 | OK |
| 5% type I error level | 0 | 0 | OK |
| 10% type I error level | 0 | 0 | OK |