| Multiple Linear Regression - Estimated Regression Equation |
| PS[t] = -224.797977596438 -0.000235682027927057Wbo[t] + 0.000199220263264062Wbr[t] + 0.178340090407748Lifeyears[t] -0.167908843596768Gestation[t] -44.4794213593373Predation[t] -121.269232984052Sleep_exposure[t] + 177.683241346138overall_danger[t] + e[t] |
| Multiple Linear Regression - Ordinary Least Squares | |||||
| Variable | Parameter | S.D. | T-STAT H0: parameter = 0 | 2-tail p-value | 1-tail p-value |
| (Intercept) | -224.797977596438 | 116.527909 | -1.9291 | 0.058976 | 0.029488 |
| Wbo | -0.000235682027927057 | 0.00016 | -1.4697 | 0.147459 | 0.07373 |
| Wbr | 0.000199220263264062 | 0.000161 | 1.2363 | 0.221702 | 0.110851 |
| Lifeyears | 0.178340090407748 | 0.211316 | 0.844 | 0.40242 | 0.20121 |
| Gestation | -0.167908843596768 | 0.189422 | -0.8864 | 0.379318 | 0.189659 |
| Predation | -44.4794213593373 | 96.446191 | -0.4612 | 0.646519 | 0.323259 |
| Sleep_exposure | -121.269232984052 | 60.885986 | -1.9917 | 0.051467 | 0.025733 |
| overall_danger | 177.683241346138 | 123.277385 | 1.4413 | 0.155266 | 0.077633 |
| Multiple Linear Regression - Regression Statistics | |
| Multiple R | 0.398342798198946 |
| R-squared | 0.158676984876966 |
| Adjusted R-squared | 0.049616594027684 |
| F-TEST (value) | 1.45494604999401 |
| F-TEST (DF numerator) | 7 |
| F-TEST (DF denominator) | 54 |
| p-value | 0.203183241774995 |
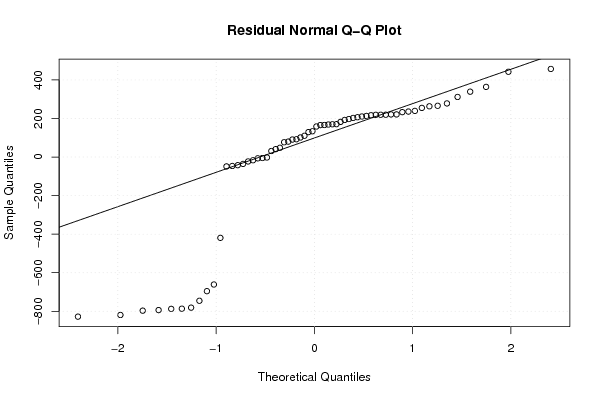
| Multiple Linear Regression - Residual Statistics | |
| Residual Standard Deviation | 388.676692498816 |
| Sum Squared Residuals | 8157756.84975824 |
| Multiple Linear Regression - Actuals, Interpolation, and Residuals | |||
| Time or Index | Actuals | Interpolation Forecast | Residuals Prediction Error |
| 1 | -999 | -963.23202924879 | -35.7679707512100 |
| 2 | 2 | 48.373780065298 | -46.3737800652980 |
| 3 | -999 | -212.373641893069 | -786.626358106931 |
| 4 | -999 | -337.907959056934 | -661.092040943066 |
| 5 | 1.8 | -29.5903467021456 | 31.3903467021456 |
| 6 | 0.7 | -169.194447130584 | 169.894447130584 |
| 7 | 3.9 | -215.351684056437 | 219.251684056437 |
| 8 | 1 | -362.768490487736 | 363.768490487736 |
| 9 | 3.6 | -335.39507014552 | 338.99507014552 |
| 10 | 1.4 | -167.201678841046 | 168.601678841046 |
| 11 | 1.5 | -237.821551274737 | 239.321551274737 |
| 12 | 0.7 | -232.279196546538 | 232.979196546538 |
| 13 | 2.7 | -89.6023871643393 | 92.3023871643393 |
| 14 | -999 | -179.900983996716 | -819.099016003284 |
| 15 | 2.1 | -219.052325068562 | 221.152325068562 |
| 16 | 0 | -192.439786193443 | 192.439786193443 |
| 17 | 4.1 | -206.213848568526 | 210.313848568526 |
| 18 | 1.2 | -218.227073702398 | 219.427073702398 |
| 19 | 1.3 | -157.174082802964 | 158.474082802964 |
| 20 | 6.1 | -41.8781555588987 | 47.9781555588987 |
| 21 | 0.3 | -216.501071243837 | 216.801071243837 |
| 22 | 0.5 | -170.017384243957 | 170.517384243957 |
| 23 | 3.4 | -125.930815129763 | 129.330815129763 |
| 24 | -999 | -579.878105474899 | -419.121894525101 |
| 25 | 1.5 | -455.428041183054 | 456.928041183054 |
| 26 | -999 | -205.308044890215 | -793.691955109785 |
| 27 | 3.4 | -37.7141228966307 | 41.1141228966307 |
| 28 | 0.8 | -109.481632499302 | 110.281632499302 |
| 29 | 0.8 | -205.639833984489 | 206.439833984489 |
| 30 | -999 | -217.950078388480 | -781.04992161152 |
| 31 | -999 | -253.576025809866 | -745.423974190134 |
| 32 | 1.4 | 17.8530858334797 | -16.4530858334797 |
| 33 | 2 | -216.978623155496 | 218.978623155496 |
| 34 | 1.9 | 8.49741898383276 | -6.59741898383276 |
| 35 | 2.4 | -439.944195541685 | 442.344195541685 |
| 36 | 2.8 | -130.877885504545 | 133.677885504545 |
| 37 | 1.3 | 6.44532254895981 | -5.14532254895981 |
| 38 | 2 | 4.38429732343694 | -2.38429732343694 |
| 39 | 5.6 | -257.611589413061 | 263.211589413061 |
| 40 | 3.1 | -275.005970851481 | 278.105970851481 |
| 41 | 1 | -196.098685614024 | 197.098685614024 |
| 42 | 1.8 | -219.208159656376 | 221.008159656376 |
| 43 | 0.9 | -181.448153174561 | 182.348153174561 |
| 44 | 1.8 | -78.3062936567644 | 80.1062936567644 |
| 45 | 1.9 | -200.945266132527 | 202.845266132527 |
| 46 | 0.9 | -165.298734991178 | 166.198734991178 |
| 47 | -999 | -202.264971714751 | -796.735028285249 |
| 48 | 2.6 | 51.2348145985303 | -48.6348145985303 |
| 49 | 2.4 | -210.804329694488 | 213.204329694488 |
| 50 | 1.2 | -310.505434968675 | 311.705434968675 |
| 51 | 0.9 | -235.009680290732 | 235.909680290732 |
| 52 | 0.5 | -101.099262642958 | 101.599262642958 |
| 53 | -999 | -171.211322206906 | -827.788677793094 |
| 54 | 0.6 | -165.129282636393 | 165.729282636393 |
| 55 | -999 | -211.615381914769 | -787.384618085231 |
| 56 | 2.2 | 44.4253392257145 | -42.2253392257145 |
| 57 | 2.3 | -88.4138102451983 | 90.7138102451983 |
| 58 | 0.5 | 23.2790765209106 | -22.7790765209106 |
| 59 | 2.6 | -252.223823400562 | 254.823823400562 |
| 60 | 0.6 | -76.2038240146257 | 76.8038240146257 |
| 61 | 6.6 | -259.206443563173 | 265.806443563173 |
| 62 | -999 | -303.452115931356 | -695.547884068644 |
| Goldfeld-Quandt test for Heteroskedasticity | |||
| p-values | Alternative Hypothesis | ||
| breakpoint index | greater | 2-sided | less |
| 11 | 0.801888922508332 | 0.396222154983336 | 0.198111077491668 |
| 12 | 0.673137787118209 | 0.653724425763583 | 0.326862212881791 |
| 13 | 0.574807734560411 | 0.850384530879178 | 0.425192265439589 |
| 14 | 0.884317864451818 | 0.231364271096365 | 0.115682135548182 |
| 15 | 0.832997862875202 | 0.334004274249597 | 0.167002137124798 |
| 16 | 0.761181340194212 | 0.477637319611576 | 0.238818659805788 |
| 17 | 0.684503595783213 | 0.630992808433575 | 0.315496404216787 |
| 18 | 0.614208135252041 | 0.771583729495919 | 0.385791864747959 |
| 19 | 0.626717251914011 | 0.746565496171979 | 0.373282748085989 |
| 20 | 0.553650045098432 | 0.892699909803136 | 0.446349954901568 |
| 21 | 0.47408866149845 | 0.9481773229969 | 0.52591133850155 |
| 22 | 0.389911026383028 | 0.779822052766057 | 0.610088973616971 |
| 23 | 0.341126582547975 | 0.68225316509595 | 0.658873417452025 |
| 24 | 0.367492463336919 | 0.734984926673837 | 0.632507536663081 |
| 25 | 0.406889952080144 | 0.813779904160288 | 0.593110047919856 |
| 26 | 0.641724846384116 | 0.716550307231767 | 0.358275153615884 |
| 27 | 0.568109076207282 | 0.863781847585435 | 0.431890923792718 |
| 28 | 0.485765408243362 | 0.971530816486724 | 0.514234591756638 |
| 29 | 0.40507037313195 | 0.8101407462639 | 0.59492962686805 |
| 30 | 0.639557076490597 | 0.720885847018807 | 0.360442923509403 |
| 31 | 0.79650598342529 | 0.406988033149419 | 0.203494016574709 |
| 32 | 0.735757595051537 | 0.528484809896927 | 0.264242404948463 |
| 33 | 0.683594947097537 | 0.632810105804925 | 0.316405052902463 |
| 34 | 0.606887254812848 | 0.786225490374304 | 0.393112745187152 |
| 35 | 0.625690550924523 | 0.748618898150954 | 0.374309449075477 |
| 36 | 0.572597251502355 | 0.85480549699529 | 0.427402748497645 |
| 37 | 0.486867344462906 | 0.973734688925811 | 0.513132655537094 |
| 38 | 0.401592341278907 | 0.803184682557815 | 0.598407658721092 |
| 39 | 0.34669714330261 | 0.69339428660522 | 0.65330285669739 |
| 40 | 0.307551917478212 | 0.615103834956425 | 0.692448082521788 |
| 41 | 0.260293124575068 | 0.520586249150136 | 0.739706875424932 |
| 42 | 0.217586882481224 | 0.435173764962448 | 0.782413117518776 |
| 43 | 0.166889338950296 | 0.333778677900591 | 0.833110661049704 |
| 44 | 0.119107078535938 | 0.238214157071875 | 0.880892921464062 |
| 45 | 0.0872045261008273 | 0.174409052201655 | 0.912795473899173 |
| 46 | 0.195752775860494 | 0.391505551720989 | 0.804247224139506 |
| 47 | 0.310285026697057 | 0.620570053394113 | 0.689714973302943 |
| 48 | 0.232592546715942 | 0.465185093431884 | 0.767407453284058 |
| 49 | 0.155372592669991 | 0.310745185339982 | 0.844627407330009 |
| 50 | 0.0913350976532389 | 0.182670195306478 | 0.908664902346761 |
| 51 | 0.068321929500564 | 0.136643859001128 | 0.931678070499436 |
| Meta Analysis of Goldfeld-Quandt test for Heteroskedasticity | |||
| Description | # significant tests | % significant tests | OK/NOK |
| 1% type I error level | 0 | 0 | OK |
| 5% type I error level | 0 | 0 | OK |
| 10% type I error level | 0 | 0 | OK |