| Multiple Linear Regression - Estimated Regression Equation |
| PS[t] = + 5.12668438247934 -1.3625658984213Tg[t] -0.262599038929463D[t] + 0.00274104496919642Life[t] + e[t] |
| Multiple Linear Regression - Ordinary Least Squares | |||||
| Variable | Parameter | S.D. | T-STAT H0: parameter = 0 | 2-tail p-value | 1-tail p-value |
| (Intercept) | 5.12668438247934 | 0.758388 | 6.76 | 0 | 0 |
| Tg | -1.3625658984213 | 0.502298 | -2.7127 | 0.009794 | 0.004897 |
| D | -0.262599038929463 | 0.146239 | -1.7957 | 0.080102 | 0.040051 |
| Life | 0.00274104496919642 | 0.010316 | 0.2657 | 0.791825 | 0.395912 |
| Multiple Linear Regression - Regression Statistics | |
| Multiple R | 0.633624369611274 |
| R-squared | 0.401479841765285 |
| Adjusted R-squared | 0.356590829897681 |
| F-TEST (value) | 8.94383335835986 |
| F-TEST (DF numerator) | 3 |
| F-TEST (DF denominator) | 40 |
| p-value | 0.000117239349074039 |
| Multiple Linear Regression - Residual Statistics | |
| Residual Standard Deviation | 1.10976315016450 |
| Sum Squared Residuals | 49.2629699785212 |
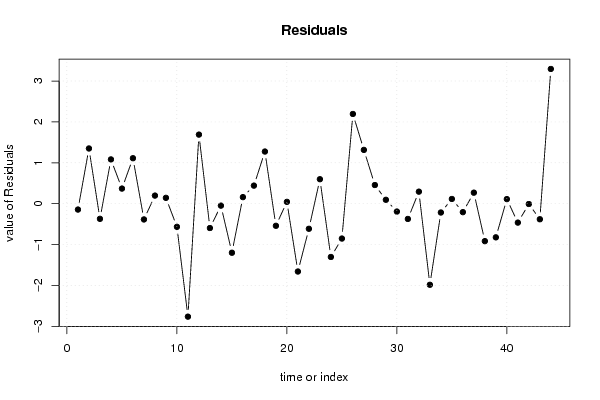
| Multiple Linear Regression - Actuals, Interpolation, and Residuals | |||
| Time or Index | Actuals | Interpolation Forecast | Residuals Prediction Error |
| 1 | 2 | 2.14386521260983 | -0.143865212609829 |
| 2 | 1.8 | 0.450235814056405 | 1.34976418594359 |
| 3 | 0.7 | 1.07089751049766 | -0.370897510497656 |
| 4 | 3.9 | 2.81781371439581 | 1.08218628560419 |
| 5 | 1 | 0.630570316913895 | 0.369429683086105 |
| 6 | 3.6 | 2.48821598552904 | 1.11178401447096 |
| 7 | 1.4 | 1.78548207173543 | -0.385482071735431 |
| 8 | 1.5 | 1.3022154497822 | 0.197784550217799 |
| 9 | 0.7 | 0.557634085775735 | 0.142365914224264 |
| 10 | 2.1 | 2.66632224549956 | -0.566322245499559 |
| 11 | 0 | 2.76281800036935 | -2.76281800036935 |
| 12 | 4.1 | 2.41057581899309 | 1.68942418100691 |
| 13 | 1.2 | 1.79585610358375 | -0.595856103583754 |
| 14 | 0.3 | 0.347767111074148 | -0.0477671110741478 |
| 15 | 0.5 | 1.69953920443012 | -1.19953920443012 |
| 16 | 3.4 | 3.23969634082418 | 0.160303659175817 |
| 17 | 1.5 | 1.05848102235897 | 0.441518977641031 |
| 18 | 3.4 | 2.12523707877337 | 1.27476292122663 |
| 19 | 0.8 | 1.34102553548694 | -0.541025535486941 |
| 20 | 0.8 | 0.755084572338637 | 0.0449154276613627 |
| 21 | 1.4 | 3.05899941556946 | -1.65899941556946 |
| 22 | 2 | 2.61350839549438 | -0.613508395494382 |
| 23 | 1.9 | 1.30195662944684 | 0.598043370553164 |
| 24 | 1.3 | 2.60357425961312 | -1.30357425961312 |
| 25 | 2 | 2.85296990382475 | -0.852969903824746 |
| 26 | 5.6 | 3.40621939810086 | 2.19378060189914 |
| 27 | 3.1 | 1.78516602820389 | 1.31483397179611 |
| 28 | 1 | 0.543802916202294 | 0.456197083797706 |
| 29 | 1.8 | 1.70486216264498 | 0.0951378373550226 |
| 30 | 0.9 | 1.09313538165976 | -0.193135381659759 |
| 31 | 1.8 | 2.17336671737338 | -0.373366717373382 |
| 32 | 1.9 | 1.60600972911138 | 0.293990270888622 |
| 33 | 0.9 | 2.88320096434768 | -1.98320096434768 |
| 34 | 2.6 | 2.81578223005952 | -0.215782230059522 |
| 35 | 2.4 | 2.28473520003390 | 0.115264799966096 |
| 36 | 1.2 | 1.40710693428658 | -0.207106934286576 |
| 37 | 0.9 | 0.630846641326348 | 0.269153358673652 |
| 38 | 0.5 | 1.41590271314554 | -0.915902713145539 |
| 39 | 0.6 | 1.42331450651645 | -0.823314506516447 |
| 40 | 2.3 | 2.18845370779189 | 0.111546292208115 |
| 41 | 0.5 | 0.962944497661474 | -0.462944497661474 |
| 42 | 2.6 | 2.60853035559967 | -0.00853035559967129 |
| 43 | 0.6 | 0.980920421684789 | -0.380920421684789 |
| 44 | 6.6 | 3.30535769527297 | 3.29464230472703 |
| Goldfeld-Quandt test for Heteroskedasticity | |||
| p-values | Alternative Hypothesis | ||
| breakpoint index | greater | 2-sided | less |
| 7 | 0.347445522586742 | 0.694891045173483 | 0.652554477413258 |
| 8 | 0.210136024232419 | 0.420272048464838 | 0.789863975767581 |
| 9 | 0.111249280270354 | 0.222498560540707 | 0.888750719729646 |
| 10 | 0.0604305784549499 | 0.120861156909900 | 0.93956942154505 |
| 11 | 0.501425547817538 | 0.997148904364923 | 0.498574452182462 |
| 12 | 0.63252622133349 | 0.734947557333021 | 0.367473778666510 |
| 13 | 0.65585358773525 | 0.6882928245295 | 0.34414641226475 |
| 14 | 0.563462055946055 | 0.87307588810789 | 0.436537944053945 |
| 15 | 0.625567315319933 | 0.748865369360134 | 0.374432684680067 |
| 16 | 0.536394458022379 | 0.927211083955241 | 0.463605541977621 |
| 17 | 0.445549706248772 | 0.891099412497544 | 0.554450293751228 |
| 18 | 0.481768839476544 | 0.963537678953087 | 0.518231160523456 |
| 19 | 0.414707211252209 | 0.829414422504419 | 0.58529278874779 |
| 20 | 0.323113764486509 | 0.646227528973018 | 0.676886235513491 |
| 21 | 0.417940312913463 | 0.835880625826926 | 0.582059687086537 |
| 22 | 0.356940655669173 | 0.713881311338346 | 0.643059344330827 |
| 23 | 0.309592465658818 | 0.619184931317636 | 0.690407534341182 |
| 24 | 0.350245489193956 | 0.700490978387911 | 0.649754510806044 |
| 25 | 0.353268431319503 | 0.706536862639006 | 0.646731568680497 |
| 26 | 0.568590481708235 | 0.86281903658353 | 0.431409518291765 |
| 27 | 0.576795866671606 | 0.846408266656787 | 0.423204133328394 |
| 28 | 0.540978822030239 | 0.918042355939522 | 0.459021177969761 |
| 29 | 0.444044771972699 | 0.888089543945397 | 0.555955228027301 |
| 30 | 0.349693173540174 | 0.699386347080348 | 0.650306826459826 |
| 31 | 0.367985495058213 | 0.735970990116425 | 0.632014504941787 |
| 32 | 0.313733924746165 | 0.62746784949233 | 0.686266075253835 |
| 33 | 0.612574378632506 | 0.774851242734988 | 0.387425621367494 |
| 34 | 0.8991230635521 | 0.201753872895802 | 0.100876936447901 |
| 35 | 0.880013721556343 | 0.239972556887314 | 0.119986278443657 |
| 36 | 0.797366392563532 | 0.405267214872936 | 0.202633607436468 |
| 37 | 0.651322269397083 | 0.697355461205834 | 0.348677730602917 |
| Meta Analysis of Goldfeld-Quandt test for Heteroskedasticity | |||
| Description | # significant tests | % significant tests | OK/NOK |
| 1% type I error level | 0 | 0 | OK |
| 5% type I error level | 0 | 0 | OK |
| 10% type I error level | 0 | 0 | OK |