Free Statistics

of Irreproducible Research!

Author's title

Author*The author of this computation has been verified*
R Software Modulerwasp_centraltendency.wasp
Title produced by softwareCentral Tendency
Date of computationTue, 14 Dec 2010 09:31:07 +0000
Cite this page as followsStatistical Computations at FreeStatistics.org, Office for Research Development and Education, URL https://freestatistics.org/blog/index.php?v=date/2010/Dec/14/t1292318982zar2qvmotcor7wb.htm/, Retrieved Thu, 02 May 2024 15:33:18 +0000
Statistical Computations at FreeStatistics.org, Office for Research Development and Education, URL https://freestatistics.org/blog/index.php?pk=109310, Retrieved Thu, 02 May 2024 15:33:18 +0000
QR Codes:

Original text written by user:
IsPrivate?No (this computation is public)
User-defined keywords
Estimated Impact178
Family? (F = Feedback message, R = changed R code, M = changed R Module, P = changed Parameters, D = changed Data)
-     [Univariate Data Series] [] [2010-10-06 14:13:06] [3d53bd477a917086cfdff0f854c5e476]
-   PD  [Univariate Data Series] [rozen] [2010-12-07 20:04:29] [b98453cac15ba1066b407e146608df68]
- RMPD      [Central Tendency] [Central tendency ...] [2010-12-14 09:31:07] [0605ea080d54454c99180f574351b8e4] [Current]
Feedback Forum

Post a new message
Dataseries X:
14573750
13992820
14727070
15685360
16736210
17950180
17002730
17415160
17929810
17865790
19202360
19085000
18188880
18466410
18520400
20025500
20636100
20672000
22589100
21864800
21319900
22548746
21325495
21556563
21415269
20401054
19062253
19085706
19279967
18552045
17800733
17142490
17593173
17633859
17336613
17008347
17951965
14520929
16941217
15436824
14744261
14248004
11540953
12881661
15185757
13554339
13575106
12238400
13303614
14151478
14172009
14022320


Summary of computational transaction
Raw Inputview raw input (R code)
Raw Outputview raw output of R engine
Computing time2 seconds
R Server'Sir Ronald Aylmer Fisher' @ 193.190.124.24

\begin{tabular}{lllllllll}
\hline
Summary of computational transaction \tabularnewline
Raw Input & view raw input (R code)  \tabularnewline
Raw Output & view raw output of R engine  \tabularnewline
Computing time & 2 seconds \tabularnewline
R Server & 'Sir Ronald Aylmer Fisher' @ 193.190.124.24 \tabularnewline
\hline
\end{tabular}
%Source: https://freestatistics.org/blog/index.php?pk=109310&T=0

[TABLE]
[ROW][C]Summary of computational transaction[/C][/ROW]
[ROW][C]Raw Input[/C][C]view raw input (R code) [/C][/ROW]
[ROW][C]Raw Output[/C][C]view raw output of R engine [/C][/ROW]
[ROW][C]Computing time[/C][C]2 seconds[/C][/ROW]
[ROW][C]R Server[/C][C]'Sir Ronald Aylmer Fisher' @ 193.190.124.24[/C][/ROW]
[/TABLE]
Source: https://freestatistics.org/blog/index.php?pk=109310&T=0

Globally Unique Identifier (entire table): ba.freestatistics.org/blog/index.php?pk=109310&T=0

As an alternative you can also use a QR Code:  

The GUIDs for individual cells are displayed in the table below:

Summary of computational transaction
Raw Inputview raw input (R code)
Raw Outputview raw output of R engine
Computing time2 seconds
R Server'Sir Ronald Aylmer Fisher' @ 193.190.124.24


Central Tendency - Ungrouped Data
MeasureValueS.E.Value/S.E.
Arithmetic Mean17320393.8461538397927.71429305643.5264828862816
Geometric Mean17081353.3133451
Harmonic Mean16837537.2780829
Quadratic Mean17551971.7622212
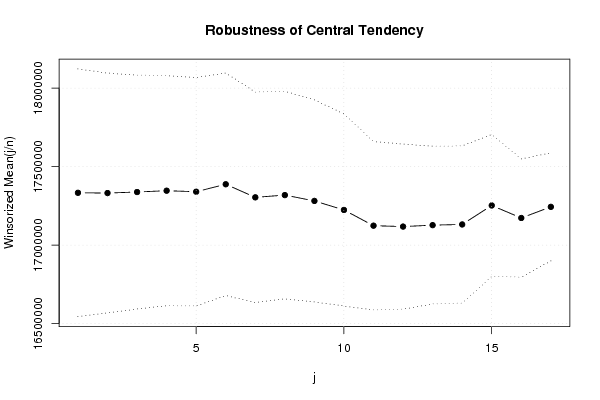
Winsorized Mean ( 1 / 17 )17333030.25394115.67899852843.9795501007326
Winsorized Mean ( 2 / 17 )17331465.4423077381665.43708276345.4100994179083
Winsorized Mean ( 3 / 17 )17338025.9807692372246.09915903346.5767835309457
Winsorized Mean ( 4 / 17 )17346443.75365843.24381531847.414962673895
Winsorized Mean ( 5 / 17 )17339808.4615385363568.59050506447.6933621725965
Winsorized Mean ( 6 / 17 )17387360.6538462354000.02073359549.1168351284677
Winsorized Mean ( 7 / 17 )17304114.5335128.90685007151.6342044696892
Winsorized Mean ( 8 / 17 )17318461.8846154330264.76991128752.4381146958766
Winsorized Mean ( 9 / 17 )17281334.2884615321718.26752345153.7157383741098
Winsorized Mean ( 10 / 17 )17223726.7884615305570.62510057856.3657805222358
Winsorized Mean ( 11 / 17 )17123752.0192308267818.06655484163.9380017916915
Winsorized Mean ( 12 / 17 )17118032.1730769262692.19775132265.1638393511851
Winsorized Mean ( 13 / 17 )17127198.6730769250956.76676288568.2476065260254
Winsorized Mean ( 14 / 17 )17131636.9423077250060.4810420868.5099735508578
Winsorized Mean ( 15 / 17 )17252429.9230769225662.68947903476.452292414426
Winsorized Mean ( 16 / 17 )17172694.2307692188007.89079012291.3402844880567
Winsorized Mean ( 17 / 17 )17243600.9038462171930.363520693100.294099022077
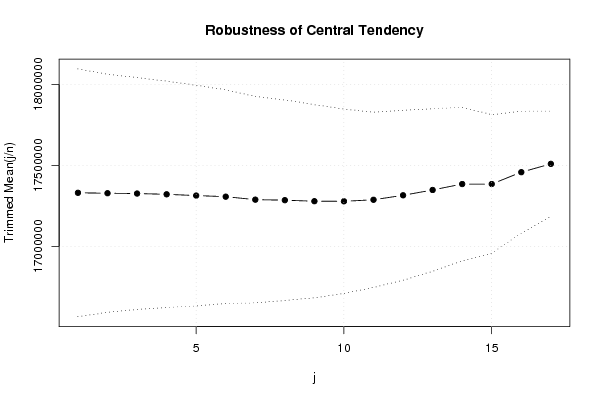
Trimmed Mean ( 1 / 17 )17330608.54382669.68186724845.2886898576203
Trimmed Mean ( 2 / 17 )17327985.0208333368055.3967279847.0798286749209
Trimmed Mean ( 3 / 17 )17326017.8260870357970.57274537948.4006763271315
Trimmed Mean ( 4 / 17 )17321287.3409091349552.44523872449.5527568948335
Trimmed Mean ( 5 / 17 )17313500.8333333340990.31271578450.7741721324622
Trimmed Mean ( 6 / 17 )17306660.85330259.16478104752.4032720226669
Trimmed Mean ( 7 / 17 )17288255.6315789318971.54098499454.1999940753092
Trimmed Mean ( 8 / 17 )17284983.1666667309805.35566198955.7930418269635
Trimmed Mean ( 9 / 17 )17278582.8235294298367.15489160357.9104721825254
Trimmed Mean ( 10 / 17 )17278086.03125284837.11577689860.6595316208134
Trimmed Mean ( 11 / 17 )17287508.3270696.80425967863.8629936813593
Trimmed Mean ( 12 / 17 )17315155.4642857262531.24309880565.9546469970778
Trimmed Mean ( 13 / 17 )17348009.3461538251153.08671508869.0734466896426
Trimmed Mean ( 14 / 17 )17384811.125237282.31751378273.2663575910592
Trimmed Mean ( 15 / 17 )17384811.125214091.54757321281.2026972669484
Trimmed Mean ( 16 / 17 )17457909.8188201.55783565292.76177094796
Trimmed Mean ( 17 / 17 )17509407.0555556162997.643858978107.421227945505
Median17613516
Midrange17065026.5
Midmean - Weighted Average at Xnp17245259
Midmean - Weighted Average at X(n+1)p17348009.3461538
Midmean - Empirical Distribution Function17245259
Midmean - Empirical Distribution Function - Averaging17348009.3461538
Midmean - Empirical Distribution Function - Interpolation17348009.3461538
Midmean - Closest Observation17245259
Midmean - True Basic - Statistics Graphics Toolkit17348009.3461538
Midmean - MS Excel (old versions)17315155.4642857
Number of observations52

\begin{tabular}{lllllllll}
\hline
Central Tendency - Ungrouped Data \tabularnewline
Measure & Value & S.E. & Value/S.E. \tabularnewline
Arithmetic Mean & 17320393.8461538 & 397927.714293056 & 43.5264828862816 \tabularnewline
Geometric Mean & 17081353.3133451 &  &  \tabularnewline
Harmonic Mean & 16837537.2780829 &  &  \tabularnewline
Quadratic Mean & 17551971.7622212 &  &  \tabularnewline
Winsorized Mean ( 1 / 17 ) & 17333030.25 & 394115.678998528 & 43.9795501007326 \tabularnewline
Winsorized Mean ( 2 / 17 ) & 17331465.4423077 & 381665.437082763 & 45.4100994179083 \tabularnewline
Winsorized Mean ( 3 / 17 ) & 17338025.9807692 & 372246.099159033 & 46.5767835309457 \tabularnewline
Winsorized Mean ( 4 / 17 ) & 17346443.75 & 365843.243815318 & 47.414962673895 \tabularnewline
Winsorized Mean ( 5 / 17 ) & 17339808.4615385 & 363568.590505064 & 47.6933621725965 \tabularnewline
Winsorized Mean ( 6 / 17 ) & 17387360.6538462 & 354000.020733595 & 49.1168351284677 \tabularnewline
Winsorized Mean ( 7 / 17 ) & 17304114.5 & 335128.906850071 & 51.6342044696892 \tabularnewline
Winsorized Mean ( 8 / 17 ) & 17318461.8846154 & 330264.769911287 & 52.4381146958766 \tabularnewline
Winsorized Mean ( 9 / 17 ) & 17281334.2884615 & 321718.267523451 & 53.7157383741098 \tabularnewline
Winsorized Mean ( 10 / 17 ) & 17223726.7884615 & 305570.625100578 & 56.3657805222358 \tabularnewline
Winsorized Mean ( 11 / 17 ) & 17123752.0192308 & 267818.066554841 & 63.9380017916915 \tabularnewline
Winsorized Mean ( 12 / 17 ) & 17118032.1730769 & 262692.197751322 & 65.1638393511851 \tabularnewline
Winsorized Mean ( 13 / 17 ) & 17127198.6730769 & 250956.766762885 & 68.2476065260254 \tabularnewline
Winsorized Mean ( 14 / 17 ) & 17131636.9423077 & 250060.48104208 & 68.5099735508578 \tabularnewline
Winsorized Mean ( 15 / 17 ) & 17252429.9230769 & 225662.689479034 & 76.452292414426 \tabularnewline
Winsorized Mean ( 16 / 17 ) & 17172694.2307692 & 188007.890790122 & 91.3402844880567 \tabularnewline
Winsorized Mean ( 17 / 17 ) & 17243600.9038462 & 171930.363520693 & 100.294099022077 \tabularnewline
Trimmed Mean ( 1 / 17 ) & 17330608.54 & 382669.681867248 & 45.2886898576203 \tabularnewline
Trimmed Mean ( 2 / 17 ) & 17327985.0208333 & 368055.39672798 & 47.0798286749209 \tabularnewline
Trimmed Mean ( 3 / 17 ) & 17326017.8260870 & 357970.572745379 & 48.4006763271315 \tabularnewline
Trimmed Mean ( 4 / 17 ) & 17321287.3409091 & 349552.445238724 & 49.5527568948335 \tabularnewline
Trimmed Mean ( 5 / 17 ) & 17313500.8333333 & 340990.312715784 & 50.7741721324622 \tabularnewline
Trimmed Mean ( 6 / 17 ) & 17306660.85 & 330259.164781047 & 52.4032720226669 \tabularnewline
Trimmed Mean ( 7 / 17 ) & 17288255.6315789 & 318971.540984994 & 54.1999940753092 \tabularnewline
Trimmed Mean ( 8 / 17 ) & 17284983.1666667 & 309805.355661989 & 55.7930418269635 \tabularnewline
Trimmed Mean ( 9 / 17 ) & 17278582.8235294 & 298367.154891603 & 57.9104721825254 \tabularnewline
Trimmed Mean ( 10 / 17 ) & 17278086.03125 & 284837.115776898 & 60.6595316208134 \tabularnewline
Trimmed Mean ( 11 / 17 ) & 17287508.3 & 270696.804259678 & 63.8629936813593 \tabularnewline
Trimmed Mean ( 12 / 17 ) & 17315155.4642857 & 262531.243098805 & 65.9546469970778 \tabularnewline
Trimmed Mean ( 13 / 17 ) & 17348009.3461538 & 251153.086715088 & 69.0734466896426 \tabularnewline
Trimmed Mean ( 14 / 17 ) & 17384811.125 & 237282.317513782 & 73.2663575910592 \tabularnewline
Trimmed Mean ( 15 / 17 ) & 17384811.125 & 214091.547573212 & 81.2026972669484 \tabularnewline
Trimmed Mean ( 16 / 17 ) & 17457909.8 & 188201.557835652 & 92.76177094796 \tabularnewline
Trimmed Mean ( 17 / 17 ) & 17509407.0555556 & 162997.643858978 & 107.421227945505 \tabularnewline
Median & 17613516 &  &  \tabularnewline
Midrange & 17065026.5 &  &  \tabularnewline
Midmean - Weighted Average at Xnp & 17245259 &  &  \tabularnewline
Midmean - Weighted Average at X(n+1)p & 17348009.3461538 &  &  \tabularnewline
Midmean - Empirical Distribution Function & 17245259 &  &  \tabularnewline
Midmean - Empirical Distribution Function - Averaging & 17348009.3461538 &  &  \tabularnewline
Midmean - Empirical Distribution Function - Interpolation & 17348009.3461538 &  &  \tabularnewline
Midmean - Closest Observation & 17245259 &  &  \tabularnewline
Midmean - True Basic - Statistics Graphics Toolkit & 17348009.3461538 &  &  \tabularnewline
Midmean - MS Excel (old versions) & 17315155.4642857 &  &  \tabularnewline
Number of observations & 52 &  &  \tabularnewline
\hline
\end{tabular}
%Source: https://freestatistics.org/blog/index.php?pk=109310&T=1

[TABLE]
[ROW][C]Central Tendency - Ungrouped Data[/C][/ROW]
[ROW][C]Measure[/C][C]Value[/C][C]S.E.[/C][C]Value/S.E.[/C][/ROW]
[ROW][C]Arithmetic Mean[/C][C]17320393.8461538[/C][C]397927.714293056[/C][C]43.5264828862816[/C][/ROW]
[ROW][C]Geometric Mean[/C][C]17081353.3133451[/C][C][/C][C][/C][/ROW]
[ROW][C]Harmonic Mean[/C][C]16837537.2780829[/C][C][/C][C][/C][/ROW]
[ROW][C]Quadratic Mean[/C][C]17551971.7622212[/C][C][/C][C][/C][/ROW]
[ROW][C]Winsorized Mean ( 1 / 17 )[/C][C]17333030.25[/C][C]394115.678998528[/C][C]43.9795501007326[/C][/ROW]
[ROW][C]Winsorized Mean ( 2 / 17 )[/C][C]17331465.4423077[/C][C]381665.437082763[/C][C]45.4100994179083[/C][/ROW]
[ROW][C]Winsorized Mean ( 3 / 17 )[/C][C]17338025.9807692[/C][C]372246.099159033[/C][C]46.5767835309457[/C][/ROW]
[ROW][C]Winsorized Mean ( 4 / 17 )[/C][C]17346443.75[/C][C]365843.243815318[/C][C]47.414962673895[/C][/ROW]
[ROW][C]Winsorized Mean ( 5 / 17 )[/C][C]17339808.4615385[/C][C]363568.590505064[/C][C]47.6933621725965[/C][/ROW]
[ROW][C]Winsorized Mean ( 6 / 17 )[/C][C]17387360.6538462[/C][C]354000.020733595[/C][C]49.1168351284677[/C][/ROW]
[ROW][C]Winsorized Mean ( 7 / 17 )[/C][C]17304114.5[/C][C]335128.906850071[/C][C]51.6342044696892[/C][/ROW]
[ROW][C]Winsorized Mean ( 8 / 17 )[/C][C]17318461.8846154[/C][C]330264.769911287[/C][C]52.4381146958766[/C][/ROW]
[ROW][C]Winsorized Mean ( 9 / 17 )[/C][C]17281334.2884615[/C][C]321718.267523451[/C][C]53.7157383741098[/C][/ROW]
[ROW][C]Winsorized Mean ( 10 / 17 )[/C][C]17223726.7884615[/C][C]305570.625100578[/C][C]56.3657805222358[/C][/ROW]
[ROW][C]Winsorized Mean ( 11 / 17 )[/C][C]17123752.0192308[/C][C]267818.066554841[/C][C]63.9380017916915[/C][/ROW]
[ROW][C]Winsorized Mean ( 12 / 17 )[/C][C]17118032.1730769[/C][C]262692.197751322[/C][C]65.1638393511851[/C][/ROW]
[ROW][C]Winsorized Mean ( 13 / 17 )[/C][C]17127198.6730769[/C][C]250956.766762885[/C][C]68.2476065260254[/C][/ROW]
[ROW][C]Winsorized Mean ( 14 / 17 )[/C][C]17131636.9423077[/C][C]250060.48104208[/C][C]68.5099735508578[/C][/ROW]
[ROW][C]Winsorized Mean ( 15 / 17 )[/C][C]17252429.9230769[/C][C]225662.689479034[/C][C]76.452292414426[/C][/ROW]
[ROW][C]Winsorized Mean ( 16 / 17 )[/C][C]17172694.2307692[/C][C]188007.890790122[/C][C]91.3402844880567[/C][/ROW]
[ROW][C]Winsorized Mean ( 17 / 17 )[/C][C]17243600.9038462[/C][C]171930.363520693[/C][C]100.294099022077[/C][/ROW]
[ROW][C]Trimmed Mean ( 1 / 17 )[/C][C]17330608.54[/C][C]382669.681867248[/C][C]45.2886898576203[/C][/ROW]
[ROW][C]Trimmed Mean ( 2 / 17 )[/C][C]17327985.0208333[/C][C]368055.39672798[/C][C]47.0798286749209[/C][/ROW]
[ROW][C]Trimmed Mean ( 3 / 17 )[/C][C]17326017.8260870[/C][C]357970.572745379[/C][C]48.4006763271315[/C][/ROW]
[ROW][C]Trimmed Mean ( 4 / 17 )[/C][C]17321287.3409091[/C][C]349552.445238724[/C][C]49.5527568948335[/C][/ROW]
[ROW][C]Trimmed Mean ( 5 / 17 )[/C][C]17313500.8333333[/C][C]340990.312715784[/C][C]50.7741721324622[/C][/ROW]
[ROW][C]Trimmed Mean ( 6 / 17 )[/C][C]17306660.85[/C][C]330259.164781047[/C][C]52.4032720226669[/C][/ROW]
[ROW][C]Trimmed Mean ( 7 / 17 )[/C][C]17288255.6315789[/C][C]318971.540984994[/C][C]54.1999940753092[/C][/ROW]
[ROW][C]Trimmed Mean ( 8 / 17 )[/C][C]17284983.1666667[/C][C]309805.355661989[/C][C]55.7930418269635[/C][/ROW]
[ROW][C]Trimmed Mean ( 9 / 17 )[/C][C]17278582.8235294[/C][C]298367.154891603[/C][C]57.9104721825254[/C][/ROW]
[ROW][C]Trimmed Mean ( 10 / 17 )[/C][C]17278086.03125[/C][C]284837.115776898[/C][C]60.6595316208134[/C][/ROW]
[ROW][C]Trimmed Mean ( 11 / 17 )[/C][C]17287508.3[/C][C]270696.804259678[/C][C]63.8629936813593[/C][/ROW]
[ROW][C]Trimmed Mean ( 12 / 17 )[/C][C]17315155.4642857[/C][C]262531.243098805[/C][C]65.9546469970778[/C][/ROW]
[ROW][C]Trimmed Mean ( 13 / 17 )[/C][C]17348009.3461538[/C][C]251153.086715088[/C][C]69.0734466896426[/C][/ROW]
[ROW][C]Trimmed Mean ( 14 / 17 )[/C][C]17384811.125[/C][C]237282.317513782[/C][C]73.2663575910592[/C][/ROW]
[ROW][C]Trimmed Mean ( 15 / 17 )[/C][C]17384811.125[/C][C]214091.547573212[/C][C]81.2026972669484[/C][/ROW]
[ROW][C]Trimmed Mean ( 16 / 17 )[/C][C]17457909.8[/C][C]188201.557835652[/C][C]92.76177094796[/C][/ROW]
[ROW][C]Trimmed Mean ( 17 / 17 )[/C][C]17509407.0555556[/C][C]162997.643858978[/C][C]107.421227945505[/C][/ROW]
[ROW][C]Median[/C][C]17613516[/C][C][/C][C][/C][/ROW]
[ROW][C]Midrange[/C][C]17065026.5[/C][C][/C][C][/C][/ROW]
[ROW][C]Midmean - Weighted Average at Xnp[/C][C]17245259[/C][C][/C][C][/C][/ROW]
[ROW][C]Midmean - Weighted Average at X(n+1)p[/C][C]17348009.3461538[/C][C][/C][C][/C][/ROW]
[ROW][C]Midmean - Empirical Distribution Function[/C][C]17245259[/C][C][/C][C][/C][/ROW]
[ROW][C]Midmean - Empirical Distribution Function - Averaging[/C][C]17348009.3461538[/C][C][/C][C][/C][/ROW]
[ROW][C]Midmean - Empirical Distribution Function - Interpolation[/C][C]17348009.3461538[/C][C][/C][C][/C][/ROW]
[ROW][C]Midmean - Closest Observation[/C][C]17245259[/C][C][/C][C][/C][/ROW]
[ROW][C]Midmean - True Basic - Statistics Graphics Toolkit[/C][C]17348009.3461538[/C][C][/C][C][/C][/ROW]
[ROW][C]Midmean - MS Excel (old versions)[/C][C]17315155.4642857[/C][C][/C][C][/C][/ROW]
[ROW][C]Number of observations[/C][C]52[/C][C][/C][C][/C][/ROW]
[/TABLE]
Source: https://freestatistics.org/blog/index.php?pk=109310&T=1

Globally Unique Identifier (entire table): ba.freestatistics.org/blog/index.php?pk=109310&T=1

As an alternative you can also use a QR Code:  

The GUIDs for individual cells are displayed in the table below:

Central Tendency - Ungrouped Data
MeasureValueS.E.Value/S.E.
Arithmetic Mean17320393.8461538397927.71429305643.5264828862816
Geometric Mean17081353.3133451
Harmonic Mean16837537.2780829
Quadratic Mean17551971.7622212
Winsorized Mean ( 1 / 17 )17333030.25394115.67899852843.9795501007326
Winsorized Mean ( 2 / 17 )17331465.4423077381665.43708276345.4100994179083
Winsorized Mean ( 3 / 17 )17338025.9807692372246.09915903346.5767835309457
Winsorized Mean ( 4 / 17 )17346443.75365843.24381531847.414962673895
Winsorized Mean ( 5 / 17 )17339808.4615385363568.59050506447.6933621725965
Winsorized Mean ( 6 / 17 )17387360.6538462354000.02073359549.1168351284677
Winsorized Mean ( 7 / 17 )17304114.5335128.90685007151.6342044696892
Winsorized Mean ( 8 / 17 )17318461.8846154330264.76991128752.4381146958766
Winsorized Mean ( 9 / 17 )17281334.2884615321718.26752345153.7157383741098
Winsorized Mean ( 10 / 17 )17223726.7884615305570.62510057856.3657805222358
Winsorized Mean ( 11 / 17 )17123752.0192308267818.06655484163.9380017916915
Winsorized Mean ( 12 / 17 )17118032.1730769262692.19775132265.1638393511851
Winsorized Mean ( 13 / 17 )17127198.6730769250956.76676288568.2476065260254
Winsorized Mean ( 14 / 17 )17131636.9423077250060.4810420868.5099735508578
Winsorized Mean ( 15 / 17 )17252429.9230769225662.68947903476.452292414426
Winsorized Mean ( 16 / 17 )17172694.2307692188007.89079012291.3402844880567
Winsorized Mean ( 17 / 17 )17243600.9038462171930.363520693100.294099022077
Trimmed Mean ( 1 / 17 )17330608.54382669.68186724845.2886898576203
Trimmed Mean ( 2 / 17 )17327985.0208333368055.3967279847.0798286749209
Trimmed Mean ( 3 / 17 )17326017.8260870357970.57274537948.4006763271315
Trimmed Mean ( 4 / 17 )17321287.3409091349552.44523872449.5527568948335
Trimmed Mean ( 5 / 17 )17313500.8333333340990.31271578450.7741721324622
Trimmed Mean ( 6 / 17 )17306660.85330259.16478104752.4032720226669
Trimmed Mean ( 7 / 17 )17288255.6315789318971.54098499454.1999940753092
Trimmed Mean ( 8 / 17 )17284983.1666667309805.35566198955.7930418269635
Trimmed Mean ( 9 / 17 )17278582.8235294298367.15489160357.9104721825254
Trimmed Mean ( 10 / 17 )17278086.03125284837.11577689860.6595316208134
Trimmed Mean ( 11 / 17 )17287508.3270696.80425967863.8629936813593
Trimmed Mean ( 12 / 17 )17315155.4642857262531.24309880565.9546469970778
Trimmed Mean ( 13 / 17 )17348009.3461538251153.08671508869.0734466896426
Trimmed Mean ( 14 / 17 )17384811.125237282.31751378273.2663575910592
Trimmed Mean ( 15 / 17 )17384811.125214091.54757321281.2026972669484
Trimmed Mean ( 16 / 17 )17457909.8188201.55783565292.76177094796
Trimmed Mean ( 17 / 17 )17509407.0555556162997.643858978107.421227945505
Median17613516
Midrange17065026.5
Midmean - Weighted Average at Xnp17245259
Midmean - Weighted Average at X(n+1)p17348009.3461538
Midmean - Empirical Distribution Function17245259
Midmean - Empirical Distribution Function - Averaging17348009.3461538
Midmean - Empirical Distribution Function - Interpolation17348009.3461538
Midmean - Closest Observation17245259
Midmean - True Basic - Statistics Graphics Toolkit17348009.3461538
Midmean - MS Excel (old versions)17315155.4642857
Number of observations52


Parameters (Session):
par1 = 0 ; par2 = 0 ;
Parameters (R input):
R code (references can be found in the software module):
geomean <- function(x) {
return(exp(mean(log(x))))
}
harmean <- function(x) {
return(1/mean(1/x))
}
quamean <- function(x) {
return(sqrt(mean(x*x)))
}
winmean <- function(x) {
x <-sort(x[!is.na(x)])
n<-length(x)
denom <- 3
nodenom <- n/denom
if (nodenom>40) denom <- n/40
sqrtn = sqrt(n)
roundnodenom = floor(nodenom)
win <- array(NA,dim=c(roundnodenom,2))
for (j in 1:roundnodenom) {
win[j,1] <- (j*x[j+1]+sum(x[(j+1):(n-j)])+j*x[n-j])/n
win[j,2] <- sd(c(rep(x[j+1],j),x[(j+1):(n-j)],rep(x[n-j],j)))/sqrtn
}
return(win)
}
trimean <- function(x) {
x <-sort(x[!is.na(x)])
n<-length(x)
denom <- 3
nodenom <- n/denom
if (nodenom>40) denom <- n/40
sqrtn = sqrt(n)
roundnodenom = floor(nodenom)
tri <- array(NA,dim=c(roundnodenom,2))
for (j in 1:roundnodenom) {
tri[j,1] <- mean(x,trim=j/n)
tri[j,2] <- sd(x[(j+1):(n-j)]) / sqrt(n-j*2)
}
return(tri)
}
midrange <- function(x) {
return((max(x)+min(x))/2)
}
q1 <- function(data,n,p,i,f) {
np <- n*p;
i <<- floor(np)
f <<- np - i
qvalue <- (1-f)*data[i] + f*data[i+1]
}
q2 <- function(data,n,p,i,f) {
np <- (n+1)*p
i <<- floor(np)
f <<- np - i
qvalue <- (1-f)*data[i] + f*data[i+1]
}
q3 <- function(data,n,p,i,f) {
np <- n*p
i <<- floor(np)
f <<- np - i
if (f==0) {
qvalue <- data[i]
} else {
qvalue <- data[i+1]
}
}
q4 <- function(data,n,p,i,f) {
np <- n*p
i <<- floor(np)
f <<- np - i
if (f==0) {
qvalue <- (data[i]+data[i+1])/2
} else {
qvalue <- data[i+1]
}
}
q5 <- function(data,n,p,i,f) {
np <- (n-1)*p
i <<- floor(np)
f <<- np - i
if (f==0) {
qvalue <- data[i+1]
} else {
qvalue <- data[i+1] + f*(data[i+2]-data[i+1])
}
}
q6 <- function(data,n,p,i,f) {
np <- n*p+0.5
i <<- floor(np)
f <<- np - i
qvalue <- data[i]
}
q7 <- function(data,n,p,i,f) {
np <- (n+1)*p
i <<- floor(np)
f <<- np - i
if (f==0) {
qvalue <- data[i]
} else {
qvalue <- f*data[i] + (1-f)*data[i+1]
}
}
q8 <- function(data,n,p,i,f) {
np <- (n+1)*p
i <<- floor(np)
f <<- np - i
if (f==0) {
qvalue <- data[i]
} else {
if (f == 0.5) {
qvalue <- (data[i]+data[i+1])/2
} else {
if (f < 0.5) {
qvalue <- data[i]
} else {
qvalue <- data[i+1]
}
}
}
}
midmean <- function(x,def) {
x <-sort(x[!is.na(x)])
n<-length(x)
if (def==1) {
qvalue1 <- q1(x,n,0.25,i,f)
qvalue3 <- q1(x,n,0.75,i,f)
}
if (def==2) {
qvalue1 <- q2(x,n,0.25,i,f)
qvalue3 <- q2(x,n,0.75,i,f)
}
if (def==3) {
qvalue1 <- q3(x,n,0.25,i,f)
qvalue3 <- q3(x,n,0.75,i,f)
}
if (def==4) {
qvalue1 <- q4(x,n,0.25,i,f)
qvalue3 <- q4(x,n,0.75,i,f)
}
if (def==5) {
qvalue1 <- q5(x,n,0.25,i,f)
qvalue3 <- q5(x,n,0.75,i,f)
}
if (def==6) {
qvalue1 <- q6(x,n,0.25,i,f)
qvalue3 <- q6(x,n,0.75,i,f)
}
if (def==7) {
qvalue1 <- q7(x,n,0.25,i,f)
qvalue3 <- q7(x,n,0.75,i,f)
}
if (def==8) {
qvalue1 <- q8(x,n,0.25,i,f)
qvalue3 <- q8(x,n,0.75,i,f)
}
midm <- 0
myn <- 0
roundno4 <- round(n/4)
round3no4 <- round(3*n/4)
for (i in 1:n) {
if ((x[i]>=qvalue1) & (x[i]<=qvalue3)){
midm = midm + x[i]
myn = myn + 1
}
}
midm = midm / myn
return(midm)
}
(arm <- mean(x))
sqrtn <- sqrt(length(x))
(armse <- sd(x) / sqrtn)
(armose <- arm / armse)
(geo <- geomean(x))
(har <- harmean(x))
(qua <- quamean(x))
(win <- winmean(x))
(tri <- trimean(x))
(midr <- midrange(x))
midm <- array(NA,dim=8)
for (j in 1:8) midm[j] <- midmean(x,j)
midm
bitmap(file='test1.png')
lb <- win[,1] - 2*win[,2]
ub <- win[,1] + 2*win[,2]
if ((ylimmin == '') | (ylimmax == '')) plot(win[,1],type='b',main=main, xlab='j', pch=19, ylab='Winsorized Mean(j/n)', ylim=c(min(lb),max(ub))) else plot(win[,1],type='l',main=main, xlab='j', pch=19, ylab='Winsorized Mean(j/n)', ylim=c(ylimmin,ylimmax))
lines(ub,lty=3)
lines(lb,lty=3)
grid()
dev.off()
bitmap(file='test2.png')
lb <- tri[,1] - 2*tri[,2]
ub <- tri[,1] + 2*tri[,2]
if ((ylimmin == '') | (ylimmax == '')) plot(tri[,1],type='b',main=main, xlab='j', pch=19, ylab='Trimmed Mean(j/n)', ylim=c(min(lb),max(ub))) else plot(tri[,1],type='l',main=main, xlab='j', pch=19, ylab='Trimmed Mean(j/n)', ylim=c(ylimmin,ylimmax))
lines(ub,lty=3)
lines(lb,lty=3)
grid()
dev.off()
load(file='createtable')
a<-table.start()
a<-table.row.start(a)
a<-table.element(a,'Central Tendency - Ungrouped Data',4,TRUE)
a<-table.row.end(a)
a<-table.row.start(a)
a<-table.element(a,'Measure',header=TRUE)
a<-table.element(a,'Value',header=TRUE)
a<-table.element(a,'S.E.',header=TRUE)
a<-table.element(a,'Value/S.E.',header=TRUE)
a<-table.row.end(a)
a<-table.row.start(a)
a<-table.element(a,hyperlink('arithmetic_mean.htm', 'Arithmetic Mean', 'click to view the definition of the Arithmetic Mean'),header=TRUE)
a<-table.element(a,arm)
a<-table.element(a,hyperlink('arithmetic_mean_standard_error.htm', armse, 'click to view the definition of the Standard Error of the Arithmetic Mean'))
a<-table.element(a,armose)
a<-table.row.end(a)
a<-table.row.start(a)
a<-table.element(a,hyperlink('geometric_mean.htm', 'Geometric Mean', 'click to view the definition of the Geometric Mean'),header=TRUE)
a<-table.element(a,geo)
a<-table.element(a,'')
a<-table.row.end(a)
a<-table.row.start(a)
a<-table.element(a,hyperlink('harmonic_mean.htm', 'Harmonic Mean', 'click to view the definition of the Harmonic Mean'),header=TRUE)
a<-table.element(a,har)
a<-table.element(a,'')
a<-table.row.end(a)
a<-table.row.start(a)
a<-table.element(a,hyperlink('quadratic_mean.htm', 'Quadratic Mean', 'click to view the definition of the Quadratic Mean'),header=TRUE)
a<-table.element(a,qua)
a<-table.element(a,'')
a<-table.row.end(a)
for (j in 1:length(win[,1])) {
a<-table.row.start(a)
mylabel <- paste('Winsorized Mean (',j)
mylabel <- paste(mylabel,'/')
mylabel <- paste(mylabel,length(win[,1]))
mylabel <- paste(mylabel,')')
a<-table.element(a,hyperlink('winsorized_mean.htm', mylabel, 'click to view the definition of the Winsorized Mean'),header=TRUE)
a<-table.element(a,win[j,1])
a<-table.element(a,win[j,2])
a<-table.element(a,win[j,1]/win[j,2])
a<-table.row.end(a)
}
for (j in 1:length(tri[,1])) {
a<-table.row.start(a)
mylabel <- paste('Trimmed Mean (',j)
mylabel <- paste(mylabel,'/')
mylabel <- paste(mylabel,length(tri[,1]))
mylabel <- paste(mylabel,')')
a<-table.element(a,hyperlink('arithmetic_mean.htm', mylabel, 'click to view the definition of the Trimmed Mean'),header=TRUE)
a<-table.element(a,tri[j,1])
a<-table.element(a,tri[j,2])
a<-table.element(a,tri[j,1]/tri[j,2])
a<-table.row.end(a)
}
a<-table.row.start(a)
a<-table.element(a,hyperlink('median_1.htm', 'Median', 'click to view the definition of the Median'),header=TRUE)
a<-table.element(a,median(x))
a<-table.element(a,'')
a<-table.row.end(a)
a<-table.row.start(a)
a<-table.element(a,hyperlink('midrange.htm', 'Midrange', 'click to view the definition of the Midrange'),header=TRUE)
a<-table.element(a,midr)
a<-table.element(a,'')
a<-table.row.end(a)
a<-table.row.start(a)
mymid <- hyperlink('midmean.htm', 'Midmean', 'click to view the definition of the Midmean')
mylabel <- paste(mymid,hyperlink('method_1.htm','Weighted Average at Xnp',''),sep=' - ')
a<-table.element(a,mylabel,header=TRUE)
a<-table.element(a,midm[1])
a<-table.element(a,'')
a<-table.row.end(a)
a<-table.row.start(a)
mymid <- hyperlink('midmean.htm', 'Midmean', 'click to view the definition of the Midmean')
mylabel <- paste(mymid,hyperlink('method_2.htm','Weighted Average at X(n+1)p',''),sep=' - ')
a<-table.element(a,mylabel,header=TRUE)
a<-table.element(a,midm[2])
a<-table.element(a,'')
a<-table.row.end(a)
a<-table.row.start(a)
mymid <- hyperlink('midmean.htm', 'Midmean', 'click to view the definition of the Midmean')
mylabel <- paste(mymid,hyperlink('method_3.htm','Empirical Distribution Function',''),sep=' - ')
a<-table.element(a,mylabel,header=TRUE)
a<-table.element(a,midm[3])
a<-table.element(a,'')
a<-table.row.end(a)
a<-table.row.start(a)
mymid <- hyperlink('midmean.htm', 'Midmean', 'click to view the definition of the Midmean')
mylabel <- paste(mymid,hyperlink('method_4.htm','Empirical Distribution Function - Averaging',''),sep=' - ')
a<-table.element(a,mylabel,header=TRUE)
a<-table.element(a,midm[4])
a<-table.element(a,'')
a<-table.row.end(a)
a<-table.row.start(a)
mymid <- hyperlink('midmean.htm', 'Midmean', 'click to view the definition of the Midmean')
mylabel <- paste(mymid,hyperlink('method_5.htm','Empirical Distribution Function - Interpolation',''),sep=' - ')
a<-table.element(a,mylabel,header=TRUE)
a<-table.element(a,midm[5])
a<-table.element(a,'')
a<-table.row.end(a)
a<-table.row.start(a)
mymid <- hyperlink('midmean.htm', 'Midmean', 'click to view the definition of the Midmean')
mylabel <- paste(mymid,hyperlink('method_6.htm','Closest Observation',''),sep=' - ')
a<-table.element(a,mylabel,header=TRUE)
a<-table.element(a,midm[6])
a<-table.element(a,'')
a<-table.row.end(a)
a<-table.row.start(a)
mymid <- hyperlink('midmean.htm', 'Midmean', 'click to view the definition of the Midmean')
mylabel <- paste(mymid,hyperlink('method_7.htm','True Basic - Statistics Graphics Toolkit',''),sep=' - ')
a<-table.element(a,mylabel,header=TRUE)
a<-table.element(a,midm[7])
a<-table.element(a,'')
a<-table.row.end(a)
a<-table.row.start(a)
mymid <- hyperlink('midmean.htm', 'Midmean', 'click to view the definition of the Midmean')
mylabel <- paste(mymid,hyperlink('method_8.htm','MS Excel (old versions)',''),sep=' - ')
a<-table.element(a,mylabel,header=TRUE)
a<-table.element(a,midm[8])
a<-table.element(a,'')
a<-table.row.end(a)
a<-table.row.start(a)
a<-table.element(a,'Number of observations',header=TRUE)
a<-table.element(a,length(x))
a<-table.element(a,'')
a<-table.row.end(a)
a<-table.end(a)
table.save(a,file='mytable.tab')