Free Statistics

of Irreproducible Research!

Author's title

Author*The author of this computation has been verified*
R Software Modulerwasp_autocorrelation.wasp
Title produced by software(Partial) Autocorrelation Function
Date of computationTue, 14 Dec 2010 09:17:43 +0000
Cite this page as followsStatistical Computations at FreeStatistics.org, Office for Research Development and Education, URL https://freestatistics.org/blog/index.php?v=date/2010/Dec/14/t12923182988zyhvudi1kf32ib.htm/, Retrieved Thu, 02 May 2024 14:35:10 +0000
Statistical Computations at FreeStatistics.org, Office for Research Development and Education, URL https://freestatistics.org/blog/index.php?pk=109295, Retrieved Thu, 02 May 2024 14:35:10 +0000
QR Codes:

Original text written by user:
IsPrivate?No (this computation is public)
User-defined keywords
Estimated Impact183
Family? (F = Feedback message, R = changed R code, M = changed R Module, P = changed Parameters, D = changed Data)
-     [(Partial) Autocorrelation Function] [Faillissementen V...] [2010-12-14 08:51:21] [13c73ac943380855a1c72833078e44d2]
-   P   [(Partial) Autocorrelation Function] [Faillissementen V...] [2010-12-14 09:09:28] [13c73ac943380855a1c72833078e44d2]
-   P       [(Partial) Autocorrelation Function] [Faillissementen V...] [2010-12-14 09:17:43] [8e16b01a5be2b3f7f3ad6418d9d6fd5b] [Current]
Feedback Forum

Post a new message
Dataseries X:
356
386
444
387
327
448
225
182
460
411
342
361
377
331
428
340
352
461
221
198
422
329
320
375
364
351
380
319
322
386
221
187
344
342
365
313
356
337
389
326
343
357
220
218
391
425
332
298
360
336
325
393
301
426
265
210
429
440
357
431
442
442
544
420
396
482
261
211
448
468
464
425


Summary of computational transaction
Raw Inputview raw input (R code)
Raw Outputview raw output of R engine
Computing time2 seconds
R Server'Gwilym Jenkins' @ 72.249.127.135

\begin{tabular}{lllllllll}
\hline
Summary of computational transaction \tabularnewline
Raw Input & view raw input (R code)  \tabularnewline
Raw Output & view raw output of R engine  \tabularnewline
Computing time & 2 seconds \tabularnewline
R Server & 'Gwilym Jenkins' @ 72.249.127.135 \tabularnewline
\hline
\end{tabular}
%Source: https://freestatistics.org/blog/index.php?pk=109295&T=0

[TABLE]
[ROW][C]Summary of computational transaction[/C][/ROW]
[ROW][C]Raw Input[/C][C]view raw input (R code) [/C][/ROW]
[ROW][C]Raw Output[/C][C]view raw output of R engine [/C][/ROW]
[ROW][C]Computing time[/C][C]2 seconds[/C][/ROW]
[ROW][C]R Server[/C][C]'Gwilym Jenkins' @ 72.249.127.135[/C][/ROW]
[/TABLE]
Source: https://freestatistics.org/blog/index.php?pk=109295&T=0

Globally Unique Identifier (entire table): ba.freestatistics.org/blog/index.php?pk=109295&T=0

As an alternative you can also use a QR Code:  

The GUIDs for individual cells are displayed in the table below:

Summary of computational transaction
Raw Inputview raw input (R code)
Raw Outputview raw output of R engine
Computing time2 seconds
R Server'Gwilym Jenkins' @ 72.249.127.135


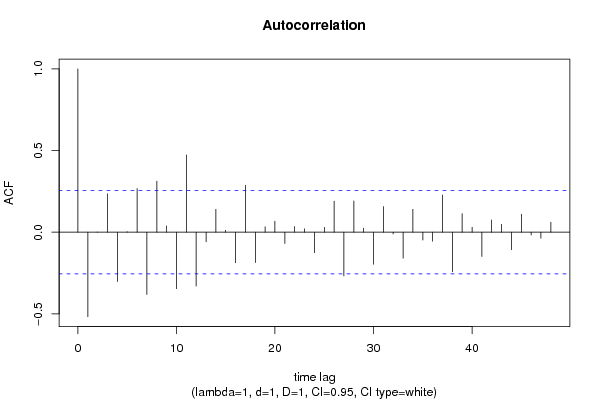
Autocorrelation Function
Time lag kACF(k)T-STATP-value
1-0.517008-3.97129.8e-05
20.0008780.00670.49732
30.2353091.80740.037896
4-0.302022-2.31990.011913
50.003660.02810.488833
60.2674642.05440.022186
7-0.380938-2.9260.002434
80.3124522.40.009785
90.0388530.29840.383209
10-0.345907-2.6570.005064
110.4735763.63760.00029
12-0.329533-2.53120.007026
13-0.058606-0.45020.327121
140.1401381.07640.14306
150.0124960.0960.46193
16-0.187359-1.43910.077699
170.2884262.21540.015301
18-0.185415-1.42420.079828
190.033190.25490.399828
200.0679270.52180.301896
21-0.068508-0.52620.300353
220.0357710.27480.39223
230.0213350.16390.435193
24-0.125262-0.96220.169949
250.0299910.23040.409302
260.1899471.4590.074933
27-0.267838-2.05730.022043
280.1919551.47440.07284
290.0246320.18920.425293
30-0.195368-1.50060.06939
310.157441.20930.115682
32-0.010588-0.08130.46773
33-0.158743-1.21930.113786
340.140061.07580.143194
35-0.048219-0.37040.356213
36-0.055214-0.42410.336514
370.2273971.74670.042949
38-0.242452-1.86230.033771
390.1132860.87020.193868
400.0305180.23440.407739
41-0.148316-1.13920.129604
420.0748260.57470.283823
430.0488660.37530.354374
44-0.107056-0.82230.207105
450.1103910.84790.199951
46-0.016675-0.12810.449261
47-0.036772-0.28240.389294
480.0612680.47060.319828

\begin{tabular}{lllllllll}
\hline
Autocorrelation Function \tabularnewline
Time lag k & ACF(k) & T-STAT & P-value \tabularnewline
1 & -0.517008 & -3.9712 & 9.8e-05 \tabularnewline
2 & 0.000878 & 0.0067 & 0.49732 \tabularnewline
3 & 0.235309 & 1.8074 & 0.037896 \tabularnewline
4 & -0.302022 & -2.3199 & 0.011913 \tabularnewline
5 & 0.00366 & 0.0281 & 0.488833 \tabularnewline
6 & 0.267464 & 2.0544 & 0.022186 \tabularnewline
7 & -0.380938 & -2.926 & 0.002434 \tabularnewline
8 & 0.312452 & 2.4 & 0.009785 \tabularnewline
9 & 0.038853 & 0.2984 & 0.383209 \tabularnewline
10 & -0.345907 & -2.657 & 0.005064 \tabularnewline
11 & 0.473576 & 3.6376 & 0.00029 \tabularnewline
12 & -0.329533 & -2.5312 & 0.007026 \tabularnewline
13 & -0.058606 & -0.4502 & 0.327121 \tabularnewline
14 & 0.140138 & 1.0764 & 0.14306 \tabularnewline
15 & 0.012496 & 0.096 & 0.46193 \tabularnewline
16 & -0.187359 & -1.4391 & 0.077699 \tabularnewline
17 & 0.288426 & 2.2154 & 0.015301 \tabularnewline
18 & -0.185415 & -1.4242 & 0.079828 \tabularnewline
19 & 0.03319 & 0.2549 & 0.399828 \tabularnewline
20 & 0.067927 & 0.5218 & 0.301896 \tabularnewline
21 & -0.068508 & -0.5262 & 0.300353 \tabularnewline
22 & 0.035771 & 0.2748 & 0.39223 \tabularnewline
23 & 0.021335 & 0.1639 & 0.435193 \tabularnewline
24 & -0.125262 & -0.9622 & 0.169949 \tabularnewline
25 & 0.029991 & 0.2304 & 0.409302 \tabularnewline
26 & 0.189947 & 1.459 & 0.074933 \tabularnewline
27 & -0.267838 & -2.0573 & 0.022043 \tabularnewline
28 & 0.191955 & 1.4744 & 0.07284 \tabularnewline
29 & 0.024632 & 0.1892 & 0.425293 \tabularnewline
30 & -0.195368 & -1.5006 & 0.06939 \tabularnewline
31 & 0.15744 & 1.2093 & 0.115682 \tabularnewline
32 & -0.010588 & -0.0813 & 0.46773 \tabularnewline
33 & -0.158743 & -1.2193 & 0.113786 \tabularnewline
34 & 0.14006 & 1.0758 & 0.143194 \tabularnewline
35 & -0.048219 & -0.3704 & 0.356213 \tabularnewline
36 & -0.055214 & -0.4241 & 0.336514 \tabularnewline
37 & 0.227397 & 1.7467 & 0.042949 \tabularnewline
38 & -0.242452 & -1.8623 & 0.033771 \tabularnewline
39 & 0.113286 & 0.8702 & 0.193868 \tabularnewline
40 & 0.030518 & 0.2344 & 0.407739 \tabularnewline
41 & -0.148316 & -1.1392 & 0.129604 \tabularnewline
42 & 0.074826 & 0.5747 & 0.283823 \tabularnewline
43 & 0.048866 & 0.3753 & 0.354374 \tabularnewline
44 & -0.107056 & -0.8223 & 0.207105 \tabularnewline
45 & 0.110391 & 0.8479 & 0.199951 \tabularnewline
46 & -0.016675 & -0.1281 & 0.449261 \tabularnewline
47 & -0.036772 & -0.2824 & 0.389294 \tabularnewline
48 & 0.061268 & 0.4706 & 0.319828 \tabularnewline
\hline
\end{tabular}
%Source: https://freestatistics.org/blog/index.php?pk=109295&T=1

[TABLE]
[ROW][C]Autocorrelation Function[/C][/ROW]
[ROW][C]Time lag k[/C][C]ACF(k)[/C][C]T-STAT[/C][C]P-value[/C][/ROW]
[ROW][C]1[/C][C]-0.517008[/C][C]-3.9712[/C][C]9.8e-05[/C][/ROW]
[ROW][C]2[/C][C]0.000878[/C][C]0.0067[/C][C]0.49732[/C][/ROW]
[ROW][C]3[/C][C]0.235309[/C][C]1.8074[/C][C]0.037896[/C][/ROW]
[ROW][C]4[/C][C]-0.302022[/C][C]-2.3199[/C][C]0.011913[/C][/ROW]
[ROW][C]5[/C][C]0.00366[/C][C]0.0281[/C][C]0.488833[/C][/ROW]
[ROW][C]6[/C][C]0.267464[/C][C]2.0544[/C][C]0.022186[/C][/ROW]
[ROW][C]7[/C][C]-0.380938[/C][C]-2.926[/C][C]0.002434[/C][/ROW]
[ROW][C]8[/C][C]0.312452[/C][C]2.4[/C][C]0.009785[/C][/ROW]
[ROW][C]9[/C][C]0.038853[/C][C]0.2984[/C][C]0.383209[/C][/ROW]
[ROW][C]10[/C][C]-0.345907[/C][C]-2.657[/C][C]0.005064[/C][/ROW]
[ROW][C]11[/C][C]0.473576[/C][C]3.6376[/C][C]0.00029[/C][/ROW]
[ROW][C]12[/C][C]-0.329533[/C][C]-2.5312[/C][C]0.007026[/C][/ROW]
[ROW][C]13[/C][C]-0.058606[/C][C]-0.4502[/C][C]0.327121[/C][/ROW]
[ROW][C]14[/C][C]0.140138[/C][C]1.0764[/C][C]0.14306[/C][/ROW]
[ROW][C]15[/C][C]0.012496[/C][C]0.096[/C][C]0.46193[/C][/ROW]
[ROW][C]16[/C][C]-0.187359[/C][C]-1.4391[/C][C]0.077699[/C][/ROW]
[ROW][C]17[/C][C]0.288426[/C][C]2.2154[/C][C]0.015301[/C][/ROW]
[ROW][C]18[/C][C]-0.185415[/C][C]-1.4242[/C][C]0.079828[/C][/ROW]
[ROW][C]19[/C][C]0.03319[/C][C]0.2549[/C][C]0.399828[/C][/ROW]
[ROW][C]20[/C][C]0.067927[/C][C]0.5218[/C][C]0.301896[/C][/ROW]
[ROW][C]21[/C][C]-0.068508[/C][C]-0.5262[/C][C]0.300353[/C][/ROW]
[ROW][C]22[/C][C]0.035771[/C][C]0.2748[/C][C]0.39223[/C][/ROW]
[ROW][C]23[/C][C]0.021335[/C][C]0.1639[/C][C]0.435193[/C][/ROW]
[ROW][C]24[/C][C]-0.125262[/C][C]-0.9622[/C][C]0.169949[/C][/ROW]
[ROW][C]25[/C][C]0.029991[/C][C]0.2304[/C][C]0.409302[/C][/ROW]
[ROW][C]26[/C][C]0.189947[/C][C]1.459[/C][C]0.074933[/C][/ROW]
[ROW][C]27[/C][C]-0.267838[/C][C]-2.0573[/C][C]0.022043[/C][/ROW]
[ROW][C]28[/C][C]0.191955[/C][C]1.4744[/C][C]0.07284[/C][/ROW]
[ROW][C]29[/C][C]0.024632[/C][C]0.1892[/C][C]0.425293[/C][/ROW]
[ROW][C]30[/C][C]-0.195368[/C][C]-1.5006[/C][C]0.06939[/C][/ROW]
[ROW][C]31[/C][C]0.15744[/C][C]1.2093[/C][C]0.115682[/C][/ROW]
[ROW][C]32[/C][C]-0.010588[/C][C]-0.0813[/C][C]0.46773[/C][/ROW]
[ROW][C]33[/C][C]-0.158743[/C][C]-1.2193[/C][C]0.113786[/C][/ROW]
[ROW][C]34[/C][C]0.14006[/C][C]1.0758[/C][C]0.143194[/C][/ROW]
[ROW][C]35[/C][C]-0.048219[/C][C]-0.3704[/C][C]0.356213[/C][/ROW]
[ROW][C]36[/C][C]-0.055214[/C][C]-0.4241[/C][C]0.336514[/C][/ROW]
[ROW][C]37[/C][C]0.227397[/C][C]1.7467[/C][C]0.042949[/C][/ROW]
[ROW][C]38[/C][C]-0.242452[/C][C]-1.8623[/C][C]0.033771[/C][/ROW]
[ROW][C]39[/C][C]0.113286[/C][C]0.8702[/C][C]0.193868[/C][/ROW]
[ROW][C]40[/C][C]0.030518[/C][C]0.2344[/C][C]0.407739[/C][/ROW]
[ROW][C]41[/C][C]-0.148316[/C][C]-1.1392[/C][C]0.129604[/C][/ROW]
[ROW][C]42[/C][C]0.074826[/C][C]0.5747[/C][C]0.283823[/C][/ROW]
[ROW][C]43[/C][C]0.048866[/C][C]0.3753[/C][C]0.354374[/C][/ROW]
[ROW][C]44[/C][C]-0.107056[/C][C]-0.8223[/C][C]0.207105[/C][/ROW]
[ROW][C]45[/C][C]0.110391[/C][C]0.8479[/C][C]0.199951[/C][/ROW]
[ROW][C]46[/C][C]-0.016675[/C][C]-0.1281[/C][C]0.449261[/C][/ROW]
[ROW][C]47[/C][C]-0.036772[/C][C]-0.2824[/C][C]0.389294[/C][/ROW]
[ROW][C]48[/C][C]0.061268[/C][C]0.4706[/C][C]0.319828[/C][/ROW]
[/TABLE]
Source: https://freestatistics.org/blog/index.php?pk=109295&T=1

Globally Unique Identifier (entire table): ba.freestatistics.org/blog/index.php?pk=109295&T=1

As an alternative you can also use a QR Code:  

The GUIDs for individual cells are displayed in the table below:

Autocorrelation Function
Time lag kACF(k)T-STATP-value
1-0.517008-3.97129.8e-05
20.0008780.00670.49732
30.2353091.80740.037896
4-0.302022-2.31990.011913
50.003660.02810.488833
60.2674642.05440.022186
7-0.380938-2.9260.002434
80.3124522.40.009785
90.0388530.29840.383209
10-0.345907-2.6570.005064
110.4735763.63760.00029
12-0.329533-2.53120.007026
13-0.058606-0.45020.327121
140.1401381.07640.14306
150.0124960.0960.46193
16-0.187359-1.43910.077699
170.2884262.21540.015301
18-0.185415-1.42420.079828
190.033190.25490.399828
200.0679270.52180.301896
21-0.068508-0.52620.300353
220.0357710.27480.39223
230.0213350.16390.435193
24-0.125262-0.96220.169949
250.0299910.23040.409302
260.1899471.4590.074933
27-0.267838-2.05730.022043
280.1919551.47440.07284
290.0246320.18920.425293
30-0.195368-1.50060.06939
310.157441.20930.115682
32-0.010588-0.08130.46773
33-0.158743-1.21930.113786
340.140061.07580.143194
35-0.048219-0.37040.356213
36-0.055214-0.42410.336514
370.2273971.74670.042949
38-0.242452-1.86230.033771
390.1132860.87020.193868
400.0305180.23440.407739
41-0.148316-1.13920.129604
420.0748260.57470.283823
430.0488660.37530.354374
44-0.107056-0.82230.207105
450.1103910.84790.199951
46-0.016675-0.12810.449261
47-0.036772-0.28240.389294
480.0612680.47060.319828


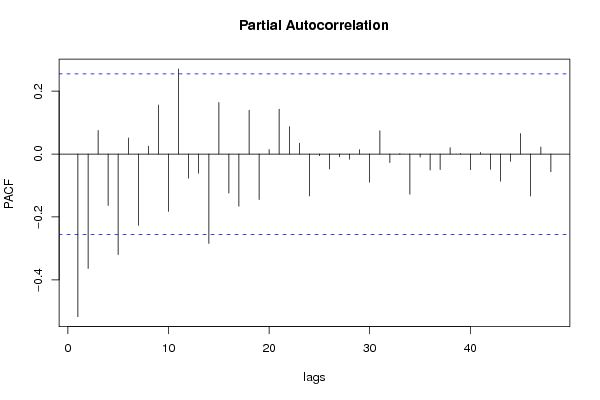
Partial Autocorrelation Function
Time lag kPACF(k)T-STATP-value
1-0.517008-3.97129.8e-05
2-0.363612-2.7930.003515
30.0753930.57910.28236
4-0.16344-1.25540.107141
5-0.319731-2.45590.008509
60.0508780.39080.348676
7-0.226353-1.73870.043656
80.024970.19180.424281
90.1559651.1980.117856
10-0.182211-1.39960.083436
110.2707712.07980.020947
12-0.076849-0.59030.278626
13-0.060779-0.46690.321163
14-0.284264-2.18350.016495
150.1639831.25960.10639
16-0.124085-0.95310.17221
17-0.165502-1.27120.104315
180.1394981.07150.144154
19-0.144664-1.11120.135499
200.0145960.11210.455558
210.1428321.09710.138525
220.08710.6690.253043
230.0345460.26540.395832
24-0.132967-1.02130.155631
25-0.005064-0.03890.484552
26-0.04736-0.36380.358661
27-0.008757-0.06730.473299
28-0.016063-0.12340.451112
290.0141920.1090.456781
30-0.089558-0.68790.247103
310.0740210.56860.285904
32-0.026843-0.20620.418677
330.0015370.01180.495309
34-0.127419-0.97870.165857
35-0.009389-0.07210.471375
36-0.050822-0.39040.348834
37-0.049214-0.3780.353387
380.0203150.1560.438265
390.0022020.01690.493282
40-0.049656-0.38140.352133
410.0052240.04010.484063
42-0.048618-0.37340.355078
43-0.086139-0.66160.255388
44-0.023108-0.17750.429864
450.0651150.50020.309413
46-0.133677-1.02680.154355
470.0223150.17140.432247
48-0.056212-0.43180.333741

\begin{tabular}{lllllllll}
\hline
Partial Autocorrelation Function \tabularnewline
Time lag k & PACF(k) & T-STAT & P-value \tabularnewline
1 & -0.517008 & -3.9712 & 9.8e-05 \tabularnewline
2 & -0.363612 & -2.793 & 0.003515 \tabularnewline
3 & 0.075393 & 0.5791 & 0.28236 \tabularnewline
4 & -0.16344 & -1.2554 & 0.107141 \tabularnewline
5 & -0.319731 & -2.4559 & 0.008509 \tabularnewline
6 & 0.050878 & 0.3908 & 0.348676 \tabularnewline
7 & -0.226353 & -1.7387 & 0.043656 \tabularnewline
8 & 0.02497 & 0.1918 & 0.424281 \tabularnewline
9 & 0.155965 & 1.198 & 0.117856 \tabularnewline
10 & -0.182211 & -1.3996 & 0.083436 \tabularnewline
11 & 0.270771 & 2.0798 & 0.020947 \tabularnewline
12 & -0.076849 & -0.5903 & 0.278626 \tabularnewline
13 & -0.060779 & -0.4669 & 0.321163 \tabularnewline
14 & -0.284264 & -2.1835 & 0.016495 \tabularnewline
15 & 0.163983 & 1.2596 & 0.10639 \tabularnewline
16 & -0.124085 & -0.9531 & 0.17221 \tabularnewline
17 & -0.165502 & -1.2712 & 0.104315 \tabularnewline
18 & 0.139498 & 1.0715 & 0.144154 \tabularnewline
19 & -0.144664 & -1.1112 & 0.135499 \tabularnewline
20 & 0.014596 & 0.1121 & 0.455558 \tabularnewline
21 & 0.142832 & 1.0971 & 0.138525 \tabularnewline
22 & 0.0871 & 0.669 & 0.253043 \tabularnewline
23 & 0.034546 & 0.2654 & 0.395832 \tabularnewline
24 & -0.132967 & -1.0213 & 0.155631 \tabularnewline
25 & -0.005064 & -0.0389 & 0.484552 \tabularnewline
26 & -0.04736 & -0.3638 & 0.358661 \tabularnewline
27 & -0.008757 & -0.0673 & 0.473299 \tabularnewline
28 & -0.016063 & -0.1234 & 0.451112 \tabularnewline
29 & 0.014192 & 0.109 & 0.456781 \tabularnewline
30 & -0.089558 & -0.6879 & 0.247103 \tabularnewline
31 & 0.074021 & 0.5686 & 0.285904 \tabularnewline
32 & -0.026843 & -0.2062 & 0.418677 \tabularnewline
33 & 0.001537 & 0.0118 & 0.495309 \tabularnewline
34 & -0.127419 & -0.9787 & 0.165857 \tabularnewline
35 & -0.009389 & -0.0721 & 0.471375 \tabularnewline
36 & -0.050822 & -0.3904 & 0.348834 \tabularnewline
37 & -0.049214 & -0.378 & 0.353387 \tabularnewline
38 & 0.020315 & 0.156 & 0.438265 \tabularnewline
39 & 0.002202 & 0.0169 & 0.493282 \tabularnewline
40 & -0.049656 & -0.3814 & 0.352133 \tabularnewline
41 & 0.005224 & 0.0401 & 0.484063 \tabularnewline
42 & -0.048618 & -0.3734 & 0.355078 \tabularnewline
43 & -0.086139 & -0.6616 & 0.255388 \tabularnewline
44 & -0.023108 & -0.1775 & 0.429864 \tabularnewline
45 & 0.065115 & 0.5002 & 0.309413 \tabularnewline
46 & -0.133677 & -1.0268 & 0.154355 \tabularnewline
47 & 0.022315 & 0.1714 & 0.432247 \tabularnewline
48 & -0.056212 & -0.4318 & 0.333741 \tabularnewline
\hline
\end{tabular}
%Source: https://freestatistics.org/blog/index.php?pk=109295&T=2

[TABLE]
[ROW][C]Partial Autocorrelation Function[/C][/ROW]
[ROW][C]Time lag k[/C][C]PACF(k)[/C][C]T-STAT[/C][C]P-value[/C][/ROW]
[ROW][C]1[/C][C]-0.517008[/C][C]-3.9712[/C][C]9.8e-05[/C][/ROW]
[ROW][C]2[/C][C]-0.363612[/C][C]-2.793[/C][C]0.003515[/C][/ROW]
[ROW][C]3[/C][C]0.075393[/C][C]0.5791[/C][C]0.28236[/C][/ROW]
[ROW][C]4[/C][C]-0.16344[/C][C]-1.2554[/C][C]0.107141[/C][/ROW]
[ROW][C]5[/C][C]-0.319731[/C][C]-2.4559[/C][C]0.008509[/C][/ROW]
[ROW][C]6[/C][C]0.050878[/C][C]0.3908[/C][C]0.348676[/C][/ROW]
[ROW][C]7[/C][C]-0.226353[/C][C]-1.7387[/C][C]0.043656[/C][/ROW]
[ROW][C]8[/C][C]0.02497[/C][C]0.1918[/C][C]0.424281[/C][/ROW]
[ROW][C]9[/C][C]0.155965[/C][C]1.198[/C][C]0.117856[/C][/ROW]
[ROW][C]10[/C][C]-0.182211[/C][C]-1.3996[/C][C]0.083436[/C][/ROW]
[ROW][C]11[/C][C]0.270771[/C][C]2.0798[/C][C]0.020947[/C][/ROW]
[ROW][C]12[/C][C]-0.076849[/C][C]-0.5903[/C][C]0.278626[/C][/ROW]
[ROW][C]13[/C][C]-0.060779[/C][C]-0.4669[/C][C]0.321163[/C][/ROW]
[ROW][C]14[/C][C]-0.284264[/C][C]-2.1835[/C][C]0.016495[/C][/ROW]
[ROW][C]15[/C][C]0.163983[/C][C]1.2596[/C][C]0.10639[/C][/ROW]
[ROW][C]16[/C][C]-0.124085[/C][C]-0.9531[/C][C]0.17221[/C][/ROW]
[ROW][C]17[/C][C]-0.165502[/C][C]-1.2712[/C][C]0.104315[/C][/ROW]
[ROW][C]18[/C][C]0.139498[/C][C]1.0715[/C][C]0.144154[/C][/ROW]
[ROW][C]19[/C][C]-0.144664[/C][C]-1.1112[/C][C]0.135499[/C][/ROW]
[ROW][C]20[/C][C]0.014596[/C][C]0.1121[/C][C]0.455558[/C][/ROW]
[ROW][C]21[/C][C]0.142832[/C][C]1.0971[/C][C]0.138525[/C][/ROW]
[ROW][C]22[/C][C]0.0871[/C][C]0.669[/C][C]0.253043[/C][/ROW]
[ROW][C]23[/C][C]0.034546[/C][C]0.2654[/C][C]0.395832[/C][/ROW]
[ROW][C]24[/C][C]-0.132967[/C][C]-1.0213[/C][C]0.155631[/C][/ROW]
[ROW][C]25[/C][C]-0.005064[/C][C]-0.0389[/C][C]0.484552[/C][/ROW]
[ROW][C]26[/C][C]-0.04736[/C][C]-0.3638[/C][C]0.358661[/C][/ROW]
[ROW][C]27[/C][C]-0.008757[/C][C]-0.0673[/C][C]0.473299[/C][/ROW]
[ROW][C]28[/C][C]-0.016063[/C][C]-0.1234[/C][C]0.451112[/C][/ROW]
[ROW][C]29[/C][C]0.014192[/C][C]0.109[/C][C]0.456781[/C][/ROW]
[ROW][C]30[/C][C]-0.089558[/C][C]-0.6879[/C][C]0.247103[/C][/ROW]
[ROW][C]31[/C][C]0.074021[/C][C]0.5686[/C][C]0.285904[/C][/ROW]
[ROW][C]32[/C][C]-0.026843[/C][C]-0.2062[/C][C]0.418677[/C][/ROW]
[ROW][C]33[/C][C]0.001537[/C][C]0.0118[/C][C]0.495309[/C][/ROW]
[ROW][C]34[/C][C]-0.127419[/C][C]-0.9787[/C][C]0.165857[/C][/ROW]
[ROW][C]35[/C][C]-0.009389[/C][C]-0.0721[/C][C]0.471375[/C][/ROW]
[ROW][C]36[/C][C]-0.050822[/C][C]-0.3904[/C][C]0.348834[/C][/ROW]
[ROW][C]37[/C][C]-0.049214[/C][C]-0.378[/C][C]0.353387[/C][/ROW]
[ROW][C]38[/C][C]0.020315[/C][C]0.156[/C][C]0.438265[/C][/ROW]
[ROW][C]39[/C][C]0.002202[/C][C]0.0169[/C][C]0.493282[/C][/ROW]
[ROW][C]40[/C][C]-0.049656[/C][C]-0.3814[/C][C]0.352133[/C][/ROW]
[ROW][C]41[/C][C]0.005224[/C][C]0.0401[/C][C]0.484063[/C][/ROW]
[ROW][C]42[/C][C]-0.048618[/C][C]-0.3734[/C][C]0.355078[/C][/ROW]
[ROW][C]43[/C][C]-0.086139[/C][C]-0.6616[/C][C]0.255388[/C][/ROW]
[ROW][C]44[/C][C]-0.023108[/C][C]-0.1775[/C][C]0.429864[/C][/ROW]
[ROW][C]45[/C][C]0.065115[/C][C]0.5002[/C][C]0.309413[/C][/ROW]
[ROW][C]46[/C][C]-0.133677[/C][C]-1.0268[/C][C]0.154355[/C][/ROW]
[ROW][C]47[/C][C]0.022315[/C][C]0.1714[/C][C]0.432247[/C][/ROW]
[ROW][C]48[/C][C]-0.056212[/C][C]-0.4318[/C][C]0.333741[/C][/ROW]
[/TABLE]
Source: https://freestatistics.org/blog/index.php?pk=109295&T=2

Globally Unique Identifier (entire table): ba.freestatistics.org/blog/index.php?pk=109295&T=2

As an alternative you can also use a QR Code:  

The GUIDs for individual cells are displayed in the table below:

Partial Autocorrelation Function
Time lag kPACF(k)T-STATP-value
1-0.517008-3.97129.8e-05
2-0.363612-2.7930.003515
30.0753930.57910.28236
4-0.16344-1.25540.107141
5-0.319731-2.45590.008509
60.0508780.39080.348676
7-0.226353-1.73870.043656
80.024970.19180.424281
90.1559651.1980.117856
10-0.182211-1.39960.083436
110.2707712.07980.020947
12-0.076849-0.59030.278626
13-0.060779-0.46690.321163
14-0.284264-2.18350.016495
150.1639831.25960.10639
16-0.124085-0.95310.17221
17-0.165502-1.27120.104315
180.1394981.07150.144154
19-0.144664-1.11120.135499
200.0145960.11210.455558
210.1428321.09710.138525
220.08710.6690.253043
230.0345460.26540.395832
24-0.132967-1.02130.155631
25-0.005064-0.03890.484552
26-0.04736-0.36380.358661
27-0.008757-0.06730.473299
28-0.016063-0.12340.451112
290.0141920.1090.456781
30-0.089558-0.68790.247103
310.0740210.56860.285904
32-0.026843-0.20620.418677
330.0015370.01180.495309
34-0.127419-0.97870.165857
35-0.009389-0.07210.471375
36-0.050822-0.39040.348834
37-0.049214-0.3780.353387
380.0203150.1560.438265
390.0022020.01690.493282
40-0.049656-0.38140.352133
410.0052240.04010.484063
42-0.048618-0.37340.355078
43-0.086139-0.66160.255388
44-0.023108-0.17750.429864
450.0651150.50020.309413
46-0.133677-1.02680.154355
470.0223150.17140.432247
48-0.056212-0.43180.333741


Parameters (Session):
par1 = 48 ; par2 = 1 ; par3 = 1 ; par4 = 1 ; par5 = 12 ; par6 = White Noise ; par7 = 0.95 ;
Parameters (R input):
par1 = 48 ; par2 = 1 ; par3 = 1 ; par4 = 1 ; par5 = 12 ; par6 = White Noise ; par7 = 0.95 ;
R code (references can be found in the software module):
if (par1 == 'Default') {
par1 = 10*log10(length(x))
} else {
par1 <- as.numeric(par1)
}
par2 <- as.numeric(par2)
par3 <- as.numeric(par3)
par4 <- as.numeric(par4)
par5 <- as.numeric(par5)
if (par6 == 'White Noise') par6 <- 'white' else par6 <- 'ma'
par7 <- as.numeric(par7)
if (par2 == 0) {
x <- log(x)
} else {
x <- (x ^ par2 - 1) / par2
}
if (par3 > 0) x <- diff(x,lag=1,difference=par3)
if (par4 > 0) x <- diff(x,lag=par5,difference=par4)
bitmap(file='pic1.png')
racf <- acf(x, par1, main='Autocorrelation', xlab='time lag', ylab='ACF', ci.type=par6, ci=par7, sub=paste('(lambda=',par2,', d=',par3,', D=',par4,', CI=', par7, ', CI type=',par6,')',sep=''))
dev.off()
bitmap(file='pic2.png')
rpacf <- pacf(x,par1,main='Partial Autocorrelation',xlab='lags',ylab='PACF')
dev.off()
(myacf <- c(racf$acf))
(mypacf <- c(rpacf$acf))
lengthx <- length(x)
sqrtn <- sqrt(lengthx)
load(file='createtable')
a<-table.start()
a<-table.row.start(a)
a<-table.element(a,'Autocorrelation Function',4,TRUE)
a<-table.row.end(a)
a<-table.row.start(a)
a<-table.element(a,'Time lag k',header=TRUE)
a<-table.element(a,hyperlink('basics.htm','ACF(k)','click here for more information about the Autocorrelation Function'),header=TRUE)
a<-table.element(a,'T-STAT',header=TRUE)
a<-table.element(a,'P-value',header=TRUE)
a<-table.row.end(a)
for (i in 2:(par1+1)) {
a<-table.row.start(a)
a<-table.element(a,i-1,header=TRUE)
a<-table.element(a,round(myacf[i],6))
mytstat <- myacf[i]*sqrtn
a<-table.element(a,round(mytstat,4))
a<-table.element(a,round(1-pt(abs(mytstat),lengthx),6))
a<-table.row.end(a)
}
a<-table.end(a)
table.save(a,file='mytable.tab')
a<-table.start()
a<-table.row.start(a)
a<-table.element(a,'Partial Autocorrelation Function',4,TRUE)
a<-table.row.end(a)
a<-table.row.start(a)
a<-table.element(a,'Time lag k',header=TRUE)
a<-table.element(a,hyperlink('basics.htm','PACF(k)','click here for more information about the Partial Autocorrelation Function'),header=TRUE)
a<-table.element(a,'T-STAT',header=TRUE)
a<-table.element(a,'P-value',header=TRUE)
a<-table.row.end(a)
for (i in 1:par1) {
a<-table.row.start(a)
a<-table.element(a,i,header=TRUE)
a<-table.element(a,round(mypacf[i],6))
mytstat <- mypacf[i]*sqrtn
a<-table.element(a,round(mytstat,4))
a<-table.element(a,round(1-pt(abs(mytstat),lengthx),6))
a<-table.row.end(a)
}
a<-table.end(a)
table.save(a,file='mytable1.tab')